


 |
市场调查报告书
商品编码
1440545
叶面肥料:全球市场占有率分析、产业趋势与统计、成长预测(2024-2030)Global Foliar Fertilizer - Market Share Analysis, Industry Trends & Statistics, Growth Forecasts (2024 - 2030) |
||||||
价格
※ 本网页内容可能与最新版本有所差异。详细情况请与我们联繫。
简介目录
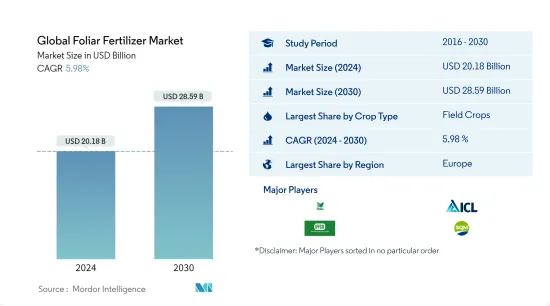
预计2024年全球叶面肥料市场规模为201.8亿美元,预计2030年将达285.9亿美元,预测期内(2024-2030年)复合年增长率为5.98%,预计还会成长。
主要亮点
- 氮肥:UAN等低淋溶氮肥因其毒性较小且不污染环境而受到世界各地农民的青睐。
- 氮肥:由于技术进步以及种植者对永续性和精密农业日益增长的兴趣,氮肥叶面肥料市场成长最快。
- 按作物类型分類的最大部分 - 草坪/观赏植物:种植面积的增加、对污染的日益关注以及世界各地生态旅游的发展正在增加此类作物对肥料的需求。
- 最大的国家-美国:美国的土壤呈酸性,HH 值不平衡,增加了对叶面肥料的需求。
叶面肥料市场趋势
按作物类型划分,田间作物是最大的部分。
- 2021年叶面施肥占肥料市场总量的11.3%。 2021年叶面肥市场总量中,田间作物占83.65%,园艺作物占11.2%,草坪及观赏作物占其余7.1%。全球90%以上的农业用地集中用于种植田间作物。
- 大田田间作物叶面肥料使用量的市场占有率在亚太地区为 40.2%,在欧洲为 33.8%。 2021年南美洲占22.0%的份额。叶面肥料的使用正在扩大,因为它们易于使用叶面喷布技术施用,并且养分吸收效率高。
- 2021年,亚太地区市场占有率为28.9%,南美洲市占率为23.64%,其中亚太和南美洲地区绝大多数在园艺作物中使用叶面肥料。包括中国和印度等国家在内的亚太地区是化肥消耗率最高的地区之一,并且有大面积的农业种植面积。根据资料显示,占世界园艺作物种植面积的73.0%。第二名是欧洲,占 16.0%,第三名是北美,占 2.0%。
- 由于拥有众多高尔夫球场和私人草坪区,北美地区对于草坪和叶面肥料行业极为重要。美国的草坪覆盖面积为 500 万公顷,其中包括所有体育场、草坪和公园。
- 因此,全球各作物类型的叶面肥料消费量预计将在预测期内成长。
欧洲是最大的区域市场。
- 叶面肥料的施用在世界各地已应用作物,特别是在谷物和园艺作物上。
- 欧洲在叶面肥料市场上占据主导地位,2021年占市场占有率的31.4%。研究期间增长了 10.4%。欧洲许多地区土壤微量元素的缺乏严重影响作物的产量和质量,特别是土壤缺乏锰、锌和铁。实证研究表明,该地区分别有60.0%和28.0%的土壤铁、锌含量不足。这可能会在预测期内推动该地区的市场。
- 研究期间,亚太叶面肥料市场呈现稳定成长,2021年总价值达59.9亿美元,消费量1,240万吨。田间作物占比最高,为 83.1%,2021 年达 49.8 亿美元。
- 在亚太地区,中国占有43.1%的份额。在中国,农民广泛向稻田散布锌和铁,以提高作物产量。我国蔬果也广泛采用叶面喷布微量元素来提升作物品质。
- 南美洲占全球叶面喷布市场的18.0%。研究期间,该地区叶面喷布市场成长了36.0%,消费量成长了52.4%。预计该市场在预测期内的复合年增长率为 6.7%。
- 精密农业农业和保护性农业的采用,以及农业产量中对土壤微量元素的需求不断增加,预计将推动全球对叶面肥料的需求。
叶面肥料业概况
全球叶面肥料市场分散,前五家企业占20.00%。该市场的主要企业包括(按字母顺序排列)Haifa Group.、ICL Specialty Fertilizers、IFFCO、Sociedad Química y Minera (SQM) 和 Yara North America。
其他福利:
- Excel 格式的市场预测 (ME) 表
- 3 个月的分析师支持
目录
第一章执行摘要和主要发现
第二章 检举要约
第三章简介
- 研究假设和市场定义
- 调查范围
- 调查方法
第四章 产业主要趋势
- 主要作物种植面积
- 平均养分施用量
- 法律规范
- 价值炼和通路分析
第五章市场区隔
- 类型
- 复杂的
- 直的
- 按营养成分
- 微量元素
- 氮
- 磷酸
- 钾
- 次要营养素
- 作物类型
- 田间作物
- 园艺作物
- 用于草坪/装饰用途
- 地区
- 亚太地区
- 澳洲
- 孟加拉
- 中国
- 印度
- 印尼
- 日本
- 巴基斯坦
- 菲律宾
- 泰国
- 越南
- 其他亚太地区
- 欧洲
- 法国
- 德国
- 义大利
- 荷兰
- 俄罗斯
- 西班牙
- 乌克兰
- 英国
- 其他欧洲国家
- 中东/非洲
- 奈及利亚
- 沙乌地阿拉伯
- 南非
- 土耳其
- 其他中东和非洲
- 北美洲
- 加拿大
- 墨西哥
- 美国
- 北美其他地区
- 南美洲
- 阿根廷
- 巴西
- 南美洲其他地区
- 亚太地区
第六章 竞争形势
- 重大策略倡议
- 市场占有率分析
- 公司形势
- 公司简介
- Compo Expert
- Haifa Group.
- ICL Specialty Fertilizers
- IFFCO
- Koch Fertilizer LLC
- Sociedad Quimica y Minera(SQM)
- The Mosaic Company
- UPL Limited
- Yara North America
第七章 CEO 面临的关键策略问题
第8章附录
- 世界概况
- 概述
- 五力分析框架
- 世界价值链分析
- 市场动态(DRO)
- 资讯来源和参考文献
- 图表列表
- 重要见解
- 资料包
- 词彙表
简介目录
Product Code: 92597
The Global Foliar Fertilizer Market size is estimated at USD 20.18 billion in 2024, and is expected to reach USD 28.59 billion by 2030, growing at a CAGR of 5.98% during the forecast period (2024-2030).
Key Highlights
- Largest segment by Type - Nitrogenous : Nitrogenous fertilizers like UAN which is less prone to leaching are preferred by farmers around the globe due to its less toxicity with no environmental pollution.
- Fastest growing by Type - Nitrogenous : The nitrogenous foliar fertilizer market is the fastest growing due to technological advancements and increased growers focus on sustainability and precision farming.
- Largest Segment by Crop Type - Turf & Ornamental : The increasing area under cultivation with increasing concern over pollution and growing ecotourism across the globe has increased the fertilizer demand for such crops.
- Largest segment by Country - United States : The acidic nature and pH imbalances in soils of the United States raised the demand for foliar fertilizers, which can be applied directly on plant parts for easy absorption.
Foliar Fertilizer Market Trends
Field Crops is the largest segment by Crop Type.
- The foliar method of fertilizer application accounted for 11.3% of the overall fertilizer market value in 2021. Field crops accounted for 83.65%, horticultural crops accounted for 11.2%, and turfs and ornamental crops accounted for the remaining 7.1% of the total fertigation fertilizers market in 2021. More than 90% of the world's agricultural acreage is focused on the cultivation of field crops.
- Asia-Pacific and European areas held a market share of 40.2% and 33.8%, respectively, for the usage of foliar fertilizers in field crops. South America accounted for a share of 22.0% in 2021. The use of foliar fertilizers is expanding due to their ease of application via foliar spraying techniques, which also have better efficiency of nutrient uptake.
- With a market share of 28.9% and 23.64%, respectively, the Asia-Pacific and South American regions dominated the use of foliar fertilizers in horticultural crops in 2021. The Asia-Pacific region, which includes nations like China and India, is one of the regions with the highest fertilizer consumption rates and has a vast area dedicated to agricultural cultivation. According to the data, it accounted for 73.0% of the global area under horticultural crop cultivation. Europe and North America came in second and third, with 16.0% and 2.0% of the market share.
- Due to the presence of a large number of golf courses and private lawn areas, the North American region is crucial for the turf and ornamental foliar fertilizer segment. Turf grass covers 5.0 million ha of land in the United States, which includes all stadiums, lawns, and parks.
- Therefore, the global consumption of foliar fertilizers in respective crop types is anticipated to grow during the forecast period.
Europe is the largest segment by Region.
- Foliar application of fertilizers has long been practiced in many crops, particularly in cereal and horticulture crops globally.
- Europe dominated the foliar fertilizers market, accounting for 31.4% of the market share in 2021. It grew by 10.4% during the study period. Soil micronutrient deficiencies significantly affect crop yield and quality in many areas in Europe, such as manganese, zinc, and iron soil deficiencies are noted. Empirical studies have shown that 60.0% and 28.0% of the regional soil contained lower than-adequate levels of iron and zinc, respectively. It will drive the market in the region during the forecast period.
- The Asia-Pacific foliar fertilizer market witnessed stable growth during the study period, with an overall value amounting to USD 5.99 billion in 2021 with a consumption volume of 12.4 million metric ton. Field crops occupied the highest share of 83.1%, valued at USD 4.98 billion in 2021.
- Among the countries, China dominated the APAC region, accounting for 43.1% of the market share. In China, farmers extensively apply zinc and iron to paddy fields to enhance crop yields. The foliar application of micronutrients is also widely practiced for fruits and vegetables in China to improve the quality of the crop.
- South America accounted for 18.0% of the global foliar market. The market for foliar applications in the region has increased by 36.0% during the study period, and the consumption by volume has increased by 52.4%. The market is estimated to register a CAGR of 6.7% during the forecast period.
- The adoption of precision farming and protected agriculture and a rise in demand for soil micronutrients in agricultural yield is anticipated to boost the demand for foliar fertilizers globally.
Foliar Fertilizer Industry Overview
The Global Foliar Fertilizer Market is fragmented, with the top five companies occupying 20.00%. The major players in this market are Haifa Group., ICL Specialty Fertilizers, IFFCO, Sociedad Quimica y Minera (SQM) and Yara North America (sorted alphabetically).
Additional Benefits:
- The market estimate (ME) sheet in Excel format
- 3 months of analyst support
TABLE OF CONTENTS
1 EXECUTIVE SUMMARY & KEY FINDINGS
2 REPORT OFFERS
3 INTRODUCTION
- 3.1 Study Assumptions & Market Definition
- 3.2 Scope of the Study
- 3.3 Research Methodology
4 KEY INDUSTRY TRENDS
- 4.1 Acreage Of Major Crop Types
- 4.2 Average Nutrient Application Rates
- 4.3 Regulatory Framework
- 4.4 Value Chain & Distribution Channel Analysis
5 MARKET SEGMENTATION
- 5.1 Type
- 5.1.1 Complex
- 5.1.2 Straight
- 5.1.2.1 By Nutrient
- 5.1.2.1.1 Micronutrients
- 5.1.2.1.2 Nitrogenous
- 5.1.2.1.3 Phosphatic
- 5.1.2.1.4 Potassic
- 5.1.2.1.5 Secondary Macronutrients
- 5.2 Crop Type
- 5.2.1 Field Crops
- 5.2.2 Horticultural Crops
- 5.2.3 Turf & Ornamental
- 5.3 Region
- 5.3.1 Asia-Pacific
- 5.3.1.1 Australia
- 5.3.1.2 Bangladesh
- 5.3.1.3 China
- 5.3.1.4 India
- 5.3.1.5 Indonesia
- 5.3.1.6 Japan
- 5.3.1.7 Pakistan
- 5.3.1.8 Philippines
- 5.3.1.9 Thailand
- 5.3.1.10 Vietnam
- 5.3.1.11 Rest Of Asia-Pacific
- 5.3.2 Europe
- 5.3.2.1 France
- 5.3.2.2 Germany
- 5.3.2.3 Italy
- 5.3.2.4 Netherlands
- 5.3.2.5 Russia
- 5.3.2.6 Spain
- 5.3.2.7 Ukraine
- 5.3.2.8 United Kingdom
- 5.3.2.9 Rest Of Europe
- 5.3.3 Middle East & Africa
- 5.3.3.1 Nigeria
- 5.3.3.2 Saudi Arabia
- 5.3.3.3 South Africa
- 5.3.3.4 Turkey
- 5.3.3.5 Rest Of Middle East & Africa
- 5.3.4 North America
- 5.3.4.1 Canada
- 5.3.4.2 Mexico
- 5.3.4.3 United States
- 5.3.4.4 Rest Of North America
- 5.3.5 South America
- 5.3.5.1 Argentina
- 5.3.5.2 Brazil
- 5.3.5.3 Rest Of South America
- 5.3.1 Asia-Pacific
6 COMPETITIVE LANDSCAPE
- 6.1 Key Strategic Moves
- 6.2 Market Share Analysis
- 6.3 Company Landscape
- 6.4 Company Profiles
- 6.4.1 Compo Expert
- 6.4.2 Haifa Group.
- 6.4.3 ICL Specialty Fertilizers
- 6.4.4 IFFCO
- 6.4.5 Koch Fertilizer LLC
- 6.4.6 Sociedad Quimica y Minera (SQM)
- 6.4.7 The Mosaic Company
- 6.4.8 UPL Limited
- 6.4.9 Yara North America
7 KEY STRATEGIC QUESTIONS FOR FERTILIZER CEOS
8 APPENDIX
- 8.1 Global Overview
- 8.1.1 Overview
- 8.1.2 Porter's Five Forces Framework
- 8.1.3 Global Value Chain Analysis
- 8.1.4 Market Dynamics (DROs)
- 8.2 Sources & References
- 8.3 List of Tables & Figures
- 8.4 Primary Insights
- 8.5 Data Pack
- 8.6 Glossary of Terms
02-2729-4219
+886-2-2729-4219


