


 |
市场调查报告书
商品编码
1441558
电动客车:全球市场占有率分析、产业趋势与统计、成长预测(2024-2029)Global Electric Bus - Market Share Analysis, Industry Trends & Statistics, Growth Forecasts (2024 - 2029) |
||||||
价格
※ 本网页内容可能与最新版本有所差异。详细情况请与我们联繫。
简介目录
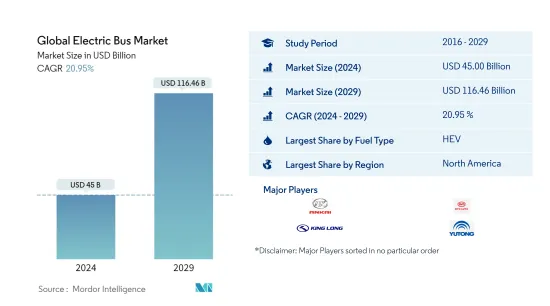
预计2024年全球电动客车市场规模将达450亿美元,预计2029年将达到1,164.6亿美元,预测期内(2024-2029年)复合年增长率为20.95%。
主要亮点
- 按燃料类型分類的最大细分市场 - 混合动力汽车:过去二十年的公共和私人投资开发了可与内燃机公车竞争的公车。这使得混合公车成为全球电动公车市场上最大的燃料类型。
- 按燃料类型划分成长最快的细分市场 - 纯电动车:政府为减少碳排放而采取的做法和私人计划以及充电基础设施的发展,使纯电动车成为全球客车中成长最快的细分市场。它是一种燃料类型。
- 按国家/地区划分最大的细分市场 -美国:中国是电动公车市场的主要企业,占全球全电动公车的 98%。这是因为主要的电动公车製造商都是中国製造。
- 第二市场参与者 - HEV:该公司专注于研发活动。凭藉丰富的电动巴士车型和在中国市场的强大地位,中通客车已成为全球客车市场的第二领导者。
电动客车市场趋势
按燃料类型划分,混合动力汽车是最大的细分市场。
- 燃料占任何车辆营运成本的很大一部分。使用电动公车作为大众交通工具不仅可以降低燃料成本,还可以降低其他初始成本和总拥有成本。到2030年,电动公车的价格预计将降至柴油公车的价格水准。与柴油引擎公车相比,电动公车可降低 81-83% 的维护和营运成本。公众对空气污染、气候变迁和柴油价格上涨的认识不断提高,是促使大多数州和城市交通当局越来越多地将清洁大众交通工具解决方案纳入其区域发展计画的一些因素。
- 电动巴士市场有潜力填补大众交通工具系统的空白。透过减少与营运和维护相关的费用,并减少与公共健康和环境相关的隐性成本,公共巴士的大规模电气化为相关人员带来了显着的利益,并增加了服务供应商和服务提供商在提供利益方面取得平衡的可能性服务之间。随着各国政府大力推动向电动车的过渡,大众交通工具和电动公车供应商有潜力在适当的法规结构和市场机制的帮助下引领市场。
- 电动巴士生态系统是根据既定的政府指导方针实施的。然而,从规划、相关人员责任和营运角度来看,电动公车充电站的安装和管理已成为一项紧迫的挑战,也是促进电动公车生态系统发展的最重要问题,需要解决:优先权。
按地区划分,北美是最大的部分。
- 燃料占任何车辆营运成本的很大一部分。随着燃料成本的上升,使用电动公车作为大众交通工具不仅可以降低燃料成本,还可以降低其他初始成本和总拥有成本。到2030年,电动公车的价格预计将降至柴油公车的价格。与柴油引擎公车相比,电动公车可降低 81-83% 的维护和营运成本。
- 柴油公车的平均成本约为 50 万美元,而电动公车的平均成本为 75 万美元。儘管初始成本很高,但电动公车通常是一种经济高效的替代方案,并且由于维护和燃料成本较低而降低了运营成本,可以在公车的整个生命週期内节省大量成本。同时,公车车的相对稳定性也会提高成本的可预测性。电费和石化燃料价格的比较。由于政策优惠,电动公车在经济上变得可行。维护和燃料成本已显着降低。根据电动公车製造商介绍,电动公车可节省近40万美元的燃油成本和12.5万美元的维护成本,足以弥补较高的初始成本。
- 电动巴士生态系统的上述要素已根据既定的政府指导方针实施。然而,电动巴士充电站的安装和管理在规划、相关人员责任范围和运营方面都存在紧迫问题,需要优先解决,以促进电动巴士生态系统的发展。 。在世界上。
电动客车产业概况
全球电动客车市场整合度较高,前五家企业占比达67.30%。
其他福利
- Excel 格式的市场预测 (ME) 表
- 3 个月分析师支持
目录
第一章执行摘要和主要发现
第二章 提供报告
第三章简介
- 研究假设和市场定义
- 调查范围
- 调查方法
第四章 产业主要趋势
- 人口
- GDP
- CVP
- 通货膨胀率
- 汽车贷款利率
- 电池价格(每度电)
- 物流绩效指数
- 电动的影响
- 新XEV车型发布
- 充电站的部署
- 法律规范
- 价值炼和通路分析
第五章市场区隔
- 汽油种类
- BEV
- FCEV
- HEV
- PHEV
- 地区
- 非洲
- 南非
- 亚太地区
- 澳洲
- 中国
- 印度
- 印尼
- 日本
- 马来西亚
- 韩国
- 泰国
- 其他亚太地区
- 欧洲
- 奥地利
- 比利时
- 捷克共和国
- 丹麦
- 爱沙尼亚
- 法国
- 德国
- 爱尔兰
- 义大利
- 拉脱维亚
- 立陶宛
- 挪威
- 波兰
- 俄罗斯
- 西班牙
- 瑞典
- 英国
- 欧洲其他地区
- 中东
- 阿拉伯聯合大公国
- 其他多边环境协定
- 中东
- 北美洲
- 加拿大
- 墨西哥
- 美国
- 北美其他地区
- 南美洲
- 拉丁美洲其他地区
- 非洲
第六章 竞争形势
- 重大策略倡议
- 市场占有率分析
- 公司形势
- 公司简介
- Anhui Ankai Automobile Co. Ltd
- Ashok Leyland
- BYD Company Limited
- Daimler AG
- King Long United Automotive Industry Co. Ltd.
- NFI Group Inc.
- Proterra Inc.
- Tata Motors Limited
- Volvo Group
- Zhengzhou Yutong Group Co. Ltd.
- Zhongtong Bus Holding Co. Ltd.
第七章 CEO 面临的关键策略问题
第8章附录
- 世界概况
- 概述
- 波特的五力框架
- 全球价值链分析
- 市场动态(DRO)
- 来源和参考文献
- 表格和图形列表
- 重要见解
- 资料包
- 词彙表
简介目录
Product Code: 93052
The Global Electric Bus Market size is estimated at USD 45 billion in 2024, and is expected to reach USD 116.46 billion by 2029, growing at a CAGR of 20.95% during the forecast period (2024-2029).
Key Highlights
- Largest Segment by Fuel Type - HEV : Public and private investments made over the last two decades have developed the buses to compete with ICE-based buses. Which is making Hybrid buses the largest fuel type in global e-bus market.
- Fastest-growing Segment by Fuel Type - BEV : The government practices and private programs to cut carbon emission, and development in charging infrastructure is making BEV the fastest growing fuel type in buses Globally.
- Largest Segment by Country - US : China is a major player in the electric bus market, accounting for 98% of all-electric buses worldwide. This is due to the major e-bus manufacturers being from china.
- Second leading Market Player - HEV : The company has a strong focus on R&D activities. Variety of e bus models offering and strong hold on the Chinese market makes Zhongtong Bus Holding Co Ltd 2nd leading player in global bus market.
Electric Bus Market Trends
HEV is the largest segment by Fuel Type.
- Fuel constitutes a major part of the operating cost of any vehicle. Using an electric bus for public transport reduces fuel costs, as well as other upfront costs and the total cost of ownership. By 2030, the prices for electric buses are expected to decline to the price level of diesel-fueled buses. Electric buses help reduce 81-83% of the maintenance and operating costs compared to a diesel-engine bus. The rising general awareness about air pollution, climate change, and increasing diesel prices are some of the factors incentivizing most state and city transport authorities to increasingly accommodate clean public transport solutions in their regional development plans.
- The e-bus market has the potential to fill the gaps in the public transport system. By reducing expenses related to operation and maintenance and cutting down hidden costs linked to public health and the environment, mass electrification of public buses may allow the concerned stakeholders to reap huge benefits and help strike a balance in providing returns between the service providers and the service users over the long run. With a strong government push for EV transition, the public transport authorities and e-bus suppliers may drive the market with the help of a proper regulatory framework and market mechanism.
- The e-bus ecosystem is being implemented in accordance with established government guidelines. However, there is an immediate challenge of setting up and managing e-bus charging stations in terms of planning, the extent of stakeholders' responsibilities, and operation, which must be addressed as a high priority to expedite the development of the e-bus ecosystem across the world.
North America is the largest segment by Region.
- Fuel constitutes a major part of the operating cost of any vehicle. With the increasing costs of fuel, using an electric bus for public transport reduces not only the fuel cost but also other upfront costs and the total cost of ownership. By 2030, the prices for electric buses are expected to decline to those of diesel-fueled buses. Electric buses help reduce 81-83% of the maintenance and operating costs compared to diesel-engine buses.
- An average diesel transit bus costs approximately USD 500,000, compared to USD 750,000 for an electric bus. Despite these higher upfront costs, electric buses are often a cost-efficient alternative, producing major savings over the course of their lifetimes by offering lower operating costs from reduced spending on maintenance and fuel while also providing greater predictability in costs due to the relative stability of electricity prices compared to fossil fuel prices. Electric buses are becoming more financially viable with favorable policies; they have substantially reduced maintenance and fuel costs. According to electric bus manufacturers, electric buses save USD 400,000 in fuel expenses and nearly USD 125,000 in maintenance costs, more than making up for the higher upfront cost.
- The aforementioned factors of the e-bus ecosystem are being implemented in accordance with established government guidelines. However, there are immediate challenges in setting up and managing e-bus charging stations in terms of planning, the extent of stakeholders' responsibilities, and operations that must be addressed on a high priority in order to expedite the development of the e-bus ecosystem across the world.
Electric Bus Industry Overview
The Global Electric Bus Market is fairly consolidated, with the top five companies occupying 67.30%. The major players in this market are Anhui Ankai Automobile Co. Ltd, BYD Company Limited, King Long United Automotive Industry Co. Ltd., Zhengzhou Yutong Group Co. Ltd. and Zhongtong Bus Holding Co. Ltd. (sorted alphabetically).
Additional Benefits:
- The market estimate (ME) sheet in Excel format
- 3 months of analyst support
TABLE OF CONTENTS
1 EXECUTIVE SUMMARY & KEY FINDINGS
2 REPORT OFFERS
3 INTRODUCTION
- 3.1 Study Assumptions & Market Definition
- 3.2 Scope of the Study
- 3.3 Research Methodology
4 KEY INDUSTRY TRENDS
- 4.1 Population
- 4.2 GDP
- 4.3 CVP
- 4.4 Inflation Rate
- 4.5 Interest Rate For Auto Loans
- 4.6 Battery Price (per Kwh)
- 4.7 Logistics Performance Index
- 4.8 Electrification Impact
- 4.9 New XEV Models Announced
- 4.10 Charging Stations Deployment
- 4.11 Regulatory Framework
- 4.12 Value Chain & Distribution Channel Analysis
5 MARKET SEGMENTATION
- 5.1 Fuel Type
- 5.1.1 BEV
- 5.1.2 FCEV
- 5.1.3 HEV
- 5.1.4 PHEV
- 5.2 Region
- 5.2.1 Africa
- 5.2.1.1 South Africa
- 5.2.2 Asia-Pacific
- 5.2.2.1 Australia
- 5.2.2.2 China
- 5.2.2.3 India
- 5.2.2.4 Indonesia
- 5.2.2.5 Japan
- 5.2.2.6 Malaysia
- 5.2.2.7 South Korea
- 5.2.2.8 Thailand
- 5.2.2.9 Rest-of-APAC
- 5.2.3 Europe
- 5.2.3.1 Austria
- 5.2.3.2 Belgium
- 5.2.3.3 Czech Republic
- 5.2.3.4 Denmark
- 5.2.3.5 Estonia
- 5.2.3.6 France
- 5.2.3.7 Germany
- 5.2.3.8 Ireland
- 5.2.3.9 Italy
- 5.2.3.10 Latvia
- 5.2.3.11 Lithuania
- 5.2.3.12 Norway
- 5.2.3.13 Poland
- 5.2.3.14 Russia
- 5.2.3.15 Spain
- 5.2.3.16 Sweden
- 5.2.3.17 UK
- 5.2.3.18 Rest-of-Europe
- 5.2.4 Middle East
- 5.2.4.1 UAE
- 5.2.4.2 Rest-of-MEA
- 5.2.5 Miidle East
- 5.2.6 North America
- 5.2.6.1 Canada
- 5.2.6.2 Mexico
- 5.2.6.3 US
- 5.2.6.4 Rest-of-North America
- 5.2.7 South America
- 5.2.7.1 Rest-of-Latin America
- 5.2.1 Africa
6 COMPETITIVE LANDSCAPE
- 6.1 Key Strategic Moves
- 6.2 Market Share Analysis
- 6.3 Company Landscape
- 6.4 Company Profiles
- 6.4.1 Anhui Ankai Automobile Co. Ltd
- 6.4.2 Ashok Leyland
- 6.4.3 BYD Company Limited
- 6.4.4 Daimler AG
- 6.4.5 King Long United Automotive Industry Co. Ltd.
- 6.4.6 NFI Group Inc.
- 6.4.7 Proterra Inc.
- 6.4.8 Tata Motors Limited
- 6.4.9 Volvo Group
- 6.4.10 Zhengzhou Yutong Group Co. Ltd.
- 6.4.11 Zhongtong Bus Holding Co. Ltd.
7 KEY STRATEGIC QUESTIONS FOR VEHICLES CEOS
8 APPENDIX
- 8.1 Global Overview
- 8.1.1 Overview
- 8.1.2 Porter's Five Forces Framework
- 8.1.3 Global Value Chain Analysis
- 8.1.4 Market Dynamics (DROs)
- 8.2 Sources & References
- 8.3 List of Tables & Figures
- 8.4 Primary Insights
- 8.5 Data Pack
- 8.6 Glossary of Terms
02-2729-4219
+886-2-2729-4219
 2025年全球中大型电动客车(9-14公尺)市场报告
 全球能源储存及汽车动力电池防爆阀门市场、绩效及预测(2020-2031)
 2025-2029年全球电动公车市场2025年全球电动公车市场报告
 电动公车市场(按推进类型、长度、行驶里程和地区划分)
 全球电动公车市场(至 2030 年):按推进类型(BEV、FCEV)、电池(LFP、NMC、NCA)、长度(小于 9 公尺、9-14 公尺、超过 14 公尺)、用途(城市公车、长途客车、中型公车、校车)、汽车数量、电池容量、行驶里程、功率、自主性水平
 2024 年至 2030 年全球电动公车OEM的轻量化策略
 电动中型和大型客车市场:按类型、座椅数量、自主水平、应用和最终用途分类 - 2025-2030 年全球预测电动客车市场规模、份额、成长分析、按推进类型、按长度、按电池容量、按产量、按应用、按地区 - 行业预测,2024-2031 年电动客车市场:按组件、按巴士类型、按推进力、按电池类型、按电池容量、按座位数、按航程、按自主水平、按所有者、按应用 - 2025-2030 年全球预测
▼