


 |
市场调查报告书
商品编码
1444103
农业生技药品:市场占有率分析、产业趋势与统计、成长预测(2024-2029)Agricultural Biologicals - Market Share Analysis, Industry Trends & Statistics, Growth Forecasts (2024 - 2029) |
||||||
※ 本网页内容可能与最新版本有所差异。详细情况请与我们联繫。
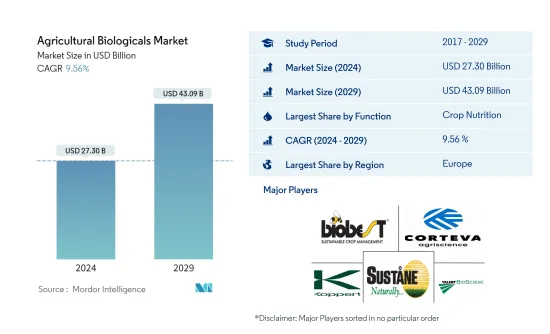
农业生技药品市场规模预计到2024年为273亿美元,预计到2029年将达到430.9亿美元,在预测期内(2024-2029年)增长9.56%,复合年增长率增长。
主要亮点
- 用餐肥料是最大的型态。骨粉主要用于解决作物种植对磷的需求,而血粉主要用于补充作物的氮素。
- 有机肥料是最常见的类型。以金额为准,粉状肥料在全球有机肥料市场中占据主导地位,到 2022 年将占市场份额 43.2%,同年紧随其后的是化肥。
- 中耕作物是最大的作物类型。欧洲在生物製药市场的原料作物市场价值中占据主导地位。到 2022 年,玉米、水稻、高粱和小麦将成为世界各地种植的最重要的中耕作物。
- 欧洲是最大的地区。随着有机作物面积的增加,该地区的农业生技药品市场在2017年至2022年间也增加了约40.6%。
农业生技药品市场趋势
作物营养最重要的功能
- 2022年,作物营养领域在全球农业生技药品市场中占据最高份额,金额计算占64.6%,按数量计算占98.1%。由于可用性高、成本低,有机肥料在 2022 年约占作物营养市场的 58.8%。
- 全球有机肥料市场以粉基肥料为主,2022年占43.2%。骨粉主要用于满足作物生产对磷的需求,而作物主要用于供应氮氮。
- 至2022年,中耕作物占作物营养部分的72.2%,其次是园艺作物和经济作物,份额分别为17.5%和10.3%。中耕作物占主导地位的部分原因是其种植面积大。
- 微生物占作物保护领域的大部分,2022 年占 310 万美元。如此高的份额是由于它能够控制多种害虫。与其他生物防治生物相比,大型细菌是贪婪的饲养者。
- 到 2022 年,由于捕食者攻击各种害虫物种及其生命阶段的能力,以金额为准计算,捕食者约占大型动物市场的 91.0%。
- 消费者对合成肥料负面影响的了解不断增加,国内外对有机产品的需求不断增加。因此,预计市场在预测期内将会成长。
欧洲是最大的地区
- 欧洲地区是世界领先的有机作物生产国之一,也是有机产品的最大消费国。德国和法国是该地区主要的有机农产品生产国,也是该地区市场上有机农产品消费量最高的国家。由于有机作物总面积的增加,区域市场扩大了约 22.9%。预计该市场在预测期内将成长约 63.4%,到预测期结束时将达到 141.1 亿美元。
- 亚太地区是有机产品生产大国,市场价值排名第二。中国和印度是该地区有机作物的主要生产国,也是该地区最大的有机产品消费者。 2017年至2021年,该地区有机农业面积大幅增加,从2017年的490万公顷增加到2021年的690万公顷。
- 2022年,北美占全球生物肥料市场的19.8%。该地区有机作物从2017年的140万公顷增加到2021年的160万公顷,增加了13.5%。该地区对有机食品的需求正在快速成长,2021年北美人均有机食品支出将达到109.7美元。
- 有机作物种植面积的扩大以及对有机产品和生物肥料需求的增加正在减少化肥的整体使用和作物生产成本。政府鼓励有机农业的倡议预计将在预测期内推动全球农业生物製品市场的发展,复合年增长率为 9.4%。
农业生技药品产业概况
农业生技药品市场较为分散,前五名企业占比为4.07%。市场的主要企业包括(按字母顺序排列)Biobest Group NV、Corteva Agriscience、Koppert Biological Systems Inc.、Sustane Natural Fertilizer Inc. 和 Valent Biosciences LLC。
其他福利
- Excel 格式的市场预测 (ME) 表
- 3 个月分析师支持
目录
第一章执行摘要和主要发现
第二章 提供报告
第三章简介
- 研究假设和市场定义
- 调查范围
- 调查方法
第四章 产业主要趋势
- 有机种植面积
- 人均有机产品支出
- 法律规范
- 价值炼和通路分析
第五章市场区隔
- 功能
- 作物营养
- 生物肥料
- 固氮螺菌
- 固氮菌
- 菌根
- 解磷细菌
- 根瘤菌
- 其他生物肥料
- 生物刺激剂
- 胺基酸
- 富里酸
- 腐植酸
- 蛋白质水解物
- 海藻萃取物
- 其他生物刺激剂
- 有机肥
- 肥料
- 用餐基肥料
- 油饼
- 其他有机肥
- 作物保护
- 生物防治剂
- 宏观的
- 微生物
- 生物农药
- 生物杀菌剂
- 生物除草剂
- 生物杀虫剂
- 其他生物农药
- 作物营养
- 作物类型
- 经济作物
- 园艺作物
- 中耕作物
- 地区
- 非洲
- 埃及
- 奈及利亚
- 南非
- 其他非洲
- 亚太地区
- 澳洲
- 中国
- 印度
- 印尼
- 日本
- 菲律宾
- 泰国
- 越南
- 其他亚太地区
- 欧洲
- 法国
- 德国
- 义大利
- 荷兰
- 俄罗斯
- 西班牙
- 土耳其
- 英国
- 其他欧洲国家
- 中东
- 伊朗
- 沙乌地阿拉伯
- 其他中东地区
- 北美洲
- 加拿大
- 墨西哥
- 美国
- 北美其他地区
- 南美洲
- 阿根廷
- 巴西
- 南美洲其他地区
- 非洲
第六章 竞争形势
- 重大策略倡议
- 市场占有率分析
- 公司形势
- 公司简介
- Agriculture Solutions Inc.
- Biobest Group NV
- Bioworks Inc.
- California Organic Fertilizers Inc.
- Cascade Agronomics LLC
- Corteva Agriscience
- Indogulf BioAg LLC(Biotech Division of Indogulf Company)
- Koppert Biological Systems Inc.
- Lallemand Inc.
- Samriddhi Crops India Pvt Ltd
- Sigma Agriscience LLC
- Sustane Natural Fertilizer Inc.
- Symborg Inc.
- The Espoma Company
- Valent Biosciences LLC
第七章 CEO 面临的关键策略问题
第8章附录
The Agricultural Biologicals Market size is estimated at USD 27.30 billion in 2024, and is expected to reach USD 43.09 billion by 2029, growing at a CAGR of 9.56% during the forecast period (2024-2029).
Key Highlights
- Meal Based Fertilizers is the Largest Form. Bone meal is predominantly utilized to address the crop cultivation requirement for phosphorous, while blood meal is deployed primarily for supplementing nitrogen in crops.
- Organic Fertilizer is the Largest Type. Meal-based fertilizers dominated the global organic fertilizer market interms of value which accounted for 43.2% of the market in 2022, followed by manures in the same year.
- Row Crops is the Largest Crop Type. Europe dominates the market value for row crops in biologicals market. In 2022, maize, rice, sorghum, and wheat are among the most important row crops cultivated globally.
- Europe is the Largest Region. With the increasing trend in organic crop area, the agricultural biologicals market in the region has also increased by about 40.6 percent during period of 2017 to 2022.
Agricultural Microbials Market Trends
Crop Nutrition is the largest Function
- The crop nutrition segment held the highest share of the global agricultural biologicals market in 2022, accounting for 64.6% by value and 98.1% by volume. Organic fertilizers accounted for about 58.8% of the crop nutrition market in 2022, owing to their vast availability and inexpensive cost.
- The global organic fertilizer market was dominated by meal-based fertilizers, which accounted for 43.2% in 2022. Bone meal is largely used to meet the phosphorus requirements of crop production, whereas blood meal is mostly used to supply nitrogen in crops.
- Row crops accounted for 72.2% of the crop nutrition segment in 2022, followed by horticultural and cash crops, which held shares of 17.5% and 10.3%, respectively. The dominance of row crops was partly due to their large cultivation area.
- Macrobials dominated the crop protection segment, accounting for USD 3.10 million in 2022. This high share was due to their ability to control a wide range of pests. When compared to other biocontrol organisms, macrobials are voracious feeders.
- In 2022, predators accounted for about 91.0% of the macrobial market by value due to their ability to attack various pest species and their life stages.
- Consumers' growing knowledge of the detrimental effects of synthetic fertilizers is boosting the demand for organic products both internationally and domestically. As a result, the market is expected to grow during the forecast period.
Europe is the largest Region
- The European region is one of the world's major producers of organic crops and the largest consumer of organic products. Germany and France are some of the major organic crop producers in the region, and they account for the highest organic product consumption in the regional market. Due to the rise in the overall organic crop area, the regional market has expanded by about 22.9%. The market is expected to grow by about 63.4% during the forecast period, reaching USD 14.11 billion by the end of the forecast period.
- The Asia-Pacific region is a large producer of organic products, ranking second in terms of market value. China and India are the region's leading organic crop producers and the region's largest organic product consumers as well. The region's organic agricultural area increased significantly from 2017 to 2021, growing from 4.9 million hectares in 2017 to 6.9 million hectares in 2021.
- North America accounted for 19.8% of the global biofertilizers market in 2022. The area under cultivation of organic crops in the region increased by 13.5% from 1.4 million hectares in 2017 to 1.6 million hectares in 2021. The demand for organic food in the region is growing rapidly, with an average per capita spending on organic food products in North America valued at USD 109.7 in 2021.
- The expanding organic crop areas and the rising demand for organic products and biological fertilizers lower the overall chemical fertilizer usage and crop production costs. The governments' efforts to encourage organic farming are expected to drive the global agricultural biologicals market during the forecast period, registering a CAGR of 9.4%.
Agricultural Microbials Industry Overview
The Agricultural Biologicals Market is fragmented, with the top five companies occupying 4.07%. The major players in this market are Biobest Group NV, Corteva Agriscience, Koppert Biological Systems Inc., Sustane Natural Fertilizer Inc. and Valent Biosciences LLC (sorted alphabetically).
Additional Benefits:
- The market estimate (ME) sheet in Excel format
- 3 months of analyst support
TABLE OF CONTENTS
1 EXECUTIVE SUMMARY & KEY FINDINGS
2 REPORT OFFERS
3 INTRODUCTION
- 3.1 Study Assumptions & Market Definition
- 3.2 Scope of the Study
- 3.3 Research Methodology
4 KEY INDUSTRY TRENDS
- 4.1 Area Under Organic Cultivation
- 4.2 Per Capita Spending On Organic Products
- 4.3 Regulatory Framework
- 4.4 Value Chain & Distribution Channel Analysis
5 MARKET SEGMENTATION
- 5.1 Function
- 5.1.1 Crop Nutrition
- 5.1.1.1 Biofertilizer
- 5.1.1.1.1 Azospirillum
- 5.1.1.1.2 Azotobacter
- 5.1.1.1.3 Mycorrhiza
- 5.1.1.1.4 Phosphate Solubilizing Bacteria
- 5.1.1.1.5 Rhizobium
- 5.1.1.1.6 Other Biofertilizers
- 5.1.1.2 Biostimulants
- 5.1.1.2.1 Amino Acids
- 5.1.1.2.2 Fulvic Acid
- 5.1.1.2.3 Humic Acid
- 5.1.1.2.4 Protein Hydrolysates
- 5.1.1.2.5 Seaweed Extracts
- 5.1.1.2.6 Other Biostimulants
- 5.1.1.3 Organic Fertilizer
- 5.1.1.3.1 Manure
- 5.1.1.3.2 Meal Based Fertilizers
- 5.1.1.3.3 Oilcakes
- 5.1.1.3.4 Other Organic Fertilizers
- 5.1.2 Crop Protection
- 5.1.2.1 Biocontrol Agents
- 5.1.2.1.1 Macrobials
- 5.1.2.1.2 Microbials
- 5.1.2.2 Biopesticides
- 5.1.2.2.1 Biofungicides
- 5.1.2.2.2 Bioherbicides
- 5.1.2.2.3 Bioinsecticides
- 5.1.2.2.4 Other Biopesticides
- 5.1.1 Crop Nutrition
- 5.2 Crop Type
- 5.2.1 Cash Crops
- 5.2.2 Horticultural Crops
- 5.2.3 Row Crops
- 5.3 Region
- 5.3.1 Africa
- 5.3.1.1 Egypt
- 5.3.1.2 Nigeria
- 5.3.1.3 South Africa
- 5.3.1.4 Rest of Africa
- 5.3.2 Asia-Pacific
- 5.3.2.1 Australia
- 5.3.2.2 China
- 5.3.2.3 India
- 5.3.2.4 Indonesia
- 5.3.2.5 Japan
- 5.3.2.6 Philippines
- 5.3.2.7 Thailand
- 5.3.2.8 Vietnam
- 5.3.2.9 Rest of Asia-Pacific
- 5.3.3 Europe
- 5.3.3.1 France
- 5.3.3.2 Germany
- 5.3.3.3 Italy
- 5.3.3.4 Netherlands
- 5.3.3.5 Russia
- 5.3.3.6 Spain
- 5.3.3.7 Turkey
- 5.3.3.8 United Kingdom
- 5.3.3.9 Rest of Europe
- 5.3.4 Middle East
- 5.3.4.1 Iran
- 5.3.4.2 Saudi Arabia
- 5.3.4.3 Rest of Middle East
- 5.3.5 North America
- 5.3.5.1 Canada
- 5.3.5.2 Mexico
- 5.3.5.3 United States
- 5.3.5.4 Rest of North America
- 5.3.6 South America
- 5.3.6.1 Argentina
- 5.3.6.2 Brazil
- 5.3.6.3 Rest of South America
- 5.3.1 Africa
6 COMPETITIVE LANDSCAPE
- 6.1 Key Strategic Moves
- 6.2 Market Share Analysis
- 6.3 Company Landscape
- 6.4 Company Profiles
- 6.4.1 Agriculture Solutions Inc.
- 6.4.2 Biobest Group NV
- 6.4.3 Bioworks Inc.
- 6.4.4 California Organic Fertilizers Inc.
- 6.4.5 Cascade Agronomics LLC
- 6.4.6 Corteva Agriscience
- 6.4.7 Indogulf BioAg LLC (Biotech Division of Indogulf Company)
- 6.4.8 Koppert Biological Systems Inc.
- 6.4.9 Lallemand Inc.
- 6.4.10 Samriddhi Crops India Pvt Ltd
- 6.4.11 Sigma Agriscience LLC
- 6.4.12 Sustane Natural Fertilizer Inc.
- 6.4.13 Symborg Inc.
- 6.4.14 The Espoma Company
- 6.4.15 Valent Biosciences LLC
7 KEY STRATEGIC QUESTIONS FOR AGRICULTURAL BIOLOGICALS CEOS
8 APPENDIX
- 8.1 Global Overview
- 8.1.1 Overview
- 8.1.2 Porter's Five Forces Framework
- 8.1.3 Global Value Chain Analysis
- 8.1.4 Market Dynamics (DROs)
- 8.2 Sources & References
- 8.3 List of Tables & Figures
- 8.4 Primary Insights
- 8.5 Data Pack
- 8.6 Glossary of Terms
 生物製药市场:按产品类型、作物类型、来源、应用划分 - 全球预测 2025-2030
 农业生技药品市场报告:趋势、预测和竞争分析(至 2030 年)
 农业生物製品市场:依类型、依应用、依形式、依作物类型、依地区、机会、预测,2017-2031年
 全球农业生技药品市场:按类型、原料、涂布形式、作物类型、地区划分 - 预测至 2029 年
 农业生技药品市场规模、份额、趋势分析报告:按作物类型、产品类型、应用方法、地区和细分市场预测,2024-2030 年
 全球农业生技药品市场 2024-2028
 2024-2032 年农业生物製品市场报告(按类型、来源、应用方式、应用和地区)
 2024 年农业生技药品全球市场报告
 农业生物製品市场:按产品类型、产品来源、应用方法、处理作物类型和主要地区分布:产业趋势和全球预测,2023-2035
 全球农业生物製品市场研究报告 - 2023 年至 2030 年产业分析、规模、份额、成长、趋势与预测