


 |
市场调查报告书
商品编码
1444181
生物肥料:市场占有率分析、产业趋势与统计、成长预测(2024-2029)Biofertilizer - Market Share Analysis, Industry Trends & Statistics, Growth Forecasts (2024 - 2029) |
||||||
※ 本网页内容可能与最新版本有所差异。详细情况请与我们联繫。
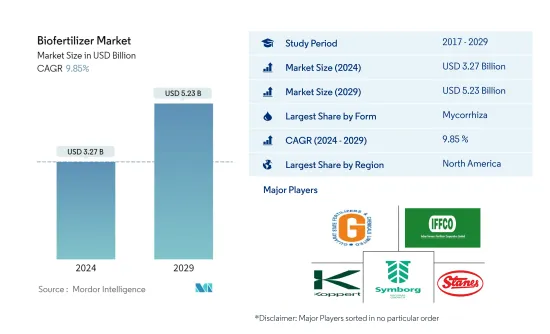
生物肥料市场规模预计到 2024 年为 32.7 亿美元,预计到 2029 年将达到 52.3 亿美元,预测期内(2024-2029 年)复合年增长率为 9.85%。
主要亮点
- 菌根是最大的型态。菌根,也称为丛枝菌根真菌(AMF),已被证明可显着提高作物产量。它是全球消耗最多的生物肥料。
- 根瘤菌是生长最快的型态。根瘤菌是最重要的固氮菌,与植物有共生关係,生活在豆科植物的根瘤中。
- 中耕作物是最大的作物类型。全球种植的主要中耕作物包括稻米、大麦、玉米、小麦、油菜籽、黑麦和大豆,2022年占生物肥料消费量量的74.6%。
- 北美是最大的地区。该地区有机作物历史同期增加了13.5%,从2017年的140万公顷增加到2021年的160万公顷。
生物肥料市场趋势
菌根是最大的型态
- 生物肥料是活的微生物,可以透过调动或增加土壤中养分的可用性来增强植物营养。农业中用作生物肥料最常见的微生物包括菌根真菌、固氮螺菌、固氮菌、根瘤菌和解磷细菌。
- 其中,菌根真菌是全球消耗最多的生物肥料。 2022年,占生物肥料领域的36.3%,市值为9.953亿美元,产量为9.66万吨。菌根增加植物根系的表面积,增加养分吸收。
- 根瘤菌是世界上消耗量第二大的生物肥料。 2022年,占生物肥料细分市场的24.8%。同年,北美在根瘤菌子区隔中占据主导地位,市场占有率为 52.7%。北美的根瘤菌子区隔以中耕作物为主,2022 年占 62.4%。根瘤菌与豆科作物(一种中耕作物)有共生关係。因此,根瘤菌子区隔以作物为主。北美也有广阔的中耕作物种植区。北美行间作物市场的根瘤菌子区隔预计在预测期内复合年增长率为 10.5%。
- 固氮螺菌占生物肥料产业的16.8%。北美在固氮螺菌子区隔占据主导地位,2022 年占 46.4%。在此历史时期内,市值成长了约57.8%。
- 因此,随着越来越多的农民寻求永续和环境友好的解决方案来提高作物产量和土壤健康,全球农业生物市场的生物肥料部分预计将在未来几年内增长。
北美是最大的地区
- 生物肥料是活的微生物,能够透过动员或增加土壤中养分的可用性来增强植物营养。北美和欧洲是世界上生物肥料的主要消费国。
- 2022年,北美占全球生物肥料市场的35.9%。该地区有机作物较历史时期增加了13.5%,从2017年的140万公顷增加到2021年的160万公顷。该地区的食品成长迅速,2021 年北美人均有机杂货支出为 109.7 美元。
- 欧洲地区将在2022年成为第二大生物肥料消费国,占31.9%。欧洲拥有世界上最大的有机农业面积,截至2021年为650万公顷。欧盟委员会宣布了一项增加成员国有机农业面积的行动计划,以便到2030年有机农业面积将占该地区农业用地的25.0%。预计这一因素将进一步推动该地区的生物肥料市场。
- 亚太地区是稻米、甘蔗、水果和蔬菜等有机作物的主要生产国。儘管中国和印度是新兴的领导者,但有机农业仅占其农业总面积的一小部分。该地区的有机农业面积预计从 2017 年到 2021 年将成长,这一趋势预计将推动生物肥料市场的成长。
- 世界各地(尤其是欧洲和北美地区)有机作物面积的增加和对有机商品需求的增加可能会增加预测期内对生物肥料的需求。
生物肥料产业概况
生物肥料市场较为分散,前五名企业占21.97%。市场的主要企业是(按字母顺序排列)Gujarat State Fertilizers & Chemicals Ltd、Indian Farmers Fertilizer Cooperative Limited、Koppert Biological Systems Inc.、Symborg Inc. 和 T. Stanes and Company Limited。
其他福利
- Excel 格式的市场预测 (ME) 表
- 3 个月分析师支持
目录
第一章执行摘要和主要发现
第二章 检举要约
第三章简介
- 研究假设和市场定义
- 调查范围
- 调查方法
第四章 产业主要趋势
- 有机种植面积
- 人均有机产品支出
- 法律规范
- 价值炼和通路分析
第五章市场区隔
- 型态
- 固氮螺菌
- 固氮菌
- 菌根
- 解磷细菌
- 根瘤菌
- 其他的
- 作物类型
- 经济作物
- 园艺作物
- 中耕作物
- 地区
- 非洲
- 埃及
- 奈及利亚
- 南非
- 其他非洲
- 亚太地区
- 澳洲
- 中国
- 印度
- 印尼
- 日本
- 菲律宾
- 泰国
- 越南
- 其他亚太地区
- 欧洲
- 法国
- 德国
- 义大利
- 荷兰
- 俄罗斯
- 西班牙
- 土耳其
- 英国
- 其他欧洲国家
- 中东
- 按国家/地区
- 伊朗
- 沙乌地阿拉伯
- 其他中东地区
- 北美洲
- 加拿大
- 墨西哥
- 美国
- 北美其他地区
- 南美洲
- 阿根廷
- 巴西
- 南美洲其他地区
- 非洲
第六章 竞争形势
- 重大策略倡议
- 市场占有率分析
- 公司形势
- 公司简介
- Andermatt Group AG
- Atlantica Agricola
- Binzhou Jingyang Biological Fertilizer Co. Ltd
- Biostadt India Limited
- Ficosterra
- Gujarat State Fertilizers &Chemicals Ltd
- Indian Farmers Fertiliser Cooperative Limited
- Indogulf BioAg LLC(Biotech Division of Indogulf Company)
- IPL Biologicals Limited
- Kiwa Bio-Tech
- Koppert Biological Systems Inc.
- Microbial Biological Fertilizers International
- Sustane Natural Fertilizer Inc.
- Symborg Inc.
- T.Stanes and Company Limited
第七章 CEO 面临的关键策略问题
第8章附录
The Biofertilizer Market size is estimated at USD 3.27 billion in 2024, and is expected to reach USD 5.23 billion by 2029, growing at a CAGR of 9.85% during the forecast period (2024-2029).
Key Highlights
- Mycorrhiza is the Largest Form. Mycorrhiza, also referred to as Arbuscular mycorrhizal fungi (AMF), was proven to increase crop yields significantly. It is the most consumed biofertilizer globally.
- Rhizobium is the Fastest-growing Form. Rhizobium is the most important nitrogen-fixing bacterium that exists in a symbiotic relationship with plants and lives in the root nodules of leguminous plants.
- Row Crops is the Largest Crop Type. The major row crops grown around the world include rice, barley, corn, wheat, rapeseed, rye, soybean, etc. and they accounted for 74.6% of biofertilizer consumption in 2022.
- North America is the Largest Region. The area under cultivation of organic crops in the region had increased by 13.5% during the historic period from 1.4 million hectares in 2017 to 1.6 million hectares in 2021.
Biofertilizer Market Trends
Mycorrhiza is the largest Form
- Biofertilizers are living microorganisms that can enhance plant nutrition by either mobilizing or increasing nutrient availability in soils. The most common microorganisms used as biofertilizers in agriculture include mycorrhiza, Azospirillum, Azotobacter, Rhizobium, and phosphate-solubilizing bacteria.
- Among these, mycorrhiza is the most consumed biofertilizer globally. It accounted for 36.3% of the biofertilizer segment in 2022, with a market value of USD 995.3 million and a volume of 96.6 thousand metric tons. Mycorrhiza increases the root surface area of plants, thus enhancing their nutrient uptake.
- Rhizobium is the second most consumed biofertilizer globally. It accounted for 24.8% of the biofertilizer segment in 2022. North America dominated the rhizobium sub-segment with a market share of 52.7% in the same year. Row crops dominated the rhizobium sub-segment in North America, accounting for 62.4% in 2022. Rhizobium has a symbiotic association with leguminous crops, a category of row crops. Thus, row crops dominated the rhizobium sub-segment. North America also has a large cultivation area of row crops. The rhizobium sub-segment in the North American row crops market is anticipated to record a CAGR of 10.5% during the forecast period.
- Azospirillum accounted for 16.8% of the biofertilizer segment. North America dominated the Azospirillum sub-segment, accounting for 46.4% in 2022. The market value increased by about 57.8% during the historic period.
- Thus, the biofertilizer segment of the global agricultural biologicals market is expected to grow in the coming years as more farmers seek sustainable and eco-friendly solutions to improve crop yields and soil health.
North America is the largest Region
- Biofertilizers are living microorganisms that have the ability to enhance plant nutrition by either mobilizing or increasing nutrient availability in soils. North America and Europe are the major consumers of biofertilizers in the world.
- North America accounted for 35.9% of the global biofertilizer market in 2022. The area under cultivation of organic crops in the region increased by 13.5% during the historical period, from 1.4 million hectares in 2017 to 1.6 million hectares in 2021. The demand for organic food in the region is growing rapidly, with an average per capita spending on organic food products in North America at USD 109.7 in 2021.
- The European region accounted for 31.9% in 2022 and stood as the second-largest consumer of biofertilizers. Europe had the largest area under organic farming in the world, with 6.5 million hectares in 2021. The European Commission has unveiled an action plan to increase the organic area in the member countries to occupy 25.0% of the region's agricultural land area by 2030. This factor is further expected to drive the market for biofertilizers in the region.
- The Asia-Pacific region is a leading producer of organic crops such as rice, sugarcane, and fruits and vegetables. China and India are emerging leaders, although organic farming only accounts for a small portion of their total agricultural area. The organic farming area in the region grew from 2017 to 2021, and this trend is expected to drive growth in the biofertilizer market.
- The increasing organic crop area and increasing demand for organic commodities across the world, particularly in regions like Europe and North America, may drive the demand for biofertilizers during the forecast period.
Biofertilizer Industry Overview
The Biofertilizer Market is fragmented, with the top five companies occupying 21.97%. The major players in this market are Gujarat State Fertilizers & Chemicals Ltd, Indian Farmers Fertiliser Cooperative Limited, Koppert Biological Systems Inc., Symborg Inc. and T.Stanes and Company Limited (sorted alphabetically).
Additional Benefits:
- The market estimate (ME) sheet in Excel format
- 3 months of analyst support
TABLE OF CONTENTS
1 EXECUTIVE SUMMARY & KEY FINDINGS
2 REPORT OFFERS
3 INTRODUCTION
- 3.1 Study Assumptions & Market Definition
- 3.2 Scope of the Study
- 3.3 Research Methodology
4 KEY INDUSTRY TRENDS
- 4.1 Area Under Organic Cultivation
- 4.2 Per Capita Spending On Organic Products
- 4.3 Regulatory Framework
- 4.4 Value Chain & Distribution Channel Analysis
5 MARKET SEGMENTATION
- 5.1 Form
- 5.1.1 Azospirillum
- 5.1.2 Azotobacter
- 5.1.3 Mycorrhiza
- 5.1.4 Phosphate Solubilizing Bacteria
- 5.1.5 Rhizobium
- 5.1.6 Other Biofertilizers
- 5.2 Crop Type
- 5.2.1 Cash Crops
- 5.2.2 Horticultural Crops
- 5.2.3 Row Crops
- 5.3 Region
- 5.3.1 Africa
- 5.3.1.1 By Country
- 5.3.1.1.1 Egypt
- 5.3.1.1.2 Nigeria
- 5.3.1.1.3 South Africa
- 5.3.1.1.4 Rest of Africa
- 5.3.2 Asia-Pacific
- 5.3.2.1 By Country
- 5.3.2.1.1 Australia
- 5.3.2.1.2 China
- 5.3.2.1.3 India
- 5.3.2.1.4 Indonesia
- 5.3.2.1.5 Japan
- 5.3.2.1.6 Philippines
- 5.3.2.1.7 Thailand
- 5.3.2.1.8 Vietnam
- 5.3.2.1.9 Rest of Asia-Pacific
- 5.3.3 Europe
- 5.3.3.1 By Country
- 5.3.3.1.1 France
- 5.3.3.1.2 Germany
- 5.3.3.1.3 Italy
- 5.3.3.1.4 Netherlands
- 5.3.3.1.5 Russia
- 5.3.3.1.6 Spain
- 5.3.3.1.7 Turkey
- 5.3.3.1.8 United Kingdom
- 5.3.3.1.9 Rest of Europe
- 5.3.4 Middle East
- 5.3.4.1 By Country
- 5.3.4.1.1 Iran
- 5.3.4.1.2 Saudi Arabia
- 5.3.4.1.3 Rest of Middle East
- 5.3.5 North America
- 5.3.5.1 By Country
- 5.3.5.1.1 Canada
- 5.3.5.1.2 Mexico
- 5.3.5.1.3 United States
- 5.3.5.1.4 Rest of North America
- 5.3.6 South America
- 5.3.6.1 By Country
- 5.3.6.1.1 Argentina
- 5.3.6.1.2 Brazil
- 5.3.6.1.3 Rest of South America
- 5.3.1 Africa
6 COMPETITIVE LANDSCAPE
- 6.1 Key Strategic Moves
- 6.2 Market Share Analysis
- 6.3 Company Landscape
- 6.4 Company Profiles
- 6.4.1 Andermatt Group AG
- 6.4.2 Atlantica Agricola
- 6.4.3 Binzhou Jingyang Biological Fertilizer Co. Ltd
- 6.4.4 Biostadt India Limited
- 6.4.5 Ficosterra
- 6.4.6 Gujarat State Fertilizers & Chemicals Ltd
- 6.4.7 Indian Farmers Fertiliser Cooperative Limited
- 6.4.8 Indogulf BioAg LLC (Biotech Division of Indogulf Company)
- 6.4.9 IPL Biologicals Limited
- 6.4.10 Kiwa Bio-Tech
- 6.4.11 Koppert Biological Systems Inc.
- 6.4.12 Microbial Biological Fertilizers International
- 6.4.13 Sustane Natural Fertilizer Inc.
- 6.4.14 Symborg Inc.
- 6.4.15 T.Stanes and Company Limited
7 KEY STRATEGIC QUESTIONS FOR AGRICULTURAL BIOLOGICALS CEOS
8 APPENDIX
- 8.1 Global Overview
- 8.1.1 Overview
- 8.1.2 Porter's Five Forces Framework
- 8.1.3 Global Value Chain Analysis
- 8.1.4 Market Dynamics (DROs)
- 8.2 Sources & References
- 8.3 List of Tables & Figures
- 8.4 Primary Insights
- 8.5 Data Pack
- 8.6 Glossary of Terms
 固氮菌生物肥料市场:按作物类型、形式和应用分类 - 全球预测 2025-2030
 生物肥料市场:按类型、按微生物类型、按形式、按作物类型、按应用 - 2025-2030 年全球预测
 生物肥料市场规模、份额、趋势分析报告:按产品类型、应用、作物类型、地区和细分市场预测,2025-2030
 印度的生物肥料市场:生物肥料各类型,各作物类型,各用途,各终端用户,各地区,机会,预测,2018年~2032年
 生物肥料市场评估:生物肥料类型·作物类型·用途·终端用户·各地区的机会及预测 (2017-2031年)
 生物肥料市场规模、份额、增长分析、按产品、按微生物、按形式、按应用、按作物类型、按地区 - 行业预测,2024-2031 年
 全球生物肥料市场2024-2028
 全球生物肥料市场研究报告 - 2024 年至 2032 年产业分析、规模、份额、成长、趋势和预测
 全球生物肥料市场:市场规模 - 按产品、应用、作物类型、地区预测,2022-2032 年
 生物肥料市场 - 全球产业规模、份额、趋势、机会和预测,按类型、形式、作物类型、应用、微生物类型、地区和竞争细分,2019-2029F