


 |
市场调查报告书
商品编码
1852173
有机过氧化物:市场份额分析、行业趋势、统计数据和成长预测(2025-2030 年)Organic Peroxide - Market Share Analysis, Industry Trends & Statistics, Growth Forecasts (2025 - 2030) |
||||||
※ 本网页内容可能与最新版本有所差异。详细情况请与我们联繫。
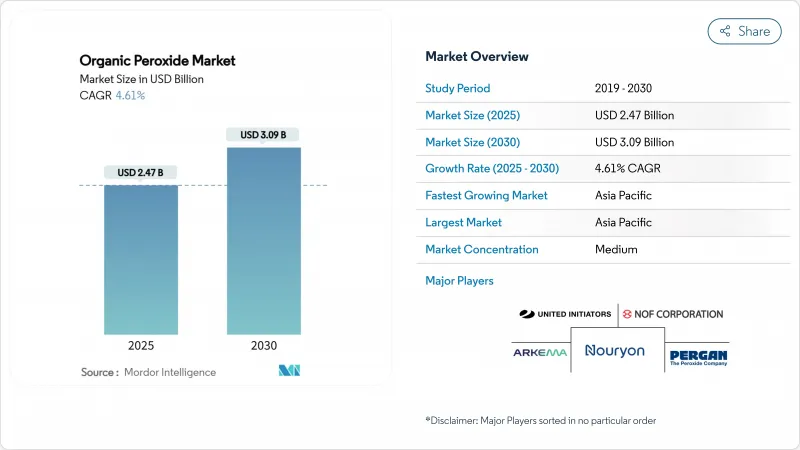
预计有机过氧化物市场规模将在 2025 年达到 24.7 亿美元,到 2030 年达到 30.9 亿美元,在预测期(2025-2030 年)内复合年增长率为 4.61%。
需求成长主要受以下因素驱动:先进聚乙烯和聚丙烯等级产品的使用日益增多、EVA太阳能电池封装的快速普及以及向无VOC粉末涂料系统的转变。生产商正在亚太地区扩大产能,以满足聚合物和复合材料客户严格的规格控制要求,同时,注重安全性的膏状和乳液型涂料也越来越受欢迎。同时,原物料价格波动和仓储设施保险成本上涨持续挤压净利率,促使製造商转向可再生原料和更安全的处理方案。亚太地区是销售量和需求成长的主要驱动力,而北美和欧洲的永续性法规正在加速产品替代。
全球有机过氧化物市场趋势与洞察
转向使用更高阶的PE和PP牌号
亚太地区对流变控制聚丙烯和高熔点聚丙烯(PP)的需求不断增长,推动了包装和汽车零件产业对有机过氧化物的消费。利安德巴塞尔的目标是到2024年将其再生和可再生聚合物的产量提高65%,达到20万吨以上,到2030年达到每年200万吨,这促使人们需要使用有机过氧化物来精细调节分子量和支化度。加工商报告称,使用过氧化二异丙苯作为断炼剂可使PP的加工效率提高18%,而使用Perkadox和Trigonox®牌号的支化PP则可使其发泡性能提高30%。随着区域树脂生产商不断拓展其专业化能力,有机过氧化物市场的需求基础正在稳定成长。
有机过氧化物在EVA太阳能电池封装的应用
快速发展的太阳能发电产业正在使用过氧化物交联的EVA封装片材(例如Luperox TBEC)来提高凝胶含量至75%以上,从而增强组件的耐久性。中国是EVA片材的主要生产国,欧洲组件製造商也正在升级到高纯度过氧化物系统以降低功率损耗。这些趋势将在短期内推动有机过氧化物市场销售稳定成长,尤其是对于具有窄分解曲线的高压聚合级产品而言。
仓储设施保险费
修订后的ADR框架将于2025年1月1日生效,届时有机过氧化物仓库的分类和检查将更加严格。欧洲保险公司正在提高大型仓库的保费,增加营运成本,并推迟扩建计划。生产商则透过优化存量基准和投资建设小型卫星仓库来应对,但不断上涨的固定成本正在限制有机过氧化物市场的利润成长。
细分市场分析
预计到2024年,过氧化苯甲酰将占有机过氧化物市场收入的24%。自由基聚合仍然是苯乙烯类和丙烯酸类化合物的高通量聚合方法,工业级产品占据销售量主导地位。然而,人们越来越关注某些消费品中苯的污染问题,促使产品配方进行调整。
过碳酸盐是一种环境友善清洁剂,应用广泛,是成长最快的细分市场,复合年增长率达4.74%。基于过碳酸盐的高阶氧化製程在污水净化领域的商业化应用,将拓宽客户群,并协助未来市场份额的扩张。
2024年,聚合反应起始剂占有机过氧化物市场的65%,预计到2030年将以5.22%的复合年增长率成长。由于叔丁基过氧-2-乙基己酸酯等特性明确的引髮剂具有可预测的分解速率,因此高通量LDPE和PP生产设施更倾向于使用此类引髮剂。交联剂是第二大类,广泛应用于电线电缆护套、发泡隔热材料以及需要在高温下保持尺寸稳定性的复合材料零件。固化剂和硬化剂虽然用量较小,但在用于3D列印和高压RTM复合材料的先进树脂化学领域中,其重要性日益凸显。
区域分析
到 2024 年,亚太地区将占有机过氧化物市场的 39%,复合年增长率为 4.89%。中国是该地区的主要需求国,诺力昂公司计划于 2024 年 11 月在宁波扩建工厂,将其 Perkadox 14 和 Trigonox 101 的产量翻一番,达到 6,000 吨,凸显了中国市场对可控流变改质剂的需求。
北美地区汽车复合材料、医疗保健、高纯度半导体聚合物等领域的需求成熟且具有附加价值。製造商们正致力于研发更安全的配方,一些製造商推出了符合运输部关于过氧化物散装运输严格规定的乳液型引发剂。
欧洲紧随其后,其主要驱动力是限制挥发性有机化合物(VOC)排放和强制执行更安全的危险品运输的环保法规。将于2025年生效的澳洲危险品运输法规(ADR)更新版将提出更严格的储存隔离和培训要求,这将增加营业成本,但同时也将鼓励采用糊状和聚合物黏合型危险品。
其他福利:
- Excel格式的市场预测(ME)表
- 3个月的分析师支持
目录
第一章 引言
- 研究假设和市场定义
- 调查范围
第二章调查方法
第三章执行摘要
第四章 市场情势
- 市场概览
- 市场驱动因素
- 亚太地区对聚合物的需求转向先进的PE和PP等级
- 有机过氧化物的快速扩散
- 欧洲无VOC紫外光固化粉末涂料的成长
- 汽车轻量化,纤维增强复合材料的广泛应用
- 涂料应用领域的使用量迅速成长
- 市场限制
- 欧盟大型仓储设施的保险费很高
- 原料供应紧张
- 有机过氧化物成本上涨
- 价值链分析
- 波特五力模型
- 供应商的议价能力
- 买方/消费者的议价能力
- 新进入者的威胁
- 替代产品和服务的威胁
- 竞争程度
第五章 市场规模与成长预测
- 按类型
- 二酰基过氧化物
- 二烷基过氧化物
- 过氧化酮
- 过氧化氢
- 过碳酸盐
- 过氧化苯甲酰
- 过氧酯
- 其他的
- 按功能
- 聚合反应起始剂
- 交联剂
- 硬化剂
- 按形式
- 液体
- 固体的
- 膏状/乳液
- 透过使用
- 聚合物和橡胶
- 涂料和黏合剂
- 纸张和纺织品
- 化妆品
- 卫生保健
- 其他用途
- 按地区
- 亚太地区
- 中国
- 印度
- 日本
- 韩国
- ASEAN
- 亚太其他地区
- 北美洲
- 美国
- 加拿大
- 墨西哥
- 欧洲
- 德国
- 英国
- 法国
- 义大利
- 西班牙
- 北欧国家
- 其他欧洲地区
- 南美洲
- 巴西
- 阿根廷
- 其他南美洲国家
- 中东和非洲
- 沙乌地阿拉伯
- 南非
- 其他中东和非洲地区
- 亚太地区
第六章 竞争情势
- 市场集中度
- 策略性倡议(併购、合资、产能扩张)
- 市占率(%)/排名分析
- 公司简介
- ADEKA CORPORATION
- AKPA Kimya
- Arkema
- BASF
- Dow
- Evonik Industries AG
- Hanwha Group
- Jiangsu qiangsheng chemical co. LTD
- Kawaguchi Chemical Industry Co., LTD.
- Lianyungang Hualun Chemical Co.,Ltd.
- MITSUBISHI GAS CHEMICAL COMPANY, INC.
- MPI Chemie BV
- NOF CORPORATION
- Nouryon
- Novichem Sp. z oo
- PERGAN GmbH
- Plasti Pigments Pvt. Ltd.
- Shenzhen Bailingwei Technology Co., Ltd.
- Solvay
- United Chemicals
- United Initiators GmbH
第七章 市场机会与未来展望
The Organic Peroxide Market size is estimated at USD 2.47 billion in 2025, and is expected to reach USD 3.09 billion by 2030, at a CAGR of 4.61% during the forecast period (2025-2030).
The rising use of advanced polyethylene and polypropylene grades, rapid uptake of EVA solar encapsulants, and the shift toward VOC-free powder coating systems underpin demand growth. Producers are scaling capacity in Asia Pacific to serve polymer and composites customers that require tight specification control, while safety-focused paste and emulsion formats gain wider acceptance. At the same time, volatile feedstock pricing and higher insurance premiums for storage facilities continue to pressure margins, steering manufacturers toward renewable feedstocks and safer handling solutions. Asia Pacific anchors both volume and incremental demand, followed by steady but more specialized growth in North America and Europe, where sustainability regulations accelerate product substitution.
Global Organic Peroxide Market Trends and Insights
Shift Toward Advanced PE and PP Grades
Rising requirements for controlled rheology polypropylene and high-melt-strength PP in packaging and automotive parts lift organic peroxide consumption across Asia Pacific. LyondellBasell raised recycled and renewable-based polymer output by 65% in 2024 to more than 200,000 t, with a target of 2 million t annually by 2030, increasing the need for organic peroxides that fine-tune molecular weight and branching. Processors report an 18% jump in PP processing efficiency when dicumyl peroxide is applied as a chain breaker, while branched PP made with Perkadox and Trigonox(R) grades delivers 30% better foam properties. As regional resin producers expand specialty capacity, the organic peroxide market gains a stable demand base.
Adoption of Organic Peroxides in EVA Solar Encapsulants
Fast-growing photovoltaic installations rely on EVA encapsulation sheets cross-linked with peroxides such as Luperox TBEC to reach gel contents above 75%, thereby enhancing module durability. China dominates EVA sheet output, and European module makers are also upgrading to higher-purity peroxide systems to curb power loss. These trends translate into steady incremental volumes for the organic peroxide market in the near term, especially for high-pressure polymerization grades that offer narrow decomposition profiles.
Insurance Premiums for Storage Facilities
Implementation of the revised ADR framework on 1 January 2025 elevates classification and inspection rigor for organic peroxide warehousing. European underwriters have lifted premiums for large-volume sites, raising operating costs and delaying expansion projects. Producers are responding by optimizing inventory levels and investing in smaller satellite depots, yet higher fixed costs constrain margin expansion for the organic peroxide market.
Other drivers and restraints analyzed in the detailed report include:
- Growth of VOC-Free Powder Coatings in Europe
- Automotive Lightweighting Drives Composite Applications
- Feedstock Supply Tightness
For complete list of drivers and restraints, kindly check the Table Of Contents.
Segment Analysis
Benzoyl peroxide retained a 24% revenue share of the organic peroxide market in 2024, reflecting its dual usage in polymer initiation and topical dermatology. Industrial grade volumes dominate because free-radical polymerization remains a high-throughput route for styrenics and acrylics. Nevertheless, concerns over benzene contamination in certain consumer products have raised scrutiny, spurring product reformulation.
Percarbonates, propelled by eco-friendly credentials and broad cleaning-agent appeal, are the fastest-growing sub-segment at a 4.74% CAGR. Commercialization of percarbonate-based advanced oxidation processes for wastewater remediation broadens the customer mix and supports future share gains.
Polymerization initiators captured 65% of the organic peroxide market share in 2024 and are forecast to post a 5.22% CAGR to 2030. High throughput LDPE and PP facilities favor well-characterized initiators such as tert-butyl peroxy-2-ethylhexanoate owing to predictable decomposition kinetics. Cross-linking agents are the next-largest category, used in wire-and-cable jacketing, foam insulation, and composite parts that need dimensional stability at elevated temperatures. Curing and hardening agents, though smaller in volume, gain importance in advanced resin chemistries for 3D printing and high-pressure RTM composites.
The Organic Peroxide Market Report Segments the Industry by Type (Diacyl Peroxides, Dialkyl Peroxides, Ketone Peroxides, and More), Function (Polymerization Initiators, and More), Form (Liquid, Solid, and Paste/Emulsion), Application (Polymers and Rubber, Coatings and Adhesives, Paper and Textile, Cosmetics, and More), and Geography (Asia-Pacific, North America, Europe, South America, and Middle-East and Africa).
Geography Analysis
Asia Pacific held 39% of the organic peroxide market in 2024 and is growing at a 4.89% CAGR, supported by robust downstream plastics and elastomer capacity additions. China dominates regional demand, and Nouryon's November 2024 expansion in Ningbo doubled the output of Perkadox 14 and Trigonox 101 to 6,000 tons, underscoring local appetite for controlled rheology modifiers.
North America is characterized by mature but value-added demand in automotive composites, healthcare, and high-purity semiconductor polymers. Producers emphasize safer formulations, and several have introduced emulsion-based initiators that align with stricter Department of Transportation guidelines on bulk peroxide transport.
Europe trails closely, with growth driven by environmental legislation that restricts VOC emissions and mandates safer carriage of dangerous goods. The ADR update, effective in 2025, imposes tighter storage segregation and training requirements, increasing operating costs but encouraging the adoption of paste and polymer-bound forms.
- ADEKA CORPORATION
- AKPA Kimya
- Arkema
- BASF
- Dow
- Evonik Industries AG
- Hanwha Group
- Jiangsu qiangsheng chemical co. LTD
- Kawaguchi Chemical Industry Co., LTD.
- Lianyungang Hualun Chemical Co.,Ltd.
- MITSUBISHI GAS CHEMICAL COMPANY, INC.
- MPI Chemie BV
- NOF CORPORATION
- Nouryon
- Novichem Sp. z o.o.
- PERGAN GmbH
- Plasti Pigments Pvt. Ltd.
- Shenzhen Bailingwei Technology Co., Ltd.
- Solvay
- United Chemicals
- United Initiators GmbH
Additional Benefits:
- The market estimate (ME) sheet in Excel format
- 3 months of analyst support
TABLE OF CONTENTS
1 Introduction
- 1.1 Study Assumptions and Market Definition
- 1.2 Scope of the Study
2 Research Methodology
3 Executive Summary
4 Market Landscape
- 4.1 Market Overview
- 4.2 Market Drivers
- 4.2.1 Polymer Demand Shift toward Advanced PE and PP Grades in Asia-Pacific
- 4.2.2 Rapid Adoption of Organic Peroxide
- 4.2.3 Growth of VOC-free, UV-curable Powder Coatings in Europe
- 4.2.4 Automotive Lightweighting, Elevated Use in Fiber-Reinforced Composites
- 4.2.5 Surging Utilization in Coating Applications
- 4.3 Market Restraints
- 4.3.1 High Insurance Premiums for Large-Scale Storage Facilities in EU
- 4.3.2 Supply Tightness of Feedstock
- 4.3.3 Rising Cost of Organic Peroxide
- 4.4 Value Chain Analysis
- 4.5 Porter's Five Forces
- 4.5.1 Bargaining Power of Suppliers
- 4.5.2 Bargaining Power of Buyers/Consumers
- 4.5.3 Threat of New Entrants
- 4.5.4 Threat of Substitute Products and Services
- 4.5.5 Degree of Competition
5 Market Size and Growth Forecasts (Value)
- 5.1 By Type
- 5.1.1 Diacyl Peroxides
- 5.1.2 Dialkyl Peroxides
- 5.1.3 Ketone Peroxides
- 5.1.4 Hydro-Peroxides
- 5.1.5 Percarbonates
- 5.1.6 Benzoyl Peroxide
- 5.1.7 Peroxyesters
- 5.1.8 Others
- 5.2 By Function
- 5.2.1 Polymerization Initiators
- 5.2.2 Cross-Linking Agents
- 5.2.3 Curing/Hardening Agents
- 5.3 By Form
- 5.3.1 Liquid
- 5.3.2 Solid
- 5.3.3 Paste/Emulsion
- 5.4 By Application
- 5.4.1 Polymers and Rubber
- 5.4.2 Coatings and Adhesives
- 5.4.3 Paper and Textiles
- 5.4.4 Cosmetics
- 5.4.5 Healthcare
- 5.4.6 Other Application
- 5.5 By Geography
- 5.5.1 Asia-Pacific
- 5.5.1.1 China
- 5.5.1.2 India
- 5.5.1.3 Japan
- 5.5.1.4 South Korea
- 5.5.1.5 ASEAN
- 5.5.1.6 Rest of Asia-Pacific
- 5.5.2 North America
- 5.5.2.1 United States
- 5.5.2.2 Canada
- 5.5.2.3 Mexico
- 5.5.3 Europe
- 5.5.3.1 Germany
- 5.5.3.2 United Kingdom
- 5.5.3.3 France
- 5.5.3.4 Italy
- 5.5.3.5 Spain
- 5.5.3.6 Nordics
- 5.5.3.7 Rest of Europe
- 5.5.4 South America
- 5.5.4.1 Brazil
- 5.5.4.2 Argentina
- 5.5.4.3 Rest of South America
- 5.5.5 Middle-East and Africa
- 5.5.5.1 Saudi Arabia
- 5.5.5.2 South Africa
- 5.5.5.3 Rest of Middle-East and Africa
- 5.5.1 Asia-Pacific
6 Competitive Landscape
- 6.1 Market Concentration
- 6.2 Strategic Moves (Mergers and Acquisitions, JVs, Capacity Expansions)
- 6.3 Market Share(%)/ Ranking Analysis
- 6.4 Company Profiles {(includes Global level Overview, Market level overview, Core Segments, Financials as available, Strategic Information, Market Rank/Share for key companies, Products and Services, and Recent Developments)}
- 6.4.1 ADEKA CORPORATION
- 6.4.2 AKPA Kimya
- 6.4.3 Arkema
- 6.4.4 BASF
- 6.4.5 Dow
- 6.4.6 Evonik Industries AG
- 6.4.7 Hanwha Group
- 6.4.8 Jiangsu qiangsheng chemical co. LTD
- 6.4.9 Kawaguchi Chemical Industry Co., LTD.
- 6.4.10 Lianyungang Hualun Chemical Co.,Ltd.
- 6.4.11 MITSUBISHI GAS CHEMICAL COMPANY, INC.
- 6.4.12 MPI Chemie BV
- 6.4.13 NOF CORPORATION
- 6.4.14 Nouryon
- 6.4.15 Novichem Sp. z o.o.
- 6.4.16 PERGAN GmbH
- 6.4.17 Plasti Pigments Pvt. Ltd.
- 6.4.18 Shenzhen Bailingwei Technology Co., Ltd.
- 6.4.19 Solvay
- 6.4.20 United Chemicals
- 6.4.21 United Initiators GmbH
7 Market Opportunities and Future Outlook
- 7.1 White-space and Unmet-Need Assessment
- 7.2 Growing Demand for Light-Weight Materials


