


 |
市场调查报告书
商品编码
1641894
工业级尿素-市场占有率分析、产业趋势与统计、成长预测(2025-2030 年)Industrial Grade Urea - Market Share Analysis, Industry Trends & Statistics, Growth Forecasts (2025 - 2030) |
||||||
※ 本网页内容可能与最新版本有所差异。详细情况请与我们联繫。
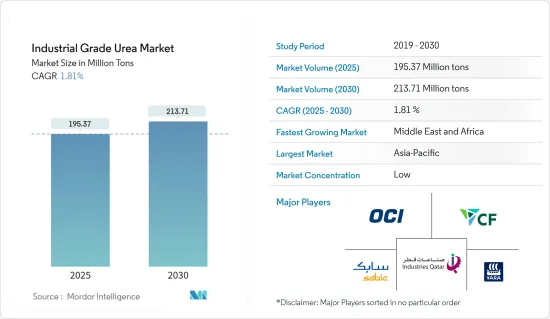
预计2025年工业级尿素市场规模为1.9537亿吨,至2030年预计将达到2.1371亿吨,预测期内(2025-2030年)的复合年增长率为1.81%。
考虑到 COVID-19 疫情情势,一些国家被迫封锁,导致人们尽量减少使用私家车。此外,汽车製造厂的暂时关闭导致尿素基催化剂的消费量下降。然而,2021年市场復苏了。预计未来几年将出现显着成长。
关键亮点
- 短期内,技术级尿素的高适用性、汽车产业需求的增加以及肥料领域使用量的增加预计将推动市场成长。
- 重点地区尿素的滥用和价格波动可能会阻碍市场的成长。
- 工业级尿素在绿建筑的使用很可能在未来几年为市场创造机会。
- 预计亚太地区将主导市场。然而,中东和非洲可能在预测期内呈现最高的复合年增长率。
尿素市场趋势
农业领域占市场主导地位
- 尿素(NH2)2CO 是一种无色有机化合物,称为碳酰胺。它在水中溶解度极高,pKa 接近零。全球90%以上的尿素产量被用作氮释放肥料。在所有常用的固态氮肥中,尿素的氮含量最高(46.7%)。因此单位氮营养素的运输成本最低。
- 在土壤中,它会水解成氨和二氧化碳。细菌将土壤中的氨氧化为硝酸盐,可以被植物吸收。尿素也用于许多多组分固态肥料中。尿素在水中的溶解度很高,因此非常适合用作肥料溶液(与硝酸铵:UAN结合),例如作为「叶面」肥料。作为肥料,颗粒是首选,因为它们具有窄的粒径分布并且有利于机械施用。
- 氮肥是提高作物产量和收益的有效途径,特别是在干旱和湿润地区。氮肥专门用作作物补充剂,主要用于农业收割。
- 根据世界银行预测,2021年全球农林渔业总产值将达4.17兆美元,高于去年的3.72兆美元。
- 亚太地区目前高度依赖氮肥。然而,氮肥的使用、营养管理不善、土壤肥力下降、缺乏补充投入以及行销和分销系统薄弱是亚太地区农业部门令人担忧的一些问题。未来几年,氮肥需求可能主导该地区的化肥市场,并将继续推动尿素市场的消费。
- 此外,农业是世界各地主要的生计来源。农业部门正在迅速成长,尤其是在印度和美国等国家。因此,预计预测期内对氨的需求将推动市场发展。
- 针对22财年,印度政府为农民设定了创纪录的目标,即把粮食产量提高2%至3.0731亿吨。 21 财年的产量为 3.0334 亿吨,而目标为 3.01 亿吨。因此,这些因素预计将增加对肥料的需求并推动市场研究。
- 此外,2021年美国农业年度出口量创下了历史新高。根据美国商务部发布的2021年贸易资料,美国对全球农产品和食品出口总额达1,770亿美元,比2020年总额高出18%。
- 近年来,拉丁美洲和加勒比地区的农业部门经历了显着的成长。根据经济合作暨发展组织(OECD)和联合国粮食及农业组织(FAO)的预测,预测期内农业和渔业产量预计将增加 17%。预计其中约 53% 的成长将来自于作物产量的成长。
亚太地区占市场主导地位
- 亚太地区占据最大的市场占有率,其次是北美。
- 人口成长推动了印度和中国等国家的农业发展。这增加了氮肥的消耗并推动了市场发展。
- 除农业外,由于化学、汽车和医疗行业的发展,消费量也在增加。
- 在电价上涨和对粮食生产的担忧日益加剧的背景下,中国政府部门对化肥出口商施加了新的障碍,并有可能加剧全球价格衝击和食品通膨。
- 中国是全世界最大的脲醛树脂生产国。脲醛树脂在建筑中用作黏合剂,黏合胶合板、塑合板和其他木製品。
- 根据国家统计局预测,2021年粮食产量预计为6.829亿吨,比去年的6.5亿吨增加2%。玉米种植面积比去年增加5%,产量增加4.6%。为了应对耕地面积的下降,用于提高生产率的肥料使用量正在增加,预计这将推动该国的市场发展。
- 2022年7-9月中国尿素出口量为84.9万吨,高于2022年第一季的30.3万吨及第二季的42.1万吨。
- 中国是全球最重要的汽车生产基地,根据OICA统计,2021年汽车总产量达2,608万辆,较去年的2,523万辆成长3%。
- 2021年,印度4-7月零售化肥销量较去年同期下降12.4%。所有常量营养素的销量均下降,其中尿素降幅最高,为 12.8%。
- 根据印度肥料协会的数据,2020-21 年所有肥料产品的产量为 4,349 万吨,比 2019-20 年增加 1.7%。 2020-21年尿素产量为2460万吨,NP/NPK复合肥产量为932万吨,SSP产量为492万吨,分别比2019-20年增长0.6%、7.6%和15.8%。然而,DAP产量为377万吨,同期大幅下降了17.1%。
- 此外,印度是世界上最大的汽车生产国之一。根据OICA统计,2021年该国汽车产量从去年同期的338万辆成长30%至440万辆。
工业级尿素产业概况
工业级尿素市场细分,该产业参与企业众多,但全球生产能力份额较小。市场的主要参与企业包括 Industries Qatar、SABIC、OCI NV、Yara、CF Industries Holdings Inc. 等。
其他福利
- Excel 格式的市场预测 (ME) 表
- 3 个月的分析师支持
目录
第 1 章 简介
- 调查前提条件
- 研究范围
第二章调查方法
第三章执行摘要
第四章 市场动态
- 驱动程式
- 工业级尿素适用性高
- 汽车产业需求增加
- 扩大肥料领域的应用
- 限制因素
- 重点区域滥用尿素
- 价格波动
- 产业价值链分析
- 波特五力分析
- 供应商的议价能力
- 消费者议价能力
- 新进入者的威胁
- 替代品的威胁
- 竞争程度
- 原料分析
- 技术简介
- 生产流程
- 专利分析
- 进出口趋势
- 监理政策分析
第五章 市场区隔(市场规模:数量)
- 年级
- 肥料
- 餵食
- 科技
- 最终用户产业
- 农业
- 化学
- 车
- 医疗
- 其他的
- 地区
- 亚太地区
- 中国
- 印度
- 日本
- 韩国
- 东南亚国协
- 其他亚太地区
- 北美洲
- 美国
- 加拿大
- 墨西哥
- 欧洲
- 德国
- 法国
- 英国
- 义大利
- 欧洲其他地区
- 南美洲
- 巴西
- 阿根廷
- 南美洲其他地区
- 中东和非洲
- 沙乌地阿拉伯
- 南非
- 其他中东和非洲地区
- 亚太地区
第六章 竞争格局
- 合併、收购、合资、合作和协议
- 市场占有率(%)分析
- 主要企业策略
- 公司简介
- Acron
- BASF SE
- CF Industries Holdings Inc.
- China National Petroleum Corporation
- Chambal Fertilisers & Chemicals Ltd
- EuroChem Group
- IFFCO
- Industries Qatar
- Koch Fertilizer LLC
- Notore Chemical Industries PLC
- Nutrien Ltd
- OCI
- Paradeep Phosphates Ltd
- Petrobras
- PT Pupuk Kalimantan Timur(PKT)
- SABIC
- The Chemical Company
- URALCHEM JSC
- Yara
- NATIONAL FERTILIZERS LIMITED
第七章 市场机会与未来趋势
- 工业级尿素在环保建筑的应用
The Industrial Grade Urea Market size is estimated at 195.37 million tons in 2025, and is expected to reach 213.71 million tons by 2030, at a CAGR of 1.81% during the forecast period (2025-2030).
Considering the COVID-19 pandemic situation, several countries were forced to go into lockdown, which led people to minimize the usage of personal vehicles. Additionally, automotive manufacturing plants were on a temporary halt, thus leading to a decline in the consumption of urea-based catalysts. However, the market recovered in 2021. It is expected to grow at a significant rate during the coming years.
Key Highlights
- Over the short term, the high applicability of technical grade urea, increasing demand from the automotive sector, and increasing usage in the fertilizer segment are expected to drive market growth.
- The indiscriminate use of urea in critical regions and fluctuation in prices are likely to hinder the market growth.
- The use of industrial grade urea in eco-friendly construction is likely to create opportunities for the market in the coming years.
- The Asia-Pacific region is expected to dominate the market. However, the Middle East and Africa is likely to witness the highest CAGR during the forecast period.
Urea Market Trends
Agriculture Segment to Dominate the Market
- Urea (NH2)2CO is a colorless organic chemical compound known as carbamide. It is highly soluble in water and has a pKa close to zero. More than 90% of the world's urea production is used as a nitrogen-release fertilizer. Urea has the highest nitrogen content of all solid nitrogenous fertilizers in common use (46.7%). Therefore, it has the lowest transportation costs per unit of nitrogen nutrients.
- In the soil, it hydrolyses back to ammonia and carbon dioxide. Bacteria oxidize the ammonia in the soil to nitrate, which the plants can absorb. Urea is also used in many multi-component solid fertilizer formulations. Urea is highly soluble in water, therefore, very suitable for use in fertilizer solutions (in combination with ammonium nitrate: UAN), e.g., in 'foliar feed' fertilizers. For fertilizer use, granules are preferred because of their narrower particle size distribution, an advantage for mechanical application.
- Nitrogen fertilizers are viable methods for expanding crop yield and profitability, particularly in the non-chernozem zone and moist areas. Nitrogen fertilizers are specially used as supplements for crops and are primarily utilized in the agriculture industry for harvesting.
- According to the World Bank, the total value of the agriculture, forestry, and fishing industries accounted for USD 4.17 trillion in 2021, compared to USD 3.72 trillion in the previous year.
- The Asia-Pacific region holds heavy reliance on nitrogenous fertilizers at present. However, the use of nitrogenous fertilizers, poor nutrition management, declining soil fertility, lack of complementary inputs, and weak marketing and distribution systems are some of the concerns in the Asia-Pacific agriculture sector. Regardless, the demand for nitrogenous fertilizer is still likely to dominate the fertilizer market in the region over the next few years, which is likely to continue driving the consumption of the urea market.
- Furthermore, agriculture is the primary source of livelihood across the globe. Countries such as India and the United States, among others, are witnessing positive growth in the agriculture sector. Hence, the demand for ammonia is expected to drive the market during the forecast period.
- For FY22, the Indian government has set a record target for farmers to raise food grain production by 2%, with 307.31 million tons of food grains. In FY21, production was recorded at 303.34 million tons against a target of 301 million tons. Thus, these factors are expected to increase the demand for fertilizers, driving the market studied.
- In addition, the American agricultural industry witnessed the highest annual export levels ever recorded in 2021. The 2021 trade data published by the Department of Commerce shows that exports of US farm and food products to the world totaled USD 177 billion, topping the 2020 total by 18%, driven by higher prices and larger quantities as global demand strengthens.
- The agriculture sector in Latin America and the Caribbean witnessed significant growth in the recent past. According to the Organization for Economic Co-operation and Development (OECD) and the Food and Agriculture Organization of the United Nations (FAO), agricultural and fisheries production is expected to grow by 17% during the forecast period. Around 53% of this growth is expected to come from an increase in crop production.
Asia-Pacific Region to Dominate the Market
- The Asia-Pacific region accounts for the highest market share, followed by North America.
- With the increase in population, developments in the agriculture industries are taking place in countries like India and China. This increases the consumption of nitrogen fertilizers, thereby driving the market.
- Apart from the agriculture industry, consumption is also increasing with the advancements in the chemical, automobile, and medical industries.
- Chinese authorities are imposing new hurdles for fertilizer exporters among growing concerns over surging power prices and food production, which could worsen a global price shock and food inflation.
- China is one of the largest producers of urea-formaldehyde resin in the world. The urea-formaldehyde resins are used in construction as adhesives for bonding plywood, particleboard, and other wood products.
- According to the National Bureau of Statistics, in 2021, grain production totaled 682.9 million tons, up from 650 million tons last year, registering an increase of 2%. Corn acreage rose 5 percent from last year, and output rose 4.6 percent. The growing use of fertilizers to increase productivity to keep up with the declining cultivated area is expected to drive the market in the country.
- China exported 849,000 tons of urea from July 2022 to September 2022, up from 303,000 tons and 421,000 tons during Q1 2022 and Q2 2022, respectively.
- According to the OICA, China has the world's most significant automotive production base, with a total vehicle production of 26.08 million units in 2021, registering an increase of 3% compared to 25.23 million units produced last year.
- In 2021, retail sales of fertilizers in India had fallen 12.4% in April-July over the four months of last year. All major nutrients have posted lower sales, and urea observed the highest decline of 12.8%.
- According to the Fertilizer Association of India, the production of total fertilizer products stood at 43.49 million MT during 2020-21, showing an increase of 1.7% over 2019-20. The production of urea stood at 24.60 million MT, NP/ NPK complex fertilizers at 9.32 million MT, and SSP at 4.92 million MT during 2020-21, recording an increase of 0.6%, 7.6%, and 15.8%, respectively, over 2019-20. However, production of DAP at 3.77 million MT witnessed a sharp decline of 17.1% during the same period.
- Furthermore, India is among the largest producer of automobiles in the world. According to OICA, the automotive production in the country stood at 4.4 million units in 2021, registering an increase of 30% compared to 3.38 million units produced in the same period last year.
Urea Industry Overview
The industrial grade urea market is fragmented, where many players, holding a small share in the global production capacity, have been operating in the industry. Some of the major players in the market include Industries Qatar, SABIC, OCI NV, Yara, and CF Industries Holdings Inc., among others.
Additional Benefits:
- The market estimate (ME) sheet in Excel format
- 3 months of analyst support
TABLE OF CONTENTS
1 INTRODUCTION
- 1.1 Study Assumptions
- 1.2 Scope of the Study
2 RESEARCH METHODOLOGY
3 EXECUTIVE SUMMARY
4 MARKET DYNAMICS
- 4.1 Drivers
- 4.1.1 High Applicability of Technical Grade Urea
- 4.1.2 Increasing Demand from the Automotive Sector
- 4.1.3 Increasing Usage in the Fertilizers Segment
- 4.2 Restraints
- 4.2.1 Indiscriminate Use of Urea in Key Regions
- 4.2.2 Fluctuation in the Prices
- 4.3 Industry Value Chain Analysis
- 4.4 Porter's Five Forces Analysis
- 4.4.1 Bargaining Power of Suppliers
- 4.4.2 Bargaining Power of Consumers
- 4.4.3 Threat of New Entrants
- 4.4.4 Threat of Substitute Products and Services
- 4.4.5 Degree of Competition
- 4.5 Feedstock Analysis
- 4.6 Technological Snapshot
- 4.6.1 Production Process
- 4.6.2 Patent Analysis
- 4.7 Import-Export Trends
- 4.8 Regulatory Policy Analysis
5 MARKET SEGMENTATION (Market Size in Volume)
- 5.1 Grade
- 5.1.1 Fertilizer
- 5.1.2 Feed
- 5.1.3 Technical
- 5.2 End-user Industry
- 5.2.1 Agriculture
- 5.2.2 Chemical
- 5.2.3 Automotive
- 5.2.4 Medical
- 5.2.5 Other End-user Industries
- 5.3 Geography
- 5.3.1 Asia-Pacific
- 5.3.1.1 China
- 5.3.1.2 India
- 5.3.1.3 Japan
- 5.3.1.4 South Korea
- 5.3.1.5 ASEAN Countries
- 5.3.1.6 Rest of Asia-Pacific
- 5.3.2 North America
- 5.3.2.1 United States
- 5.3.2.2 Canada
- 5.3.2.3 Mexico
- 5.3.3 Europe
- 5.3.3.1 Germany
- 5.3.3.2 France
- 5.3.3.3 United Kingdom
- 5.3.3.4 Italy
- 5.3.3.5 Rest of Europe
- 5.3.4 South America
- 5.3.4.1 Brazil
- 5.3.4.2 Argentina
- 5.3.4.3 Rest of South America
- 5.3.5 Middle-East and Africa
- 5.3.5.1 Saudi Arabia
- 5.3.5.2 South Africa
- 5.3.5.3 Rest of Middle-East and Africa
- 5.3.1 Asia-Pacific
6 COMPETITIVE LANDSCAPE
- 6.1 Mergers, Acquisitions, Joint Ventures, Collaborations, and Agreements
- 6.2 Market Share (%) Analysis
- 6.3 Strategies Adopted by Leading Players
- 6.4 Company Profiles
- 6.4.1 Acron
- 6.4.2 BASF SE
- 6.4.3 CF Industries Holdings Inc.
- 6.4.4 China National Petroleum Corporation
- 6.4.5 Chambal Fertilisers & Chemicals Ltd
- 6.4.6 EuroChem Group
- 6.4.7 IFFCO
- 6.4.8 Industries Qatar
- 6.4.9 Koch Fertilizer LLC
- 6.4.10 Notore Chemical Industries PLC
- 6.4.11 Nutrien Ltd
- 6.4.12 OCI
- 6.4.13 Paradeep Phosphates Ltd
- 6.4.14 Petrobras
- 6.4.15 PT Pupuk Kalimantan Timur (PKT)
- 6.4.16 SABIC
- 6.4.17 The Chemical Company
- 6.4.18 URALCHEM JSC
- 6.4.19 Yara
- 6.4.20 NATIONAL FERTILIZERS LIMITED
7 MARKET OPPORTUNITIES AND FUTURE TRENDS
- 7.1 Use of Industrial Grade Urea in Eco-friendly Construction
 尿素市场规模、份额和成长分析(按等级、类型、应用、地区):产业预测(2024-2031)
 尿素市场:依等级、形式、通路、应用分类 - 2025-2030 年全球预测
 包膜尿素市场报告:2030 年趋势、预测与竞争分析
 全球尿素市场评估:依等级、形式、应用、地区、机会、预测(2017-2031)
 全球尿素市场:按等级、按应用、按最终用途行业、按产品类型、按技术、按技术、按地区 - 预测至 2029 年
 尿素市场:全球产业分析、规模、占有率、成长、趋势、预测,2024-2033
 2024-2032 年按等级、应用、最终用途产业和地区分類的尿素市场报告
 农用尿素市场报告:2030 年趋势、预测与竞争分析
 颗粒尿素市场报告:2030 年趋势、预测与竞争分析
 全球尿素生产能力和设备投资预测:2024年~2030年