


 |
市场调查报告书
商品编码
1850346
欺敌技术:市场份额分析、行业趋势、统计数据和成长预测(2025-2030 年)Deception Technology - Market Share Analysis, Industry Trends & Statistics, Growth Forecasts (2025 - 2030) |
||||||
※ 本网页内容可能与最新版本有所差异。详细情况请与我们联繫。
预计到 2025 年,欺敌技术市场规模将累计24.1 亿美元,到 2030 年将扩大到 45 亿美元,复合年增长率为 13.3%。
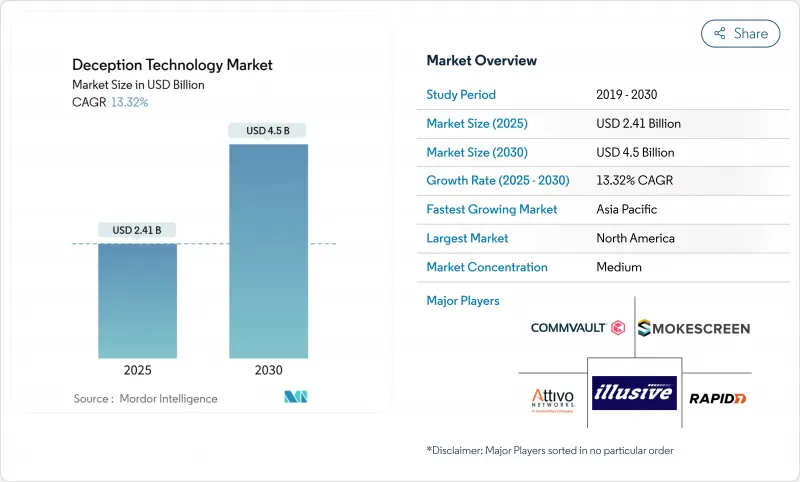
零时差攻击、人工智慧驱动的深度造假诈骗的兴起,以及云端原生工作负载的扩展,正迫使安全团队采用预警控制措施,以便在攻击者造成损害之前将其从网路内部发现。供应商现在正将诱饵整合到零信任微隔离中,为防御者提供即使身分或终端遭到洩漏也能正常运作的「绊线」。随着网路保险公司将主动横向移动侦测作为保费的先决条件,市场需求也正在加速成长。虽然北美仍引领市场,但随着多重云端采用率的激增以及各国监管机构加强资料外洩通知的监管,欺敌技术市场在亚太地区正迅速发展。
全球欺敌技术市场趋势与洞察
零日漏洞利用和定向高级持续性威胁的激增
国家支持的组织正在利用人工智慧实现自动化侦察,以远超基于特征码的防御机制适应速度发现新的漏洞。安全与技术研究所指出,自动化侦察缩短了攻击者的潜伏时间,迫使防御者重新思考其被动应对策略。欺骗平台利用使用者的好奇心,植入看似可信但实则虚假的资产。欺敌技术市场透过基于攻击者行为而非威胁情报来源进行侦测,能够有效抵御绕过哈希匹配控制的客製化恶意软体。供应商现在提供预先包装的诱饵程序,用于工业控制系统和SaaS API,这反映出攻击者越来越注重操作技术。
不断扩展的云端原生工作负载扩大了攻击面
容器化的无伺服器应用程式可以在几分钟内快速启动和关闭,使安全营运中心无法监控东西向流量。 Zscaler 部署生成式 AI 诱饵,模拟大规模语言模型端点,将攻击者引诱到仪器的沙箱中。这些诱饵可在 Kubernetes 命名空间内自动扩展,即使底层微服务发生变化,也能为防御者提供持续的保护。欺敌技术市场利用云端提供者的元资料API,无需安装代理程式即可在虚拟私有云端中部署陷阱。随着企业采用多重云端策略,跨供应商的诱饵编配正成为采购标准,尤其是在日誌无法集中储存在单一区域的受监管行业。
对传统诱饵系统的持续依赖
许多公司仍在运行几年前部署的静态诱饵系统。攻击者现在可以透过通讯协定特性和运作模式识别此类资产,从而轻鬆绕过它们。这种沉没成本偏好阻碍了升级到自适应诱饵的进程,而自适应诱饵可以改变操作系统横幅或自动轮换凭证。传统的诱饵系统也需要手动分析日誌,消耗了本应集中用于实际攻击途径的资源。这些工具很少能产生可操作的警报,导致董事会质疑其投资回报率,并阻碍了新的投资,从而抑制了欺敌技术市场的成长。
细分市场分析
到2024年,本地部署的欺敌技术将占据67.9%的市场份额,这反映出企业需要将高互动的诱饵系统部署在其核心系统附近,以满足合规性和取证管理的需求。然而,这种管理方式引入了硬体更新周期和变更管理开销,限制了系统的灵活性。目前规模较小的云端部署预计到2030年将以15.2%的复合年增长率成长,成为欺敌技术市场中成长最快的领域。云端基础的主机对于全球分店部署极具吸引力,因为它们允许在几分钟内跨区域启动诱饵系统。
混合模型应运而生,成为一种切实可行的桥樑,使团队能够在本地保留敏感资料库诱饵,同时将分析和扩展任务卸载到公有云。随着多重云端采用率的提高,买家要求能够在 AWS、Azure 和 Google Cloud 之间实现统一的视图,而服务供应商则增加对身分联合和不可变基础架构蓝图的投入。这些功能将扩大云端模组欺敌技术的市场,并使受监管部门相信,即使在责任共用模式下,也能满足审核控制要求。
大型企业在2024年之前将维持70.2%的收入份额,并将继续专注于API深度、MITRE ATT&CK架构一致性和进阶分析,从而完善其功能蓝图。然而,中小企业目前正经历着14.9%的成长,在欺敌技术市场支出方面超过了大型企业。按资产收费的订阅式託管欺骗服务降低了准入门槛,并提供适合小型团队频宽的客製化警报。
由于云端主机无需购买硬件,中小企业可以将资金重新投入意识提升计划中,从而进一步节省成本。对供应商而言,该领域的规模优势极具吸引力:数千家中型客户的授权收入相当于少数几家财富 500 强企业的授权收入。因此,蓝图的重点现在包括低程式码剧本和自动化诱饵部署,这些功能旨在将新用户入职时间从数週缩短到数小时,从而扩大中小企业对欺敌技术的市场规模。
欺敌技术市场报告按配置(本地部署和云端部署)、组织规模(大型企业和中小企业)、服务(託管服务和专业服务)、欺骗技术堆迭(资料安全、应用程式安全、其他)、最终用户(政府、国防、银行、金融服务和保险、IT 和通讯、其他)以及地区进行细分。
区域分析
到2024年,北美将占全球收入的41.8%,这主要得益于诸如CISA关于事件报告的严格规定,以及财富100强企业总部在该地区的高度集中,这些企业有能力为专门的控制措施提供资金。联邦政府合约中对欺骗能力的日益重视,进一步巩固了该地区在欺敌技术市场的领先地位。
在欧洲,NIS2 指令正稳步推进,不断扩大需要维护主动威胁侦测程序的营业单位范围。新兴的欧盟云端服务供应商现在提供符合规范的捆绑产品,这些产品原生整合了欺骗功能,对中型工业设备製造商极具吸引力。
亚太地区持续快速成长,复合年增长率高达13.8%。日本、印度和新加坡政府已启动津贴计划,共同资助包含欺骗技术的零信任试点计画。通讯业者部署5G独立核心网路扩大了攻击面,促使通讯业者安装信令通讯协定诱饵来侦测诈欺性基地台註册尝试。这些措施正在扩大该地区欺敌技术的市场。同时,拉丁美洲和中东及非洲地区也开始将欺骗技术融入关键基础设施升级,但预算限制和人才短缺使得短期内难以全面应用。
其他福利:
- Excel格式的市场预测(ME)表
- 3个月的分析师支持
目录
第一章 引言
- 研究假设和市场定义
- 调查范围
第二章调查方法
第三章执行摘要
第四章 市场情势
- 市场概览
- 市场驱动因素
- 零时差攻击和定向高级持续性威胁(APT)激增
- 云端原生工作负载的扩展扩大了攻击面
- 首席资讯安全长 (CISO) 更倾向于使用低摩擦、无代理的发现工具
- 人工智慧生成的深度造假身分攻击的兴起
- 欺骗与零信任微隔离的融合
- 网路保险政策要求主动进行横向移动检测
- 市场限制
- 对传统诱饵系统的深度依赖
- 缺乏具备欺骗技能的保全人员
- 对手利用大规模语言模型侦察来发现诱饵(隐藏在雷达之下)。
- 捆绑式 EDR/XDR 平台会占用您的预算
- 价值链分析
- 监管格局
- 技术展望
- 波特五力分析
- 新进入者的威胁
- 供应商的议价能力
- 买方的议价能力
- 替代品的威胁
- 竞争对手之间的竞争
- 投资分析
- 评估宏观经济趋势对市场的影响
第五章 市场规模与成长预测
- 透过部署
- 本地部署
- 云
- 按组织规模
- 大公司
- 小型企业
- 透过服务
- 託管服务
- 专业服务
- 欺骗堆迭
- 资料安全
- 应用程式安全
- 端点安全
- 网路安全
- 最终用户
- 政府
- 防御
- BFSI
- 资讯科技/通讯
- 卫生保健
- 其他最终用户
- 按地区
- 北美洲
- 美国
- 加拿大
- 墨西哥
- 欧洲
- 德国
- 英国
- 法国
- 义大利
- 西班牙
- 俄罗斯
- 其他欧洲地区
- 亚太地区
- 中国
- 日本
- 印度
- 韩国
- 澳洲和纽西兰
- 其他亚太地区
- 南美洲
- 巴西
- 阿根廷
- 其他南美
- 中东和非洲
- 中东
- 沙乌地阿拉伯
- 阿拉伯聯合大公国
- 土耳其
- 其他中东地区
- 非洲
- 南非
- 奈及利亚
- 其他非洲国家
- 北美洲
第六章 竞争情势
- 市场集中度
- 策略趋势
- 市占率分析
- 公司简介
- Illusive Networks
- Attivo Networks(SentinelOne)
- Rapid7
- Acalvio Technologies
- CounterCraft
- CyberTrap
- TrapX Security
- Smokescreen Technologies
- Ridgeback Network Defense
- LogRhythm
- WatchGuard Technologies
- Broadcom(Symantec)
- Morphisec
- Fortinet(FortiDeceptor)
- Zscaler
- Microsoft(Security Honeytokens)
- Akamai
- Palo Alto Networks
- Fidelis Cybersecurity
- Commvault(TrapX integration)
第七章 市场机会与未来展望
The deception technology market posted USD 2.41 billion in 2025 and is set to advance at a 13.3% CAGR to USD 4.50 billion by 2030.
Rising zero-day exploits, AI-driven deepfake fraud, and cloud-native workload expansion compel security teams to adopt early-warning controls that spot attackers inside the network before damage occurs. Vendors now weave decoys into zero-trust micro-segmentation, giving defenders tripwires that work even when identities or endpoints are compromised. Demand also accelerates because cyber-insurance carriers require proactive lateral-movement detection as a condition for favorable premiums. Although North America keeps spending leadership, the deception technology market gains rapid momentum in Asia-Pacific as multicloud adoption surges and local regulators tighten breach-notification rules.
Global Deception Technology Market Trends and Insights
Surge in Zero-Day Exploits and Targeted APTs
State-sponsored collectives automate reconnaissance with AI, finding novel vulnerabilities faster than signature-based defenses adapt. The Institute for Security and Technology notes that automated reconnaissance compresses attacker dwell time, forcing defenders to rethink reactive playbooks. Deception platforms insert believable but fake assets that weaponize curiosity; once probed, alerts trigger in seconds while production systems stay untouched. Because detection is based on attacker behavior rather than threat-intelligence feeds, the deception technology market provides resilience against bespoke malware that evades hash-matching controls. Vendors now pre-package decoys for industrial control systems and SaaS APIs, reflecting attacker pivot toward operational technology.
Escalating Cloud-Native Workloads Broaden Attack Surface
Containerized and serverless applications can spin up and down within minutes, leaving security operations centers blind to east-west traffic. Zscaler deploys generative-AI decoys that mimic large-language-model endpoints, luring attackers into instrumented sandboxes. Because decoys scale automatically inside Kubernetes namespaces, defenders gain continuous coverage even as underlying microservices change. The deception technology market capitalizes on cloud providers' metadata APIs to place traps inside virtual private clouds without installing agents. As organizations adopt multi-cloud strategies, cross-provider decoy orchestration becomes a buying criterion, especially in regulated industries that cannot centralize logs in a single region.
Entrenched Reliance on Legacy Honeypots
Many firms still run static honeypots deployed years ago. Attackers now fingerprint such assets through protocol quirks or uptime patterns, bypassing them with ease. This sunk-cost bias delays upgrades to adaptive decoys able to morph operating-system banners or rotate credentials automatically. Legacy honeypots also demand manual log parsing, consuming resources that should focus on real attack paths. Because these tools produce few actionable alerts, boards question ROI, thereby constraining new investment and dampening growth of the deception technology market.
Other drivers and restraints analyzed in the detailed report include:
- CISO Preference for Low-Friction, Agent-Less Detection Tools
- Rise of AI-Generated Deepfake Identity Attacks
- Scarcity of Deception-Skilled SecOps Staff
For complete list of drivers and restraints, kindly check the Table Of Contents.
Segment Analysis
On-premises deployment commanded 67.9% of deception technology market share in 2024, illustrating enterprises' need to keep high-interaction decoys close to crown-jewel systems for compliance and forensic control. That control, however, brings hardware refresh cycles and change-management overhead that limit agility. Cloud deployment contributes a modest slice today but is slated to rise at a 15.2% CAGR through 2030, the fastest pace within the deception technology market. Cloud-based consoles spin up decoys across regions within minutes, making them attractive for global branch rollouts.
Hybrid models emerge as a pragmatic bridge, letting teams place sensitive database decoys on-premises while offloading analysis and scaling tasks to public clouds. As multicloud adoption rises, buyers demand single-pane views across AWS, Azure, and Google Cloud, pushing providers to invest in identity federation and immutable infrastructure blueprints. These capabilities enhance the deception technology market size for cloud modules and convince regulation-bound sectors that shared-responsibility models can still satisfy audit controls.
Large enterprises retained 70.2% revenue share in 2024 and continue shaping feature roadmaps by insisting on API depth, MITRE ATT&CK alignment, and advanced analytics. Yet SMEs now register a 14.9% growth trajectory, outpacing big-company spending within the deception technology market. Subscription-based managed deception services, billed per asset, cut entry barriers and deliver curated alerts that fit smaller teams' bandwidth.
Savings compound because cloud consoles eliminate hardware purchase, allowing SMEs to reallocate capital toward employee awareness programs. For vendors, the segment's scale effect is compelling; thousands of mid-sized customers can equal the license revenue of a handful of Fortune 500 accounts. Consequently, roadmap priorities now include low-code playbooks and automated decoy placement, features designed to compress onboarding from weeks to hours and thereby expand deception technology market size among smaller firms.
The Deception Technology Market Report is Segmented by Deployment (On-Premises and Cloud), Organization Size (Large Enterprises and Small and Medium Enterprises (SMEs)), Service (Managed Services and Professional Services), Deception Stack (Data Security, Application Security, and More), End-User (Government, Defense, BFSI, IT and Telecommunication, and More), and Geography.
Geography Analysis
North America generated 41.8% of revenue in 2024, buoyed by stringent mandates such as CISA's directive on incident reporting and a concentration of Fortune 100 headquarters that can fund specialized controls. Federal contracts increasingly specify deception capabilities, further cementing the region's leadership within the deception technology market.
Europe advances steadily as the NIS2 Directive broadens the scope of entities required to maintain proactive threat-detection programs Local vendors stress data-sovereignty features, ensuring logs stay inside EU borders. Emerging EU cloud providers now embed deception natively, offering compliance-ready bundles that appeal to mid-market industrial manufacturers.
Asia-Pacific remains the fastest-growing territory at 13.8% CAGR. Governments in Japan, India, and Singapore launch grant programs that co-fund zero-trust pilots incorporating deception. Telecom rollouts of 5G standalone cores enlarge attack surfaces, pushing operators to install signaling-protocol decoys that detect rogue base-station registration attempts. These initiatives collectively enlarge deception technology market size in the region. Meanwhile, Latin America and Middle East and Africa start integrating deception into critical-infrastructure revamps, although budget constraints and talent gaps temper near-term uptake.
- Illusive Networks
- Attivo Networks (SentinelOne)
- Rapid7
- Acalvio Technologies
- CounterCraft
- CyberTrap
- TrapX Security
- Smokescreen Technologies
- Ridgeback Network Defense
- LogRhythm
- WatchGuard Technologies
- Broadcom (Symantec)
- Morphisec
- Fortinet (FortiDeceptor)
- Zscaler
- Microsoft (Security Honeytokens)
- Akamai
- Palo Alto Networks
- Fidelis Cybersecurity
- Commvault (TrapX integration)
Additional Benefits:
- The market estimate (ME) sheet in Excel format
- 3 months of analyst support
TABLE OF CONTENTS
1 INTRODUCTION
- 1.1 Study Assumptions and Market Definition
- 1.2 Scope of the Study
2 RESEARCH METHODOLOGY
3 EXECUTIVE SUMMARY
4 MARKET LANDSCAPE
- 4.1 Market Overview
- 4.2 Market Drivers
- 4.2.1 Surge in zero-day exploits and targeted APTs
- 4.2.2 Escalating cloud-native workloads broaden attack surface
- 4.2.3 CISO preference for low-friction, agent-less detection tools
- 4.2.4 Rise of AI-generated deepfake identity attacks
- 4.2.5 Convergence of deception with zero-trust micro-segmentation
- 4.2.6 Cyber-insurance policies demanding proactive lateral-movement detection
- 4.3 Market Restraints
- 4.3.1 Entrenched reliance on legacy honeypots
- 4.3.2 Scarcity of deception-skilled SecOps staff
- 4.3.3 Adversary use of large-language-model recon to spot decoys (under-the-radar)
- 4.3.4 Budget cannibalization by bundled EDR/XDR platforms
- 4.4 Value Chain Analysis
- 4.5 Regulatory Landscape
- 4.6 Technological Outlook
- 4.7 Porter's Five Forces Analysis
- 4.7.1 Threat of New Entrants
- 4.7.2 Bargaining Power of Suppliers
- 4.7.3 Bargaining Power of Buyers
- 4.7.4 Threat of Substitutes
- 4.7.5 Intensity of Competitive Rivalry
- 4.8 Investment Analysis
- 4.9 Assessment of the Impact of Macroeconomic Trends on the Market
5 MARKET SIZE AND GROWTH FORECASTS (VALUE)
- 5.1 By Deployment
- 5.1.1 On-premises
- 5.1.2 Cloud
- 5.2 By Organization Size
- 5.2.1 Large Enterprises
- 5.2.2 Small and Medium Enterprises (SMEs)
- 5.3 By Service
- 5.3.1 Managed Services
- 5.3.2 Professional Services
- 5.4 By Deception Stack
- 5.4.1 Data Security
- 5.4.2 Application Security
- 5.4.3 Endpoint Security
- 5.4.4 Network Security
- 5.5 By End-User
- 5.5.1 Government
- 5.5.2 Defense
- 5.5.3 BFSI
- 5.5.4 IT and Telecommunication
- 5.5.5 Healthcare
- 5.5.6 Other End-Users
- 5.6 By Geography
- 5.6.1 North America
- 5.6.1.1 United States
- 5.6.1.2 Canada
- 5.6.1.3 Mexico
- 5.6.2 Europe
- 5.6.2.1 Germany
- 5.6.2.2 United Kingdom
- 5.6.2.3 France
- 5.6.2.4 Italy
- 5.6.2.5 Spain
- 5.6.2.6 Russia
- 5.6.2.7 Rest of Europe
- 5.6.3 Asia-Pacific
- 5.6.3.1 China
- 5.6.3.2 Japan
- 5.6.3.3 India
- 5.6.3.4 South Korea
- 5.6.3.5 Australia and New Zealand
- 5.6.3.6 Rest of Asia-Pacific
- 5.6.4 South America
- 5.6.4.1 Brazil
- 5.6.4.2 Argentina
- 5.6.4.3 Rest of South America
- 5.6.5 Middle East and Africa
- 5.6.5.1 Middle East
- 5.6.5.1.1 Saudi Arabia
- 5.6.5.1.2 United Arab Emirates
- 5.6.5.1.3 Turkey
- 5.6.5.1.4 Rest of Middle East
- 5.6.5.2 Africa
- 5.6.5.2.1 South Africa
- 5.6.5.2.2 Nigeria
- 5.6.5.2.3 Rest of Africa
- 5.6.1 North America
6 COMPETITIVE LANDSCAPE
- 6.1 Market Concentration
- 6.2 Strategic Moves
- 6.3 Market Share Analysis
- 6.4 Company Profiles (includes Global level Overview, Market level overview, Core Segments, Financials as available, Strategic Information, Market Rank/Share for key companies, Products and Services, and Recent Developments)
- 6.4.1 Illusive Networks
- 6.4.2 Attivo Networks (SentinelOne)
- 6.4.3 Rapid7
- 6.4.4 Acalvio Technologies
- 6.4.5 CounterCraft
- 6.4.6 CyberTrap
- 6.4.7 TrapX Security
- 6.4.8 Smokescreen Technologies
- 6.4.9 Ridgeback Network Defense
- 6.4.10 LogRhythm
- 6.4.11 WatchGuard Technologies
- 6.4.12 Broadcom (Symantec)
- 6.4.13 Morphisec
- 6.4.14 Fortinet (FortiDeceptor)
- 6.4.15 Zscaler
- 6.4.16 Microsoft (Security Honeytokens)
- 6.4.17 Akamai
- 6.4.18 Palo Alto Networks
- 6.4.19 Fidelis Cybersecurity
- 6.4.20 Commvault (TrapX integration)
7 MARKET OPPORTUNITIES AND FUTURE OUTLOOK
- 7.1 White-space and Unmet-need Assessment
 欺骗技术市场:按组件、部署模式、组织规模和最终用户划分-2026-2032年全球市场预测
 2026年全球欺骗技术市场报告
 欺骗技术市场分析及预测(至2035年):依类型、产品类型、服务、技术、组件、应用、部署类型、最终用户及功能划分
 欺骗科技市场 - 全球产业规模、份额、趋势、机会、预测:按部署方式、组件、欺骗技术堆迭、最终用户、地区和竞争对手划分,2021-2031 年
 欺骗技术市场规模、份额和成长分析(按组件、欺骗技术栈、部署模式、公司类型、垂直产业和地区划分)-2026-2033年产业预测
 欺骗技术市场(按组件、欺骗堆迭和地区划分)
 2025 年至 2033 年欺骗技术市场报告(按欺骗堆迭、服务、部署、组织规模、最终用户和地区划分)
 全球欺骗技术市场规模研究,按产品、欺骗堆迭、企业规模、产业垂直和区域预测 2022-2032
 欺骗技术市场规模、份额、趋势分析报告:按组件、欺骗堆迭、部署、组织规模、产业、地区和细分市场进行预测,2024-2030 年