


 |
市场调查报告书
商品编码
1628772
供应链巨量资料分析:市场占有率分析、产业趋势、成长预测(2025-2030)Supply Chain Big Data Analytics - Market Share Analysis, Industry Trends & Statistics, Growth Forecasts (2025 - 2030) |
||||||
※ 本网页内容可能与最新版本有所差异。详细情况请与我们联繫。
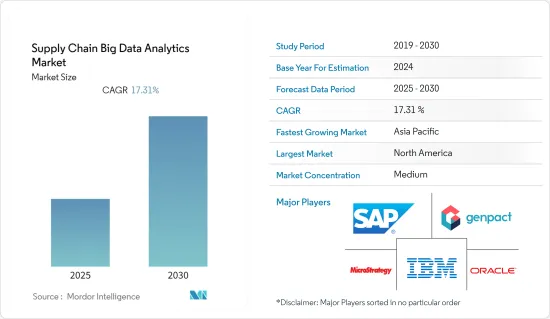
供应链巨量资料分析市场预计在预测期间内复合年增长率为17.31%
主要亮点
- 随着数位技术的普及,巨量资料分析(BDA)已成为关键的业务能力,它为公司提供了更好的机会,从越来越多的资料中提取价值并获得压倒性的竞争优势。
- 巨量资料分析有助于改善製造业的供应链。例如,可以利用电价的变化来安排能源密集型製造流程。储存和检查有关生产特征的资料(例如组装力和零件之间的尺寸变化)可以帮助识别错误的根本原因,即使错误发生在几年后。农业种子加工商和生产商使用各种类型的摄影机来即时监控产品品质并获得单一种子的品质评级。
- 货运公司已经使用分析来优化业务。例如,我们采用燃油使用分析来提高车辆经济性,并采用 GPS 技术透过即时分配储存空间来减少等待时间。宅配公司开始根据卡车地理位置和拥塞资料安排向消费者即时送货。例如,UPS 投资 10 年打造公路式综合优化导航系统(Orion),改善其网路上的 55,000 条路线。执行长 David Abney 表示,新方法每年将节省 3 亿美元至 4 亿美元的成本。巨量资料分析还可以透过挖掘资料来预测小包裹何时交付,从而帮助物流运营商以更少的交付工作量交付货物。
- 巨量资料分析还可以帮助企业探索相关产品分组的销售效益。谷歌收购了 Skybox,一家提供高解析度卫星图像的公司。 Skybox 可用于观察停车场的汽车并预测商店的需求。一些公司也正在探索使用配备摄影机的无人机来追踪商店的库存水准。
- COVID-19 大流行对全球供应系统造成了破坏和风险。巨量资料分析 (BDA) 最近已成为一种可行的解决方案,可为企业提供预测性和先发製人的信息,以规划和减轻此类危害的影响。这场灾难凸显了供应链解决方案的必要性,以确保长期的经济永续性。在这些困难时期,供应链分析透过识别需要立即调整的流程以及预计很快就会耗尽的产品和物品,帮助企业更好地管理供需之间的差距。此外,我们的供应商正在积极开发和提供解决方案,以减轻疫情对全球供应链的不利影响。
供应链巨量资料分析市场趋势
零售业预计将大幅成长
- 零售业目前在供应链巨量资料分析市场中占据很大一部分,透过在整个供应链中采用物联网解决方案、信标和 RFID 技术产生的资料来源的增加预计将带来许多成长机会。此外,零售额的扩张预计将推动市场成长。例如,去年美国零售总额约4.86兆美元,较前一年增加530亿美元。
- 零售商可以利用新的资料来源来改善其规划程序和需求感知能力。例如,Blue Yonder 创建了一种资料密集型预测演算法,已在零售业中使用,每天从 130,000 个 SKU 和 200 个影响变数中产生 150,000,000 个机率分布。这显着提高了预测准确性,并更好地了解公司的物流能力需求,减少了过时、存量基准和库存积压。 Blue Yonder 等第三方云端基础平台最近的扩张使得其他零售商更容易进行类似的活动。
- 随着世界各国政府建议个人留在家中并制定社交距离规定,网上购物进一步增加。疫情期间,零售业对分析解决方案的需求急剧增加。例如,2021年,沃尔玛开发了Walmart Luminate,这是一个从沃尔玛消费者中心收集资讯的平台,并提供对沃尔玛众多品牌的认知度、受众行为和管道成功的洞察。去年10月,该公司宣布很快将为供应商推出免费的基本套餐,使大大小小的供应商能够更轻鬆地与商家合作并发展业务。沃尔玛 Luminate Basics 将于今年稍后上市。
- 此外,商家正在使用物联网解决方案和设备来分析消费者资料、管理存量基准并改善客户互动。这些技术进步改善了对整个供应链中物品的监控,并提供了更清晰的客户行为图景。
- 例如,透过在销售楼层的天花板空间安装RFID读取器,我们能够扫描展示的所有产品,从而实现更准确的库存视觉化。 American Apparel 使用 RFID 标籤和资料分析技术来增强库存管理,而 Walmart 使用巨量资料分析来改善店内管理和供应链管理。
预计北美将占据主要份额
- 美国企业和政府不断致力于透过提高本国製造业的生产力并重点加强整个供应链的运作来振兴该国的製造业。随着美国电子商务业务的扩张,对有效供应链管理的需求也不断增长。美国商务部数据显示,去年第三季美国电子商务业务成长10.8%。线上订单占零售金额的 20.6% 以上。
- 美国是世界上最大的零售市场之一,COVID-19 对其造成了沉重打击。但要让数字走上正轨并促进成长以保持势头,需要复杂的技术来评估这种规模的资料。根据美国零售联合会 (NRF) 的数据,零售业是美国最大的私营行业,年 GDP 达 3.9 兆美元,僱用了四分之一的美国人(5,200 万人)。
- 根据美国人口普查局的数据,去年 3 月零售额经季节已调整的较 2 月成长 0.5%,较去年同月成长 6.9%。 2月份销售额较上季成长0.8%,较去年同期成长18.2%。
- 此外,在北美零售业,电子零售商正在寻求透过当日送达来改善消费者体验,这可以透过良好的供应链管理来有效实现。
- 此外,区域新兴企业正在筹集资金,以利用巨量资料分析和其他新技术来提高业务效率。例如,去年 9 月,Kharon 是一家为全球安全和业务交叉点的企业提供情报的分析和资料公司,推出了一个用于分销链映射和零售跟踪的国际业务连接和云端基础的平台。号合作。客户可以使用 Transparency-One 执行产品级分销链映射和文件监控,并根据 Kharon 的强迫劳动资料库自动筛检拒绝品和高风险个人。
供应链巨量资料分析产业概况
供应链巨量资料分析市场竞争激烈,由多家大型企业组成。就市场占有率而言,目前由几家大型企业主导市场,包括 SAP SE、IBM 公司、Oracle 公司、MicroStrategy Incorporated 和 Genpact Limited。这些公司利用策略合作倡议来提高市场占有率和盈利。
2022 年 10 月, Oracle宣布在其资料和分析解决方案组合中开发众多新产品。 Oracle Fusion Analytics 针对 ERP、CX、SCM 和 HCM 分析的附加功能为决策者提供了 2,000 多个主动仪表板、KPI 和最佳实践报告,以根据策略目标评估绩效。 2022 年 11 月,AWS 宣布推出 AWS 供应链。这个新平台将使公司能够提高供应链的可见性,并做出更快、更明智的选择,从而降低风险、降低成本并改善客户体验。 AWS Supply Chain 无缝聚合和分析来自众多供应链系统的资料。这使得企业能够即时监控营运状况,更快地识别模式,并提供更准确的需求预测,以确保有足够的库存来满足消费者的期望。
其他好处:
- Excel 格式的市场预测 (ME) 表
- 3 个月的分析师支持
目录
第一章简介
- 调查先决条件
- 调查范围
第二章调查方法
第三章执行摘要
第四章市场洞察
- 市场概况
- 市场驱动因素
- 对业务资料提高效率的需求不断增长
- 市场限制因素
- 操作复杂、维护成本高
- 价值链/供应链分析
- 行业景点-波特五力
- 新进入者的威胁
- 买家/消费者的议价能力
- 供应商的议价能力
- 替代品的威胁
- 竞争公司之间敌对关係的强度
- COVID-19 市场影响评估
第五章市场区隔
- 按类型
- 解决方案
- 供应链采购与规划工具
- 销售和业务规划
- 製造分析
- 运输/物流分析
- 其他解决方案(库存计划和优化分析、调度和彙报工具)
- 服务
- 专业服务
- 支援和维护服务
- 解决方案
- 按最终用户
- 零售
- 运输/物流
- 製造业
- 卫生保健
- 其他最终用户
- 按地区
- 北美洲
- 美国
- 加拿大
- 欧洲
- 英国
- 德国
- 法国
- 义大利
- 其他欧洲国家
- 亚太地区
- 中国
- 日本
- 韩国
- 印度
- 其他亚太地区
- 拉丁美洲
- 墨西哥
- 巴西
- 阿根廷
- 其他拉丁美洲
- 中东/非洲
- 阿拉伯聯合大公国
- 沙乌地阿拉伯
- 南非
- 其他中东和非洲
- 北美洲
第六章 竞争状况
- 公司简介
- SAP SE(SAP)
- IBM Corporation
- Oracle Corporation
- MicroStrategy Incorporated
- Genpact Limited
- SAS Institute Inc.
- Sage Clarity Systems
- Salesforce.com Inc(Tableau Software Inc.)
- Birst Inc.
- Capgemini Group
- Kinaxis Inc.
第七章 投资分析
第八章 市场机会及未来趋势
The Supply Chain Big Data Analytics Market is expected to register a CAGR of 17.31% during the forecast period.
Key Highlights
- The widespread use of digital technologies has led to the emergence of Big Data Analytics (BDA) as a critical business capability to provide companies with better opportunities to obtain value from an increasingly huge amount of data and gain a commanding competitive advantage.
- Big data analytics aid in the improvement of the supply chain in the manufacturing business. For example, energy-intensive manufacturing runs can be scheduled to take advantage of changing electricity rates. Data on production characteristics, such as assembly forces or size variances between components, can be saved and examined to aid in the root-cause investigation of errors, even if they arise years later. Agricultural seed processors and producers monitor the quality of their products in real-time using various types of cameras to obtain quality assessments for every individual seed.
- Analytics are already being used by trucking businesses to optimize their operations. For example, they employ fuel usage analytics to increase vehicle economy and GPS technology to cut waiting times by distributing storage spaces in real time. Courier companies have begun real-time scheduling of deliveries to consumers based on geo-location and congestion data from their trucks. UPS, for example, has invested ten years in creating its On-Road Integrated Optimization and Navigation system (Orion) to improve the network's 55,000 paths. According to the company's CEO, David Abney, the new method would save $300 million to $400 million yearly. Big data analytics will also assist logistics operators in delivering goods with fewer delivery efforts by mining their data to estimate when a parcel will be delivered.
- Big data analytics can help businesses investigate the sales benefits of grouping related goods together. Google has bought Skybox, a source of high-resolution satellite images that can be used to watch automobiles in a parking lot to predict in-store demand. Others have investigated the use of camera-equipped drones to track on-shelf stock levels.
- The pandemic of COVID-19 has caused disruptions and hazards in global supply systems. Big data analytics (BDA) has recently arisen as a viable solution for providing firms with predicted and pre-emptive information to assist them in planning and reducing the effects of such hazards. The outbreak highlighted the need for solutions for supply chains to ensure long-term economic sustainability. During these difficult times, supply chain analytics helped firms to detect processes that needed immediate adjustment or products/items that were expected to run out soon, helping them to manage the demand-supply gap better. Furthermore, the suppliers are actively developing and delivering solutions to mitigate the detrimental effects of the outbreak on global supply chains.
Supply Chain Big Data Analytics Market Trends
Retail is Expected to Register a Significant Growth
- The retail industry currently accounts for a significant portion of the supply chain big data analytics market, and it is expected to present numerous growth opportunities as a result of the increasing number of data sources generated by the adoption of IoT solutions, beacons, and RFID technologies throughout the supply chain. Additionally, growing retail sales are expected to drive market growth. For instance, last year, total retail sales in the United States were roughly USD 4.86 trillion, up USD 53 billion from the previous year.
- Retailers may enhance their planning procedures and demand-sensing capacities by utilizing new data sources. Blue Yonder, for instance, has created data-intensive forecasting algorithms already being used in retail, wherein 130,000 SKUs and 200 impacting variables yield 150,000,000 probability distributions each day. This has significantly improved forecast accuracy, provided a better understanding of the firm's logistical capacity requirements, and decreased obsolescence, stock levels, and excess inventory. The recent expansion of third-party cloud-based platforms such as Blue Yonder makes similar activities more available to other retailers.
- Governments worldwide have advised individuals to stay at home and are enacting social distancing regulations, increasing internet purchasing even more. During the pandemic, the demand for analytics solutions in retail has increased dramatically. Walmart, for example, developed Walmart Luminate in 2021, a platform that collects information from Walmart's consumer center and provides insights on perception, audience behavior, and channel success for the numerous brands at Walmart. In October last year, the company announced the forthcoming introduction of a Basic package at no cost to suppliers, making it even more straightforward for suppliers of any scale to engage with merchants to expand their companies. Walmart Luminate Basic is scheduled to go on the market in the current year.
- Furthermore, merchants use IoT solutions and devices to analyze consumer data, manage stock levels, and improve customer interactions. These technological advancements allow for improved monitoring of items across the supply chain and aid in acquiring a clear insight into client behavior.
- For instance, merchants have also installed a system of RFID readers into the ceiling space of the sales floors, enabling them to scan all of the items on show and offering more precise inventory visibility. American Apparel uses RFID tags and data analytics technologies to enhance inventory control, while Walmart uses Big Data analytics to improve in-store and supply-chain management.
North America is Expected to Hold Major Share
- Companies and governments in the United States are constantly working to boost their manufacturing business by increasing productivity and focusing on strengthening operations across the supply chain in the country's manufacturing industry. As the e-commerce business in the United States expands, so does the demand for effective supply chain management. According to the US Commerce Department, the country's e-commerce business grew by 10.8% in the third quarter of the last year. Online orders accounted for over 20.6% of all retail dollars spent.
- The United States is one of the world's largest retail marketplaces, and covid-19 influenced it considerably. However, getting back on track with rising numbers and augmenting growth to keep the momentum going requires advanced tech to evaluate data at that scale. According to the National Retail Federation (NRF), retail is the country's biggest private industry, accounting for USD 3.9 trillion yearly GDP and employing one in every four Americans (52 million).
- According to the US Census Bureau, retail sales in March last year were up 0.5% seasonally adjusted from February and 6.9% Y-O-Y. In February, there were rises of 0.8% month over month and 18.2% Y-O-Y.
- Additionally, E-retailers in the North American retail sector are trying to improve the consumer experience by including same-day delivery, which may be accomplished efficiently with excellent supply chain management.
- Further, regional startups are gathering funds to improve operational efficiency using Big Data analytics and other new technologies. For example, Kharon, an analytics and data company providing companies with intelligence at the intersection of world security and business, announced a partnership with Transparency-One, an international business connectivity and cloud-based platform for distribution network mapping and sub-tier tracking, in September last year. Clients may use Transparency-One to perform product-level distribution network mapping and document monitoring while also automating refused and high-risk party screenings against Kharon's sector Forced Labor database.
Supply Chain Big Data Analytics Industry Overview
The supply chain big data analytics market is highly competitive and consists of several major players. In terms of market share, a few major players currently dominate the market, including SAP SE, IBM Corporation, Oracle Corporation, MicroStrategy Incorporated, and Genpact Limited, among others. These companies leverage strategic collaborative initiatives to increase their market shares and profitability.
In October 2022, Oracle unveiled a slew of new product developments across its complete data and analytics solutions portfolio. With the additional features in Oracle Fusion Analytics for ERP, CX, SCM, and HCM analytics, decision-makers have a prebuilt collection of over 2,000 best-practice dashboards, KPIs, and reports to evaluate performance against strategic objectives. In November 2022, AWS introduced AWS Supply Chain. This new platform enables organizations to supply chain visibility better to make quicker, more informed choices that reduce risks, save money, and enhance customer experiences. AWS Supply Chain seamlessly aggregates and analyzes data from numerous supply chain systems. This allows businesses to monitor their operations in real-time, identify patterns faster, and provide more accurate demand projections to guarantee enough inventory to fulfill consumer expectations.
Additional Benefits:
- The market estimate (ME) sheet in Excel format
- 3 months of analyst support
TABLE OF CONTENTS
1 INTRODUCTION
- 1.1 Study Assumptions
- 1.2 Scope of the Study
2 RESEARCH METHODOLOGY
3 EXECUTIVE SUMMARY
4 MARKET INSIGHTS
- 4.1 Market Overview
- 4.2 Market Drivers
- 4.2.1 Increasing Need of Business Data to Improve Efficiency
- 4.3 Market Restraints
- 4.3.1 Operational Complexity Coupled with High Maintenance Costs
- 4.4 Value Chain / Supply Chain Analysis
- 4.5 Industry Attractiveness - Porter Five Forces
- 4.5.1 Threat of New Entrants
- 4.5.2 Bargaining Power of Buyers/Consumers
- 4.5.3 Bargaining Power of Suppliers
- 4.5.4 Threat of Substitute Products
- 4.5.5 Intensity of Competitive Rivalry
- 4.6 Assessment of the Impact of COVID-19 on the Market
5 MARKET SEGMENTATION
- 5.1 By Type
- 5.1.1 Solution
- 5.1.1.1 Supply Chain Procurement and Planning Tool
- 5.1.1.2 Sales and Operations Planning
- 5.1.1.3 Manufacturing Analytics
- 5.1.1.4 Transportation and Logistics Analytics
- 5.1.1.5 Other Solutions (Inventory Planning and Optimization Analytics and Scheduling and Reporting Tools)
- 5.1.2 Service
- 5.1.2.1 Professional Service
- 5.1.2.2 Support and Maintenance Service
- 5.1.1 Solution
- 5.2 End User
- 5.2.1 Retail
- 5.2.2 Transportation and Logistics
- 5.2.3 Manufacturing
- 5.2.4 Healthcare
- 5.2.5 Other End Users
- 5.3 Geography
- 5.3.1 North America
- 5.3.1.1 United States
- 5.3.1.2 Canada
- 5.3.2 Europe
- 5.3.2.1 United Kingdom
- 5.3.2.2 Germany
- 5.3.2.3 France
- 5.3.2.4 Italy
- 5.3.2.5 Rest of Europe
- 5.3.3 Asia-Pacific
- 5.3.3.1 China
- 5.3.3.2 Japan
- 5.3.3.3 South Korea
- 5.3.3.4 India
- 5.3.3.5 Rest of Asia-Pacific
- 5.3.4 Latin America
- 5.3.4.1 Mexico
- 5.3.4.2 Brazil
- 5.3.4.3 Argentina
- 5.3.4.4 Rest of Latin America
- 5.3.5 Middle-East & Africa
- 5.3.5.1 United Arab Emirates
- 5.3.5.2 Saudi Arabia
- 5.3.5.3 South Africa
- 5.3.5.4 Rest of Middle-East & Africa
- 5.3.1 North America
6 COMPETITIVE LANDSCAPE
- 6.1 Company Profiles
- 6.1.1 SAP SE (SAP)
- 6.1.2 IBM Corporation
- 6.1.3 Oracle Corporation
- 6.1.4 MicroStrategy Incorporated
- 6.1.5 Genpact Limited
- 6.1.6 SAS Institute Inc.
- 6.1.7 Sage Clarity Systems
- 6.1.8 Salesforce.com Inc (Tableau Software Inc.)
- 6.1.9 Birst Inc.
- 6.1.10 Capgemini Group
- 6.1.11 Kinaxis Inc.
7 INVESTMENT ANALYSIS
8 MARKET OPPORTUNITIES AND FUTURE TRENDS
 半导体和电子市场巨量资料分析:市场分析及至 2035 年预测(按类型、产品类型、服务、技术、组件、应用、部署类型、最终用户、解决方案划分)巨量资料分析市场分析及预测(至2035年):按类型、产品类型、服务、技术、组件、应用、部署类型、最终用户和功能划分
 全球智慧电錶资料分析市场预测(至2034年):按组件、分析类型、部署模式、公共产业类型、组织规模、通讯技术、应用、最终用户和地区划分
 全球半导体和电子产品巨量资料分析市场报告(2026 年)
 巨量资料分析市场-全球产业规模、份额、趋势、机会和预测:按组件、部署模式、应用、组织规模、垂直产业、地区、竞争格局和机会划分,2021-2031年银行业资料分析市场-全球产业规模、份额、趋势、机会及预测(按部署类型、类型、解决方案、最终用户、地区和竞争格局划分,2021-2031年)2025年全球银行业巨量资料分析市场报告
 巨量资料分析市场规模、份额和成长分析(按分析工具、部署类型、应用、最终用户产业和地区划分)-2026-2033年产业预测
 银行业巨量资料分析市场规模、份额和成长分析(按资料来源、类型、应用、部署类型和地区划分)-产业预测,2025-2032年2025年全球银行、金融服务与保险(BFSI)巨量资料分析市场报告