


 |
市场调查报告书
商品编码
1630309
页岩气 -市场占有率分析、产业趋势/统计、成长预测(2025-2030)Shale Gas - Market Share Analysis, Industry Trends & Statistics, Growth Forecasts (2025 - 2030) |
||||||
价格
※ 本网页内容可能与最新版本有所差异。详细情况请与我们联繫。
简介目录
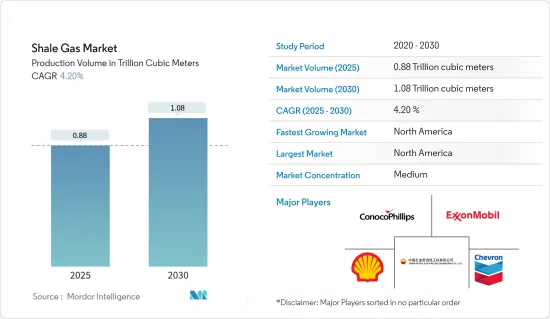
以产量为基础的页岩气市场规模预计将从2025年的8,800亿立方公尺扩大到2030年的1.08兆立方米,预测期间(2025-2030年)复合年增长率为4.2%。
主要亮点
- 从中期来看,已探明的页岩气蕴藏量以及最近水平钻井和水力压裂方面的技术干预等因素预计将长期推动市场。
- 另一方面,石油市场波动和探勘成本高(价格低于页岩气生产成本)是市场的两大限制因素。
- 新页岩气蕴藏量的发现预计将为未来市场创造多个机会。
- 由于页岩气的大规模生产,预计北美将在预测期内成为最大的市场。预计美国将引领该地区的页岩气生产。
页岩气市场趋势
环境担忧加剧抑制市场
- 钻井过程中的甲烷气体排放构成潜在的空气污染风险。此外,水力压裂作业中使用的大量化学处理水处理不当可能会导致严重的地表水污染。这引起了世界各地环保组织和非政府组织的批评。由于水力压裂对健康和农业的影响,当地农民和居民一再反对。
- 此外,典型的水力压裂井在水力压裂作业期间需要大约200万至1000万加仑的水,这给供水带来了额外的压力,特别是在干旱地区。
- 2022年,北美和亚太地区将成为全球二氧化碳排放最高的地区。另一方面,欧洲、中东和非洲的二氧化碳排放最低。 2022年,全球石化燃料和工业二氧化碳排放总合371.5亿吨。预计2023年排放将增加1.1%,达到375.5亿吨的历史新高。自1990年以来,全球二氧化碳排放增加了60%以上。
- 近期,在美国西部二迭纪盆地所在地德克萨斯州(预计将引领美国页岩气成长),页岩气公司因缺水而面临农民的反对和批评。
- 美国地质调查局(USGS)将美国东部以石油和天然气开采而闻名的部分地区近期地震增加归咎于页岩气活动。
- 因此,对环境问题的日益担忧预计将在预测期内抑制市场。
北美市场占据主导地位
- 美国是世界上最大的页岩气生产国。包括巴西、加拿大、中国和阿根廷在内的多个国家都在试图效法美国的页岩油繁荣,但没有成功。然而,儘管中国取得了重大进展,但由于储存不稳定造成的困难,页岩气产量在预测期内可能只会小幅增加。
- 根据美国能源资讯署 (EIA) 的数据,2022 年美国页岩地层的干天然气产量将约为 28.5 兆立方英尺 (Tcf),约占美国干天然气当量总产量的 80%。
- 加拿大以其庞大的传统天然气蕴藏量而闻名,几十年来一直是美国的主要天然气供应国,直到最近的页岩气繁荣为止。然而,随着传统型天然气来源的减少,加拿大工业正在转向传统型天然气来源,包括页岩气。目前,许多石油天然气公司正在亚伯达、不列颠哥伦比亚省、魁北克省和新不伦瑞克省探勘和开发页岩气资源,页岩气产量缺口可能在不久的将来得到平衡。
- 根据能源资讯署(EIA)的预测,该地区在预测期内可能需要更多的天然气供应,这将推动页岩气探勘和生产的投资。
- 因此,由于北美大陆页岩气产量压倒性,预计北美将主导市场。
页岩气产业概况
页岩气市场是半分割的。该市场的主要企业(排名不分先后)包括切萨皮克能源公司、壳牌公司、埃克森美孚公司、中国石油天然气有限公司和康菲石油公司。
其他好处
- Excel 格式的市场预测 (ME) 表
- 3 个月分析师支持
目录
第一章简介
- 调查范围
- 市场定义
- 研究场所
第二章调查方法
第三章执行摘要
第四章市场概况
- 介绍
- 2029 年页岩气产量与预测
- 最新趋势和发展
- 政府法规和措施
- 市场动态
- 促进因素
- 已探明页岩气蕴藏量
- 水平钻井和水力压裂技术进步
- 抑制因素
- 探勘成本高
- 促进因素
- 供应链分析
- 波特五力
- 供应商的议价能力
- 消费者议价能力
- 新进入者的威胁
- 替代品的威胁
- 竞争公司之间敌对关係的强度
第五章市场区隔
- 地区
- 北美洲
- 美国
- 加拿大
- 北美其他地区
- 南美洲
- 巴西
- 阿根廷
- 智利
- 哥伦比亚
- 南美洲其他地区
- 亚太地区
- 中国
- 印度
- 日本
- 澳洲
- 马来西亚
- 泰国
- 印尼
- 越南
- 其他亚太地区
- 欧洲
- 德国
- 法国
- 英国
- 义大利
- 西班牙
- 北欧的
- 土耳其
- 俄罗斯
- 欧洲其他地区
- 中东/非洲
- 阿拉伯聯合大公国
- 沙乌地阿拉伯
- 卡达
- 南非
- 奈及利亚
- 埃及
- 北美洲
第六章 竞争状况
- 併购、合资、联盟、协议
- 主要企业策略
- 公司简介
- Antero Resources Corp.
- Southwestern Energy Company
- EQT Corporation
- Equinor ASA
- Repsol SA
- China Petroleum & Chemical Corporation(SINOPEC)
- Chesapeake Energy Corporation
- Shell PLC
- Exxon Mobil Corporation
- Chevron Corporation
- PetroChina Company Limited
- ConocoPhillips Company
- Pioneer Natural Resources
- Market Player Ranking
第七章 市场机会及未来趋势
- 发现新的页岩气蕴藏量
简介目录
Product Code: 67285
The Shale Gas Market size in terms of production volume is expected to grow from 0.88 trillion cubic meters in 2025 to 1.08 trillion cubic meters by 2030, at a CAGR of 4.2% during the forecast period (2025-2030).
Key Highlights
- Over the medium term, factors such as proved shale gas reserves and the recent technological interventions in horizontal drilling and hydraulic fracturing are expected to drive the market in the long term.
- On the other hand, volatility in the oil market with prices below the shale gas production cost and high exploration cost are two critical restraints in the market.
- Nevertheless, the discovery of new shale gas reserves are expected to create several opportunities for the market in the future.
- North America is expected to be the largest market in the forecast period, owing to its large-scale production of shale gas in the region. The United States is expected to lead shale gas production in the area.
Shale Gas Market Trends
Increasing Environmental Concerns to Restrain the Market
- Methane gas emissions during the drilling process pose potential air pollution risks. Additionally, incorrect disposal of large volumes of chemically treated water used in hydraulic fracturing operations can potentially cause severe surface water contamination. This has attracted criticism from environmental protection bodies and NGOs around the world. Due to its impact on health and farming, local farmers and residents have repeatedly opposed hydraulic fracturing.
- Additionally, a typical fracking well requires approximately 2-10 million gallons of water during fracking operations, which puts additional strain on the water supply, particularly in drought-prone regions.
- In 2022, North America and Asia-Pacific recorded the world's highest carbon dioxide emissions. While Europe, the Middle East, and Africa tend to have the lowest emission. The global carbon dioxide emissions from fossil fuels and industry totaled 37.15 billion metric tons in 2022. Emissions are projected to increase by 1.1 percent in 2023 to reach a record high of 37.55 billion metric tons. Since 1990, global CO2 emissions have increased by more than 60 percent.
- Recently in West Texas of the United States, where the Permian Basin (expected to drive the growth of shale gas activities in the United States) is located, shale gas companies faced opposition and criticism from the farmers due to the water shortage.
- The United States Geological Survey (USGS) blamed shale gas activities for the increase in earthquakes in recent times in certain parts of the Central and Eastern United States that are well-known for oil and gas extraction.
- Thus, the increasing environmental concerns are expected to restrain the market during the forecast period.
North America to Dominate the Market
- The United States is the largest producer of shale gas in the world. Different countries, such as Brazil, Canada, China, and Argentina, have tried to emulate the American shale boom but have not been able to succeed. However, large progress has been made in China, but due to the difficulties posed by the unstable reservoirs, shale gas production may only rise slightly in the forecast period.
- According to U.S. Energy Information Administration (EIA) in 2022, U.S. dry natural gas production from shale formations was about 28.5 trillion cubic feet (Tcf) and equal to about 80% of total U.S. dry natural gas production in 2022.Shale gas production may increase further due to new wells being drilled across the country.
- While Canada is known to have significant conventional gas reserves, and the country was a key supplier of natural gas to the United States for decades until the recent shale boom in the country. However, with conventional natural gas sources in decline, Canada's industry is turning to unconventional sources, including shale gas. Many oil and gas companies are now exploring and developing shale gas resources in Alberta, British Columbia, Quebec, and New Brunswick, which may balance the difference in shale gas production in the coming future.
- An Energy Information Agency (EIA) estimation shows that the current scenario of the region may demand more natural gas supply during the forecast period, which may attract investment in the exploration and production of shale gas.
- Hence, North America is expected to dominate the market due to the overwhelming production of shale on the continent.
Shale Gas Industry Overview
The shale gas market is semi fragmented. Some of the key players in this market (in no particular order) includes Chesapeake Energy Corporation, Shell PLC, Exxon Mobil Corporation, PetroChina Company Limited, and ConocoPhillips Company, among others.
Additional Benefits:
- The market estimate (ME) sheet in Excel format
- 3 months of analyst support
TABLE OF CONTENTS
1 INTRODUCTION
- 1.1 Scope of the Study
- 1.2 Market Definition
- 1.3 Study Assumptions
2 RESEARCH METHODOLOGY
3 EXECUTIVE SUMMARY
4 MARKET OVERVIEW
- 4.1 Introduction
- 4.2 Shale Gas Production and Forecast, until 2029
- 4.3 Recent Trends and Developments
- 4.4 Government Policies and Regulations
- 4.5 Market Dynamics
- 4.5.1 Drivers
- 4.5.1.1 Proven Shale Gas Reserves
- 4.5.1.2 Technological Advancement in Horizontal Drilling and Hydraulic Fracturing
- 4.5.2 Restraints
- 4.5.2.1 High Exploration Cost
- 4.5.1 Drivers
- 4.6 Supply Chain Analysis
- 4.7 Porter Five Forces
- 4.7.1 Bargaining Power of Suppliers
- 4.7.2 Bargaining Power of Consumers
- 4.7.3 Threat of New Entrants
- 4.7.4 Threat of Substitutes Products and Services
- 4.7.5 Intensity of Competitive Rivalry
5 MARKET SEGMENTATION
- 5.1 Geography
- 5.1.1 North America
- 5.1.1.1 United States
- 5.1.1.2 Canada
- 5.1.1.3 Rest of North America
- 5.1.2 South America
- 5.1.2.1 Brazil
- 5.1.2.2 Argentina
- 5.1.2.3 Chile
- 5.1.2.4 Colombia
- 5.1.2.5 Rest of South America
- 5.1.3 Asia-Pacific
- 5.1.3.1 China
- 5.1.3.2 India
- 5.1.3.3 Japan
- 5.1.3.4 Australia
- 5.1.3.5 Malaysia
- 5.1.3.6 Thailand
- 5.1.3.7 Indonesia
- 5.1.3.8 Vietnam
- 5.1.3.9 Rest of Asia-Pacific
- 5.1.4 Europe
- 5.1.4.1 Germany
- 5.1.4.2 France
- 5.1.4.3 United Kingdom
- 5.1.4.4 Italy
- 5.1.4.5 Spain
- 5.1.4.6 NORDIC
- 5.1.4.7 Turkey
- 5.1.4.8 Russia
- 5.1.4.9 Rest of Europe
- 5.1.5 Middle-East and Africa
- 5.1.5.1 United Arab Emirates
- 5.1.5.2 Saudi Arabia
- 5.1.5.3 Qatar
- 5.1.5.4 South Africa
- 5.1.5.5 Nigeria
- 5.1.5.6 Egypt
- 5.1.1 North America
6 COMPETITIVE LANDSCAPE
- 6.1 Mergers and Acquisitions, Joint Ventures, Collaborations, and Agreements
- 6.2 Strategies Adopted by Leading Players
- 6.3 Company Profiles
- 6.3.1 Antero Resources Corp.
- 6.3.2 Southwestern Energy Company
- 6.3.3 EQT Corporation
- 6.3.4 Equinor ASA
- 6.3.5 Repsol SA
- 6.3.6 China Petroleum & Chemical Corporation (SINOPEC)
- 6.3.7 Chesapeake Energy Corporation
- 6.3.8 Shell PLC
- 6.3.9 Exxon Mobil Corporation
- 6.3.10 Chevron Corporation
- 6.3.11 PetroChina Company Limited
- 6.3.12 ConocoPhillips Company
- 6.3.13 Pioneer Natural Resources
- 6.4 Market Player Ranking
7 MARKET OPPORTUNITIES AND FUTURE TRENDS
- 7.1 Discovery of New Shale Gas Reserves
02-2729-4219
+886-2-2729-4219
 2026年全球页岩气市场报告
 页岩气市场规模、份额及成长分析(按技术、应用及地区划分)-2026-2033年产业预测
 页岩气市场(按开采技术、产品类型、纯度等级和应用)—2025-2032 年全球预测
 2025-2029年全球页岩气市场
 页岩气市场(按技术、应用和地区划分)
 页岩气市场-全球产业规模、份额、趋势、机会及预测(细分领域、按应用、按最终用户、按开采方式、按地区及竞争格局,2020-2030 年预测)
 2032 年页岩气市场预测:按产品类型、技术、应用、最终用户和地区进行的全球分析
 页岩天然气的全球市场:各技术,各用途,各地区,机会,预测,2018年~2032年
 页岩气市场规模、份额、趋势分析报告:按应用、地区、细分市场预测,2025-2030