


 |
市场调查报告书
商品编码
1939028
钽:市场占有率分析、产业趋势与统计、成长预测(2026-2031)Tantalum - Market Share Analysis, Industry Trends & Statistics, Growth Forecasts (2026 - 2031) |
||||||
※ 本网页内容可能与最新版本有所差异。详细情况请与我们联繫。
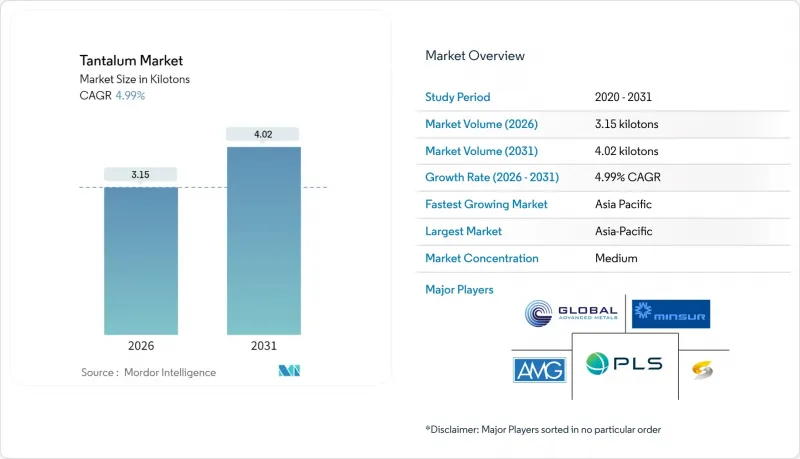
预计钽市场将从 2025 年的 3 千吨增加到 2026 年的 3.15 千吨,到 2031 年将达到 4.02 千吨,2026 年至 2031 年的复合年增长率为 4.99%。
这种成长轨迹反映了其无与伦比的耐腐蚀性、生物相容性和高介电强度,从而支撑了电容器、溅镀靶材、高温合金、植入式医疗设备等领域的强劲需求。电子产品小型化的快速发展、5G部署的加速以及航太发动机生产的稳步推进,持续推动需求成长。同时,澳洲和辛巴威锂伟晶岩矿的共同生产正在缓解结构性供应风险,儘管人们对衝突矿产合规性和现货价格波动的担忧仍然存在。航太和医疗技术原始设备製造商(OEM)继续将供应稳定性置于价格之上,支援长期合约以稳定采购,即便市场交易环境充满不确定性。
全球钽市场趋势与洞察
5G设备对小型钽电容器的需求激增
5G基础设施的进步和行动电话的升级正在加速固体钽晶片电容器的采购,即使在高频开关条件下也能保持电容稳定性。据元件製造商称,与多层陶瓷电容器相比,钽电容器具有更高的体积效率和更低的等效串联电阻(ESR),这对于旗舰智慧型手机和小型基地台基地台台中空间受限的电源管理电路至关重要。钽电容器在-55°C至+175°C的温度范围内均具有可靠性,这使得通讯设备製造商优先考虑钽元件,因为他们优先考虑的是避免现场故障。目前的封装蓝图目标是最小的封装尺寸,小至0201,其中粉末处理的阳极可以在不牺牲机械强度的情况下实现高电容电压比(CV)。钽市场直接受益于轻量化材料日益增长的趋势,而装置小型化则提高了每克材料的使用量。
先进半导体节点对钽溅射靶材的需求
7nm以下的逻辑晶片和DRAM製造製程图规定使用钽和氮化钽扩散隔离层来防止铜扩散,同时保持低线路电阻。极紫外光刻技术将纯度标准提高到99.999%或更高,这使得供应商仅限于拥有超高真空冶金技术的精炼厂。与亚洲主要晶圆代工厂签署的长期供应协议(有效期至2025年)表明,这种前驱体在维持晶圆产量比率的重要性日益凸显。因此,韩国、台湾和中国当地的产能升级正在转化为对高纯度粉末生产商的稳定需求。然而,一旦中非地区的钽精矿供应受到地缘政治动盪的影响,供应紧张的风险仍然存在,这进一步加剧了钽市场对价格稳定性的重视。
衝突矿产合规成本和供应中断
美国和欧盟法规规定的严格实质审查义务要求下游製造商追溯精矿来源,确保其来自非衝突地区的冶炼厂,这增加了审核和认证费用,使成品零件成本增加高达四分之一。中非的小规模生产仍然占据全球供应的很大一部分,而週期性的边境关闭和安全事件可能会在短时间内中断分销。因此,电容器和高温合金供应商持有更大的安全库存,并倾向于签订多年期照付不议合同,以保证即使现货价格下跌也能获得供货。
细分市场分析
2025年,粉末钽市占率占钽市场36.10%,主要得益于电容器阳极材料和溅镀靶材消耗量的快速成长。预计到2031年,粉末钽市场将以5.43%的复合年增长率增长,这主要受粒度细化程度提高带来的对更窄粒度分布和更高比电容需求的推动。金属坯料、线材和板材虽然市场份额仅次于粉末钽,但在需要锻造形状的应用中仍然至关重要,例如化学设备和航太热端部件。硬质合金牌号为优先考虑硬度超过2000 HV的切削刀具和耐磨板製造商提供支持,而合金添加剂则为喷射引擎以高温合金提供支援。
向增材製造技术的转型正在开闢新的成长途径。针对雷射粉末层熔融製程优化的球形粉末能够实现医疗植入中复杂的晶格结构。主要粉末供应商正在扩建其雾化生产线,以提供氧含量低于200 ppm、D50值约为3 µm的粉末,这些规格是骨骼固定笼和颅面网片的理想选择。对形状精度的更严格控制将确保粉末在预测期内继续保持其在钽市场的主导地位。
本钽市场报告按产品类型(金属、碳化物、粉末、合金及其他形态)、纯度类型(<99.95% 和 ≥99.95%)、应用类型(电容器、半导体、发动机涡轮叶片、化工设备等)以及地区(亚太地区、北美地区、欧洲地区、南美地区、发动机涡轮叶片、化学设备等)以及地区(亚太地区、北美地区、欧洲地区、南美地区、中东和非洲地区)进行分析。市场预测以吨为单位。
区域分析
亚太地区在2025年占全球消费量的46.50%,预计到2031年将以5.93%的复合年增长率成长。中国、日本和韩国集中了大量的电容器组装线、储存晶片工厂和显示面板工厂,这些工厂需要消耗粉末和溅射靶材。台湾逻辑晶圆代工厂的扩张增加了对超高纯度金属的需求,而韩国的记忆体製造商正在利用国内研发项目,试点用于DDR6内存模组的钽基MIM(金属-绝缘体-金属)电容器。澳洲作为特定产品供应来源的崛起,增强了区域供应安全,减少了对非洲矿藏的过度依赖,并提高了价值链的韧性。
北美仍然是重要的终端用户区域,其核心产业包括航太、国防和医疗设备。虽然初级矿产开采仅限于加拿大的坦科矿,但强大的二次回收网路可处理高温合金废料和电子废弃物,用于粉末和合金电路应用。美国优先采购衝突矿产的政策维持了价格溢价,并确保了喷射发动机原始设备製造商和心臟节律管理设备製造商的供应量。
欧洲的需求曲线成熟且稳定,其特征是技术标准高、环境法规严格。德国一级汽车供应商推动了对高级驾驶辅助模组电容器的需求,而法国核能设备製造商则指定使用钽衬里用于放射性废弃物处理系统。欧盟的衝突矿产指令收紧了合规预算,但循环经济框架中包含的回收义务正在逐步抵消新增原材料需求。东欧的电容器工厂在满足全部区域可追溯性要求的同时,提供具有成本竞争力的组装。
其他福利:
- Excel格式的市场预测(ME)表
- 3个月的分析师支持
目录
第一章 引言
- 研究假设和市场定义
- 调查范围
第二章调查方法
第三章执行摘要
第四章 市场情势
- 市场概览
- 市场驱动因素
- 5G设备对小型化钽电容器的需求激增
- 先进半导体节点对钽溅射靶材的需求
- 提高超合金喷射发动机零件的产量
- 透过与锂硬岩矿联合生产来增强供应稳定性
- 医用钽涂层(用于神经植入)
- 市场限制
- 衝突矿产合规成本和供应中断
- 不透明交易市场现货价格波动剧烈
- 在ADAS系统中用铌电容器取代钽电容器
- 价值链分析
- 监理政策分析
- 科技趋势
- 波特五力模型
- 供应商的议价能力
- 买方的议价能力
- 新进入者的威胁
- 替代品的威胁
- 竞争对手之间的竞争
- 价格指数
- 进出口趋势
第五章 市场规模与成长预测
- 副产品
- 金属
- 碳化物
- 粉末
- 合金
- 其他形式
- 纯度
- 纯度低于99.95%
- 纯度99.95%或以上
- 透过使用
- 电容器
- 半导体
- 发动机涡轮叶片
- 化学处理设备
- 医疗设备
- 其他用途
- 按地区
- 生产分析
- 我们
- 澳洲
- 巴西
- 中国
- 刚果
- 衣索比亚
- 奈及利亚
- 盧安达
- 其他国家
- 消费分析
- 亚太地区
- 中国
- 印度
- 日本
- 韩国
- 亚太其他地区
- 北美洲
- 我们
- 加拿大
- 墨西哥
- 欧洲
- 德国
- 英国
- 义大利
- 法国
- 其他欧洲地区
- 南美洲
- 巴西
- 阿根廷
- 其他南美洲
- 中东和非洲
- 沙乌地阿拉伯
- 南非
- 其他中东和非洲地区
- 亚太地区
- 生产分析
第六章 竞争情势
- 市场集中度
- 策略趋势
- 市占率(%)/排名分析
- 公司简介
- AMG
- Advanced MaterialsTM, LLC
- CNMC Ningxia Orient Group Co., Ltd
- Energy Transition Minerals Ltd
- F&X Electro-Materials Limited
- Global Advanced Metals Pty Ltd
- Inframat
- Jiujiang Nonferrous Metals Smelting Co., Ltd
- JX Advanced Metals Corporation
- Lorad Chemical Corporation
- Materion Corporation
- Minsur
- Mitsui Mining & Smelting Co., Ltd.
- MPIL
- Pilbara Minerals Limited
- SAJAN OVERSEAS
- Star Earth Minerals Pvt Ltd.
- Taki Chemical Co., Ltd
- Tantalex Lithium Resources
- Ulba Metallurgical Plant
- Ximei Resources Holding Limited
第七章 市场机会与未来展望
The Tantalum market is expected to grow from 3 kilotons in 2025 to 3.15 kilotons in 2026 and is forecast to reach 4.02 kilotons by 2031 at 4.99% CAGR over 2026-2031.
This growth trajectory reflects the metal's unmatched combination of corrosion resistance, biocompatibility, and high dielectric strength that keeps demand resilient across capacitors, sputtering targets, super-alloys, and implantable medical devices. Robust electronics miniaturization, accelerating 5G deployment, and steady aerospace engine build rates remain primary demand catalysts. Parallelly, co-production from lithium pegmatite mines in Australia and Zimbabwe is easing structural supply risk even as concerns over conflict-mineral compliance and spot-price volatility persist. OEMs in aerospace and medical technology continue to prioritize security of supply over price, supporting long-term contracts that stabilize procurement despite the market's opaque trading environment.
Global Tantalum Market Trends and Insights
Surging Demand for Miniaturised Tantalum Capacitors in 5G-Enabled Devices
5G infrastructure densification and handset upgrades are accelerating procurement of solid tantalum chip capacitors that can maintain capacitance stability under high-frequency switching. Component makers report that tantalum capacitors provide superior volumetric efficiency and lower equivalent series resistance than multi-layer ceramic types, features critical for space-constrained power-management circuits in flagship smartphones and small-cell base stations. Reliability across -55 °C to +175 °C temperature excursions makes tantalum devices the preferred choice for telecommunications OEMs keen to avoid field failures. Packaging road-maps now target case sizes as low as 0201, a node where powder-engineered anodes deliver high CV (capacitance-voltage) ratios without sacrificing mechanical integrity. The tantalum market benefits directly as device miniaturization lifts grams-per-unit usage despite broader material-lightweighting trends.
Demand for Tantalum Sputtering Targets in Advanced Semiconductor Nodes
Sub-7 nm logic and DRAM production flow-sheets specify tantalum and tantalum nitride diffusion-barrier layers that prevent copper migration while preserving low line resistance. Extreme ultraviolet lithography raises purity thresholds to 99.999%+, narrowing the supplier base to refiners with ultra-high-vacuum metallurgy capabilities. Long-term offtake agreements signed by leading Asian foundries in 2025 underscore how strategic this precursor has become in maintaining wafer yield. Equipment upgrades in South Korea, Taiwan, and mainland China are therefore translating into steady volumes for high-purity powder producers. Supply tightness remains a possibility whenever geopolitical disruptions affect concentrate flows from Central Africa, reinforcing the tantalum market's tendency to price security at a premium.
Conflict-Mineral Compliance Costs and Supply Disruptions
Stringent due-diligence mandates under U.S. and EU regulations oblige downstream manufacturers to trace concentrate back to conflict-free smelters, adding audit and certification fees that lift finished-component costs by as much as one-quarter. Artisanal production from Central Africa still provides a significant share of global supply, and periodic border closures or security incidents can interrupt flows with little notice. As a result, capacitor and super-alloy suppliers hold larger safety stocks and favor multi-year take-or-pay contracts that lock in volumes even if spot prices ease.
Other drivers and restraints analyzed in the detailed report include:
- Rising Production of Super-Alloy Jet-Engine Components
- Co-Production with Lithium Hard-Rock Mines Enhancing Supply Security
- Niobium Capacitors Replacing Tantalum in ADAS Systems
For complete list of drivers and restraints, kindly check the Table Of Contents.
Segment Analysis
Powder accounted for 36.10% of the tantalum market share in 2025, propelled by surging capacitor anode and sputtering-target consumption. This sub-segment is forecast to post a 5.43% CAGR through 2031 as miniaturization pushes demand for tighter particle-size distributions and higher specific capacitance. Metal billet, wire, and sheet collectively trail powder but remain essential for chemical-processing equipment and aerospace hot-zone components where wrought form factors are mandatory. Carbide grades serve cutting-tool and wear-plate manufacturers who value hardness exceeding 2,000 HV, while alloy additions underpin jet-engine super-alloys.
The shift toward additive manufacturing is opening a parallel growth lane: spherical powder optimized for laser powder-bed fusion enables complex lattice geometries in medical implants. Key powder suppliers scale atomization lines to deliver D50 values near 3 µm with oxygen content below 200 ppm, a specification sweet spot for orthopedic cages and craniofacial meshes. Tight form-factor control will keep powder at the epicenter of the tantalum market during the forecast horizon.
The Tantalum Market Report is Segmented by Product (Metal, Carbide, Powder, Alloys, Other Forms), Purity (Less Than 99. 95% Purity and More Than 99. 95% Purity), Application (Capacitors, Semiconductors, Engine Turbine Blades, Chemical Processing Equipment, and More), and Geography (Asia-Pacific, North America, Europe, South America, and Middle-East and Africa). The Market Forecasts are Provided in Terms of Volume (tons).
Geography Analysis
Asia-Pacific dominated with 46.50% of global consumption in 2025, and the region is forecast to post a 5.93% CAGR through 2031. China, Japan, and South Korea concentrate capacitor assembly lines, memory-chip fabs, and display-panel plants that absorb powder and sputtering targets. Taiwan's logic-foundry expansion amplifies ultra-high-purity demand, while Korean memory producers leverage domestic research programs to trial tantalum-based MIM (metal-insulator-metal) capacitors in DDR6 modules. Australia's rise as a co-product supplier strengthens regional supply security, reducing over-reliance on African concentrates and bolstering value-chain resilience.
North America remains a strategic end-use region anchored by aerospace, defense, and medical device verticals. Although primary mine output is limited to Canada's Tanco operation, a robust secondary recovery network processes super-alloy scrap and electronic waste, feeding powder and alloy circuits. U.S. procurement policies that prioritize conflict-free sourcing sustain price premiums yet secure volume for jet-engine OEMs and cardiac-rhythm-management manufacturers.
Europe exhibits a mature yet stable demand curve, characterized by high engineering standards and stringent environmental regulations. Germany's Tier-1 automotive suppliers drive capacitor off-take for advanced driver-assistance modules, while French nuclear-equipment firms specify tantalum linings for rad-waste systems. The European Union's conflict-minerals directive tightens compliance budgets, but recycling mandates embedded in the circular economy framework gradually offset virgin-material needs. Eastern European capacitor plants offer cost-competitive assembly yet still adhere to region-wide traceability requirements.
- AMG
- Advanced MaterialsTM, LLC
- CNMC Ningxia Orient Group Co., Ltd
- Energy Transition Minerals Ltd
- F&X Electro-Materials Limited
- Global Advanced Metals Pty Ltd
- Inframat
- Jiujiang Nonferrous Metals Smelting Co., Ltd
- JX Advanced Metals Corporation
- Lorad Chemical Corporation
- Materion Corporation
- Minsur
- Mitsui Mining & Smelting Co., Ltd.
- MPIL
- Pilbara Minerals Limited
- SAJAN OVERSEAS
- Star Earth Minerals Pvt Ltd.
- Taki Chemical Co., Ltd
- Tantalex Lithium Resources
- Ulba Metallurgical Plant
- Ximei Resources Holding Limited
Additional Benefits:
- The market estimate (ME) sheet in Excel format
- 3 months of analyst support
TABLE OF CONTENTS
1 Introduction
- 1.1 Study Assumptions and Market Definition
- 1.2 Scope of the Study
2 Research Methodology
3 Executive Summary
4 Market Landscape
- 4.1 Market Overview
- 4.2 Market Drivers
- 4.2.1 Surging demand for miniaturised tantalum capacitors in 5G-enabled devices
- 4.2.2 Demand for tantalum sputtering targets in advanced semiconductor nodes
- 4.2.3 Rising production of super-alloy jet-engine components
- 4.2.4 Co-production with lithium hard-rock mines enhancing supply security
- 4.2.5 Medical-grade tantalum coatings for neuro-implants
- 4.3 Market Restraints
- 4.3.1 Conflict-mineral compliance costs and supply disruptions
- 4.3.2 High spot-price volatility in an opaque trading market
- 4.3.3 Niobium capacitors replacing tantalum in ADAS systems
- 4.4 Value Chain Analysis
- 4.5 Regulatory Policy Analysis
- 4.6 Technological Snapshot
- 4.7 Porter's Five Forces
- 4.7.1 Bargaining Power of Suppliers
- 4.7.2 Bargaining Power of Buyers
- 4.7.3 Threat of New Entrants
- 4.7.4 Threat of Substitutes
- 4.7.5 Competitive Rivalry
- 4.8 Price Index
- 4.9 Import-Export Trends
5 Market Size and Growth Forecasts (Volume)
- 5.1 By Product
- 5.1.1 Metal
- 5.1.2 Carbide
- 5.1.3 Powder
- 5.1.4 Alloys
- 5.1.5 Other Forms
- 5.2 By Purity
- 5.2.1 Less than 99.95% Purity
- 5.2.2 More than 99.95% Purity
- 5.3 By Application
- 5.3.1 Capacitors
- 5.3.2 Semiconductors
- 5.3.3 Engine Turbine Blades
- 5.3.4 Chemical Processing Equipment
- 5.3.5 Medical Equipment
- 5.3.6 Other Applications
- 5.4 By Geography
- 5.4.1 Production Analysis
- 5.4.1.1 United States
- 5.4.1.2 Australia
- 5.4.1.3 Brazil
- 5.4.1.4 China
- 5.4.1.5 Congo
- 5.4.1.6 Ethiopia
- 5.4.1.7 Nigeria
- 5.4.1.8 Rwanda
- 5.4.1.9 Other Countries
- 5.4.2 Consumption Analysis
- 5.4.2.1 Asia-Pacific
- 5.4.2.1.1 China
- 5.4.2.1.2 India
- 5.4.2.1.3 Japan
- 5.4.2.1.4 South Korea
- 5.4.2.1.5 Rest of Asia-Pacific
- 5.4.2.2 North America
- 5.4.2.2.1 United States
- 5.4.2.2.2 Canada
- 5.4.2.2.3 Mexico
- 5.4.2.3 Europe
- 5.4.2.3.1 Germany
- 5.4.2.3.2 United Kingdom
- 5.4.2.3.3 Italy
- 5.4.2.3.4 France
- 5.4.2.3.5 Rest of Europe
- 5.4.2.4 South America
- 5.4.2.4.1 Brazil
- 5.4.2.4.2 Argentina
- 5.4.2.4.3 Rest of South America
- 5.4.2.5 Middle-East and Africa
- 5.4.2.5.1 Saudi Arabia
- 5.4.2.5.2 South Africa
- 5.4.2.5.3 Rest of Middle-East and Africa
- 5.4.2.1 Asia-Pacific
- 5.4.1 Production Analysis
6 Competitive Landscape
- 6.1 Market Concentration
- 6.2 Strategic Moves
- 6.3 Market Share (%)/Ranking Analysis
- 6.4 Company Profiles (includes Global level Overview, Market level overview, Core Segments, Financials as available, Strategic Information, Market Rank/Share for key companies, Products and Services, and Recent Developments)
- 6.4.1 AMG
- 6.4.2 Advanced MaterialsTM, LLC
- 6.4.3 CNMC Ningxia Orient Group Co., Ltd
- 6.4.4 Energy Transition Minerals Ltd
- 6.4.5 F&X Electro-Materials Limited
- 6.4.6 Global Advanced Metals Pty Ltd
- 6.4.7 Inframat
- 6.4.8 Jiujiang Nonferrous Metals Smelting Co., Ltd
- 6.4.9 JX Advanced Metals Corporation
- 6.4.10 Lorad Chemical Corporation
- 6.4.11 Materion Corporation
- 6.4.12 Minsur
- 6.4.13 Mitsui Mining & Smelting Co., Ltd.
- 6.4.14 MPIL
- 6.4.15 Pilbara Minerals Limited
- 6.4.16 SAJAN OVERSEAS
- 6.4.17 Star Earth Minerals Pvt Ltd.
- 6.4.18 Taki Chemical Co., Ltd
- 6.4.19 Tantalex Lithium Resources
- 6.4.20 Ulba Metallurgical Plant
- 6.4.21 Ximei Resources Holding Limited
7 Market Opportunities and Future Outlook
- 7.1 White-space and Unmet-Need Assessment


