


 |
市场调查报告书
商品编码
1639396
美国可再生能源:市场占有率分析、产业趋势与统计、成长预测(2025-2030)United States Renewable Energy - Market Share Analysis, Industry Trends & Statistics, Growth Forecasts (2025 - 2030) |
||||||
价格
※ 本网页内容可能与最新版本有所差异。详细情况请与我们联繫。
简介目录
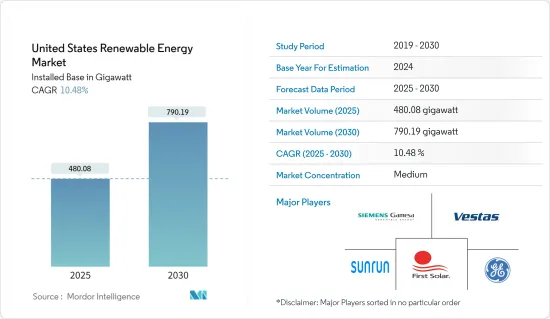
美国可再生能源市场装置规模预计将从2025年的480.08吉瓦成长到2030年的790.19吉瓦,预测期间(2025-2030年)复合年增长率为10.48%。
主要亮点
- 从中期来看,太阳能和风电安装量增加、政府支持措施、太阳能板成本降低以及可再生能源额外补贴等因素将推动预测期内可再生能源市场的发展。
- 同时,蓬勃发展的天然气市场与可再生能源的竞争以及可变再生能源来源的能源供应有限等因素预计将在预测期内抑制美国可再生能源市场。
- 美国政府宣布了一项投资5550亿美元清洁能源项目的框架。预计这将是该国可再生能源市场的机会。
美国可再生能源市场趋势
太阳能正在经历显着成长
- 随着其变得越来越容易获得和普及,美国太阳能产业将在 2023 年达到新的高度。据太阳能产业协会(SEIA)称,美国太阳能产业将在2023年达到一个重要里程碑,新增发电容量达3,240万千瓦。
- 这一成长体现在所有太阳能发电市场领域,全国总设备容量达到约188吉瓦。公用事业规模的产业发挥了关键作用,贡献了 22.5GW 的新增产能,而大约 80 万美国公民在家中安装了太阳能係统。
- 美国的目标是到2025年平均每年安装3000万千瓦的太阳能发电容量,併计划从2025年到2030年将其增加到每年6000万千瓦。这项雄心勃勃的目标预计将迅速发展光伏(PV)市场,到2034年光伏累积设备容量将达到673吉瓦,预计可为超过1亿个住宅供电。
- 支持这项成长的着名计划是 Terra-Gen 和 Mortenson 于 2024 年 1 月推出的 Edwards & Sanborn 太阳能 + 储能计划。这项大型可再生能源专案占地 4,600 英亩,包括 190 万块 First Solar 电池板、875 兆瓦直流 (MWdc) 太阳能容量和约 3.3 吉瓦时 (GWh)能源储存。它还拥有1.3GW的互联容量,使其成为美国最大的。
- 太阳能产业的快速成长得益于政府的有利政策,例如太阳能投资税额扣抵、成本下降以及私营和公共部门对绿能的需求不断增加。
- 例如,2023年6月,美国环保署(EPA)在拜登总统的「投资美国」倡议下发起了70亿美元的津贴竞赛。该计划旨在增加数百万低收入家庭获得廉价、清洁太阳能的机会。由《减少通货膨胀法案》设立的温室气体减排基金资助的「全民太阳能」竞赛将制定和製定计划,为服务不足和低收入人群提供住宅太阳能发电支持。提供最多60 笔赠款。
- 进一步证明了这一势头,2023 年 4 月,维吉尼亚州公司委员会 (SCC) 宣布增加约 20 个太阳能发电和能源储存计划,以满足 Dominion Energy 维吉尼亚客户核准增长的需求。一旦完成,计划将产生超过 800 兆瓦 (MW) 的无碳电力,足以为维吉尼亚州约 20 万户家庭提供运作供电。由于可再生能源不需要燃料,预计消费者在前 10 年可节省超过 2.5 亿美元的汽油费用。
- 因此,预计该领域投资的增加将在预测期内推动美国可再生能源市场的发展。
政府扶持措施促进市场需求
- 税额扣抵、补贴和津贴等政府措施可以显着降低可再生能源部署的初始成本。这些激励措施使可再生能源计划在财务上更加可行并对投资者更具吸引力,从而促进市场成长。
- 例如,美国农业部 (USDA) 于 2023 年 3 月宣布,将从 2023 年 4 月 1 日起开始接受价值 10 亿美元的补助申请。这些补助金专门用于支持农业生产者和农村中小企业投资可再生能源系统并实施能源效率改进。
- 2021年,美国承诺2030年温室气体排放量将比2005年减少50%至52%。美国也承诺到2050年向碳中和经济转型。
- 由于这些支持措施,近年来美国可再生能源装置容量大幅成长。根据美国能源资讯署的数据,可再生能源发电约占总发电量的23%。由于政府对可再生能源进行各种竞标,预计装置容量将进一步增加。
- 例如,2023年6月,内政部土地管理局对内华达州公用事业规模太阳能开发进行了竞标,最高竞标为1.0515亿美元。此次拍卖包括阿马戈萨沙漠中占地 23,675 英亩的四块地块,预计将为电网增加约 3 吉瓦的可再生能源。
- 此外,美国内政部于 2024 年 4 月公布了两项拟议的离岸风力发电竞标,一项位于奥勒冈州州海岸,另一项位于缅因湾。
- 因此,政府的支持措施预计将在预测期内推动美国可再生能源市场的发展。
美国可再生能源产业概况
美国可再生能源市场较为分散。市场的主要企业包括(排名不分先后)维斯塔斯风力系统公司、西门子歌美飒可再生能源公司、通用电气公司、第一太阳能公司和Sunrun公司。
其他好处
- Excel 格式的市场预测 (ME) 表
- 3 个月分析师支持
目录
第一章简介
- 调查范围
- 市场定义
- 研究场所
第 2 章执行摘要
第三章调查方法
第四章市场概况
- 介绍
- 2029年可再生能源装置容量及预测(单位:GW)
- 可再生能源结构 (美国, 2023)
- 最新趋势和发展
- 政府法规和措施
- 市场动态
- 促进因素
- 政府支持措施和奖励
- 环境问题
- 抑制因素
- 石化燃料补贴
- 促进因素
- 供应链分析
- PESTLE分析
第五章 市场区隔(按电源)
- 风力
- 阳光
- 水力发电
- 生质能源
- 其他能源(地热和可再生城市废弃物)
第六章 竞争状况
- 併购、合资、联盟、协议
- 主要企业策略
- 公司简介
- General Electric Company
- First Solar Inc.
- Sunrun Inc.
- NextEra Energy Inc.
- Vestas Wind Systems AS
- Mitsubishi Heavy Industries Ltd
- Siemens Gamesa Renewable Energy SA
- Canadian Solar Inc
- Trina Solar Co. Ltd
- JinkoSolar Holding Co. Ltd
- 市场排名/份额(%)分析
第七章 市场机会及未来趋势
- 整合能源储存技术
简介目录
Product Code: 49226
The United States Renewable Energy Market size in terms of installed base is expected to grow from 480.08 gigawatt in 2025 to 790.19 gigawatt by 2030, at a CAGR of 10.48% during the forecast period (2025-2030).
Key Highlights
- Over the medium term, factors such as increasing solar and wind energy installations, supportive government policies, declining solar panel costs, and additional subsidies on renewables are expected to drive the renewable energy market during the forecast period.
- On the other hand, factors like a booming natural gas market competing with renewable energy and the limited energy supply from variable renewable energy sources are a few factors expected to restrain the US renewable energy market during the forecast period.
- Nevertheless, the US government announced a framework to invest USD 555 billion in funding for clean energy programs. This is expected to be an opportunity for the country's renewable energy market.
United States Renewable Energy Market Trends
Solar Energy to Witness Significant Growth
- The solar power industry in the United States has become increasingly accessible and widespread, reaching new heights in 2023. According to the Solar Energy Industries Association (SEIA), the US solar industry added an impressive 32.4 GW of new electric generating capacity in 2023, marking a significant milestone.
- This growth was observed across all solar market segments, leading to a total installed capacity of around 188 GW nationwide. The utility-scale industry played a crucial role, contributing 22.5 GW of new capacity, while nearly 800,000 US citizens installed solar systems in their homes.
- The United States aims to install an average of 30 GW of solar capacity annually until 2025, with plans to ramp up to 60 GW per year from 2025 to 2030. This ambitious goal is expected to drive rapid development in the solar photovoltaic (PV) market, with cumulative solar installed capacity expected to reach 673 GW by 2034, enough to power over 100 million homes.
- A notable project underscoring this growth is the Edwards & Sanborn Solar + Energy Storage project, launched by Terra-Gen and Mortenson in January 2024. This massive renewable energy endeavor spans 4,600 acres and includes 1.9 million First Solar panels, with a solar capacity of 875 megawatts direct current (MWdc) and nearly 3.3 gigawatt-hours (GWh) of energy storage. It also features a 1.3 GW interconnection capacity, making it the largest in the United States.
- The solar energy industry's rapid growth can be attributed to favorable government policies, such as the Solar Investment Tax Credit, declining costs, and increasing demand for clean electricity across private and public sectors.
- For instance, in June 2023, the US Environmental Protection Agency (EPA) launched a USD 7 billion grant competition under President Biden's Investing in America initiative. This program aims to enhance access to affordable, clean solar energy for millions of low-income households. The Solar for All competition, funded by the Greenhouse Gas Reduction Fund established by the Inflation Reduction Act, will award up to 60 grants to various entities, including states, municipalities, tribal governments, and nonprofit organizations, to develop and expand programs that support residential solar in underserved and low-income communities.
- Further illustrating this momentum, in April 2023, the Virginia State Corporation Commission (SCC) approved almost two dozen additional solar and energy storage projects to help meet the expanding needs of Dominion Energy Virginia customers. When completed, the projects will generate more than 800 megawatts (MW) of carbon-free electricity, which will be enough to power about 200,000 Virginian homes at full capacity. Consumers are expected to save more than USD 250 million in gasoline over the first ten years of operation because renewable energy does not require fuel.
- Therefore, increasing investments in the sector are expected to drive the US renewable energy market during the forecast period.
Supportive Government Policies to Drive Market Demand
- Government policies, such as tax credits, grants, and subsidies, can significantly reduce the upfront costs of renewable energy installations. These incentives make renewable energy projects more financially viable and attractive to investors, driving market growth.
- For instance, in March 2023, the US Department of Agriculture (USDA) revealed that starting from April 1, applications would be accepted for grants worth USD 1 billion. These grants specifically aim to assist agricultural producers and rural small businesses in investing in renewable energy systems and implement energy-efficiency improvements.
- In 2021, the United States committed to achieving a 50% to 52% reduction in greenhouse gas pollution compared to 2005 levels by 2030. The United States has also pledged to transition to a carbon-neutral economy by 2050.
- With these supportive policies, the installed capacities of renewable energy have grown significantly in recent years in the country. According to the US Energy Information Administration, the electricity generated through renewable energy was around 23% of the total electricity generated. This capacity is expected to increase further due to the government's various auctions for renewable energy.
- For instance, in June 2023, under the Department of the Interior, the Bureau of Land Management conducted an auction for utility-scale solar energy development in Nevada, raising USD 105.15 million in top bids. The auction involved four parcels spanning 23,675 acres in the Amargosa Desert, potentially adding nearly 3 GW of renewable energy to the electrical grid.
- Further, in April 2024, the US Department of the Interior revealed two proposed auctions for offshore wind energy development, one off the coast of Oregon and the other in the Gulf of Maine.
- Therefore, supportive government policies are expected to drive the renewable energy market in the United States during the forecast period.
United States Renewable Energy Industry Overview
The US renewable energy market is fragmented. Some of the major players in the market (in no particular order) include Vestas Wind Systems AS, Siemens Gamesa Renewable Energy SA, General Electric Company, First Solar Inc., and Sunrun Inc.
Additional Benefits:
- The market estimate (ME) sheet in Excel format
- 3 months of analyst support
TABLE OF CONTENTS
1 INTRODUCTION
- 1.1 Scope of the Study
- 1.2 Market Definition
- 1.3 Study Assumption
2 EXECUTIVE SUMMARY
3 RESEARCH METHODOLOGY
4 MARKET OVERVIEW
- 4.1 Introduction
- 4.2 Renewable Energy Installed Capacity and Forecast in GW, till 2029
- 4.3 Renewable Energy Mix, United States, 2023
- 4.4 Recent Trends and Developments
- 4.5 Government Policies and Regulations
- 4.6 Market Dynamics
- 4.6.1 Drivers
- 4.6.1.1 Supportive Government Policies and Incentives
- 4.6.1.2 Environmental Concerns
- 4.6.2 Restraints
- 4.6.2.1 Fossil Fuel Subsidies
- 4.6.1 Drivers
- 4.7 Supply Chain Analysis
- 4.8 PESTLE Analysis
5 MARKET SEGMENTATION - BY SOURCE
- 5.1 Wind
- 5.2 Solar
- 5.3 Hydropower
- 5.4 Bioenergy
- 5.5 Other Sources (Geothermal and Renewable Municipal Waste)
6 COMPETITIVE LANDSCAPE
- 6.1 Mergers and Acquisitions, Joint Ventures, Collaborations, and Agreements
- 6.2 Strategies Adopted by Leading Players
- 6.3 Company Profiles
- 6.3.1 General Electric Company
- 6.3.2 First Solar Inc.
- 6.3.3 Sunrun Inc.
- 6.3.4 NextEra Energy Inc.
- 6.3.5 Vestas Wind Systems AS
- 6.3.6 Mitsubishi Heavy Industries Ltd
- 6.3.7 Siemens Gamesa Renewable Energy SA
- 6.3.8 Canadian Solar Inc
- 6.3.9 Trina Solar Co. Ltd
- 6.3.10 JinkoSolar Holding Co. Ltd
- 6.4 Market Ranking/Share(%) Analysis
7 MARKET OPPORTUNITIES AND FUTURE TRENDS
- 7.1 Integration of Energy Storage Technologies


