


 |
市场调查报告书
商品编码
1640316
美国太阳能 -市场占有率分析、行业趋势和统计、成长预测(2025-2030)United States Solar Energy - Market Share Analysis, Industry Trends & Statistics, Growth Forecasts (2025 - 2030) |
||||||
价格
※ 本网页内容可能与最新版本有所差异。详细情况请与我们联繫。
简介目录
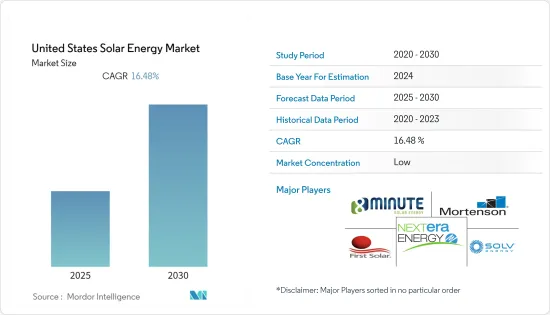
美国太阳能市场预计在预测期内复合年增长率为16.48%
主要亮点
- 从中期来看,太阳能发电成本下降和政府支持措施等因素预计将在预测期内推动美国太阳能市场的发展。
- 另一方面,替代清洁能源来源的日益采用和天然气消费量的增加预计将阻碍预测期内的市场成长。
- 近年来,钙钛矿太阳能电池引起了人们的注意。钙钛矿太阳能电池易于製造、效率高,并表现出优异的半导体行为。因此,太阳能电池的发电效率与晶硅太阳能电池相当。因此,太阳能电池製造技术的进步将带来大规模生产并提供成长机会。
美国太阳能市场趋势
光伏(PV)预计将主导市场
- 太阳能在美国变得越来越容易获得和普及。 2022年太阳能发电年增率与前一年同期比较提高8.3%。过去十年,该国太阳能装机量增加了30倍。 2022年美国总设备容量将达到145,598吉瓦时。
- 美国各地的太阳能市场正在迅速成熟,包括加州、夏威夷州和明尼苏达州在内的几个州已经使太阳能发电在经济上与传统能源来源相比具有竞争力。
- 太阳能光电(PV)市场受到太阳能投资税额扣抵(ITC)等强有力的联邦政策、成本迅速下降以及私营和公共部门对清洁电力需求不断增长的推动。
- 加州拥有美国最高的装置容量。截至 2022 年第二季度,加州太阳能装置容量超过 37 亿吨。德克萨斯州位居第二,约 15 亿吨。 2021 年,美国两州的太阳能发电量增幅最大。
- 根据太阳能产业协会 (SEIA) 的数据,自 2022 年第一季以来,公共规模的太阳能装置量增加了 66%。儘管该领域仍面临供应限制,但随着组件抵达港口,情况正在改善。今年第一季,光电发电占新增产能的54%。今年发电量将继续增加,预计在预测期内将大幅增加。
- 综上所述,光伏(PV)预计将在预测期内主导美国太阳能市场。
太阳能电池板成本下降和效率提高预计将推动市场发展
- 过去十年,全球整体太阳能发电面板的平均成本下降了近90%。自 2011 年以来,其他组件价格也大幅下降,降低了住宅和公共产业太阳能发电的电费(LCOE)。
- 由于技术经济和地缘政治因素的综合作用,太阳能发电面板价格的下降速度预计将略有下降。儘管如此,预计价格在预测期内将继续下跌。
- 根据美国可再生能源实验室(NREL)的数据,自2010年以来,美国住宅、商业屋顶和公用事业太阳能发电系统的公共分别下降了64%、69%和82%。
- 由于价格下降,许多住宅和商业消费者选择屋顶太阳能发电系统来降低能源成本和投资回收时间。同样,对于大型公共产业计划营运商来说,较低的面板成本将使他们能够以较低的价格与消费者签订购电协议(PPA)。
- 在过去的十年中,太阳能发电面板的效率稳步提高。随着新技术和製造能力的出现,这一趋势预计将在预测期内持续下去。市场上最高效的太阳能板效率高达 22.8%,但大多数基板的效率在 16% 到 18% 之间。
- 截至 2022 年 1 月,SunPower 的结晶太阳能发电面板在市场上所有太阳能板品牌中拥有最高的效率评级。此外,根据太阳能产业协会的数据,美国太阳能的价格趋势已从 2012 年的每瓦 4.37 美元下降到 2022 年的每瓦 1.66 美元。
- 因此,鑑于上述方面,太阳能发电面板成本下降和效率提高预计将在预测期内推动该国太阳能市场的发展。
美国太阳能产业概况
美国太阳能市场较分散。主要企业(排名不分先后)包括 MA Mortenson Company、First Solar Inc.、NextEra Energy Inc.、SOLV Energy 和 8minergy Renewables LLC。
其他好处
- Excel 格式的市场预测 (ME) 表
- 3 个月分析师支持
目录
第一章简介
- 调查范围
- 市场定义
- 研究场所
第 2 章执行摘要
第三章调查方法
第四章市场概况
- 介绍
- 美国太阳能装置容量及 2028 年预测(吉瓦 (GW))
- 最新趋势和发展
- 政府法规和措施
- 市场动态
- 促进因素
- 降低太阳能板的成本并提高效率
- 政府对太阳能发电的支持措施
- 抑制因素
- 采用替代清洁能源来源并增加天然气消费量
- 促进因素
- 供应链分析
- PESTLE分析
第五章市场区隔
- 类型
- 太阳能(光伏)
- 聚光型太阳光电(CSP)
第六章 竞争状况
- 合併、收购、联盟和合资企业
- 主要企业策略
- 公司简介
- MA Mortenson Company
- First Solar Inc.
- NextEra Energy Inc.
- SunPower Corporation
- Renewable Energy Systems Ltd
- Rosendin Electric Inc.
- Hanwha Corporation
- Canadian Solar Inc.
- JinkoSolar Holding Co. Ltd
- SOLV Energy
- 8minute Solar Energy
第七章 市场机会及未来趋势
- 光电电池製造技术进步
简介目录
Product Code: 51293
The United States Solar Energy Market is expected to register a CAGR of 16.48% during the forecast period.
Key Highlights
- Over the medium term, factors such as declining solar PV costs and supportive government policies are expected to drive the United States solar energy market during the forecast period.
- On the other hand, increasing adoption of alternative clean energy sources and increasing natural gas consumption are expected to hinder the market's growth during the forecast period.
- Nevertheless, Perovskite-based cells attracted attention in recent years. Perovskite-based PV cells offer high ease of manufacturing, high efficiency, and excellent semiconducting behaviour. Hence, they are comparable to silicon-based solar PV regarding solar-to-electric efficiency. Hence, technological advancements in manufacturing PV cells will likely lead to mass-scale production, offering growth opportunities.
US Solar Energy Market Trends
Solar Photovoltaic (PV) Expected to Dominate the Market
- Solar power has become more accessible and prevalent in the United States. Solar experienced an annual growth rate of 8.3% in 2022 compared to the previous year. Over the last decade, solar installations in the country have grown 30-fold. The total installed capacity in the United States reached 145,598 gigawatt-hours in 2022.
- The solar energy markets are maturing rapidly around the country, and solar electricity is now economically competitive with conventional energy sources in several states, including California, Hawaii, and Minnesota.
- The solar photovoltaic (PV) market is mainly driven by strong federal policies, such as the solar Investment Tax Credit (ITC), rapidly declining costs, and increasing demand for clean electricity across the private and public sectors.
- California has by far the most installed capacity of solar photovoltaic (PV) power of any state in the United States. The Golden State had a total solar power capacity of over 37 gigatonnes as of the second quarter of 2022. Texas came in second with a capacity of about 15 gigatonnes. In 2021, both states in the United States added the most solar PV capacity.
- According to the Solar Energy Industries Association (SEIA), Utility-scale solar installations increased 66% from the first quarter of 2022. The sector is still experiencing supply constraints, but things are improving as module shipments arrive at ports. In the first quarter of this year, photovoltaic solar (PV) accounted for 54% of all new electricity-generating capacity additions. The capacity is expected to increase this year and continue to surge significantly during the forecast period.
- Hence, owing to the points mentioned above, solar photovoltaic (PV) is expected to dominate the US soar energy market during the forecast period.
Declining Costs and Increasing Efficiencies of Solar Panels Expected to Drive the Market
- Since the last decade, the average cost of a solar PV panel has dropped by nearly 90% globally. Prices of other components have also fallen significantly since 2011, reducing the Levelized Cost of Electricity (LCOE) for residential and utility-scale solar PV generation.
- Due to a combination of techno-economic and geopolitical factors, the rate of decline of solar PV panel prices is estimated to reduce slightly. Still, prices will continue to decline during the forecast period.
- According to the United States National Renewable Energy Laboratory (NREL), since 2010, there has been a 64%, 69%, and 82% reduction in the cost of residential, commercial-rooftop, and utility-scale PV systems in the United States, respectively.
- Due to the declining prices, many residential and commercial consumers are opting for rooftop solar PV systems to reduce energy costs and recovery time. Similarly, for large-scale utility project operators, lower panel costs enable them to sign Power Purchase Agreements (PPA) with consumers at a lower price.
- Over the past decade, the efficiency of solar PV panels has risen steadily. With the emergence of new technologies and manufacturing capabilities, this trend is expected to continue during the forecast period. The most efficient solar panels commercially available in the market have efficiency ratings as high as 22.8%, whereas most boards have an efficiency rating ranging from 16% to 18%.
- As of January 2022, SunPower's monocrystalline solar PV panels had the highest efficiency rating of any commercially available solar panel brand. Additionally, according to Solar Energy Industries Association, the U.S. Solar PV Pricing Trend dropped from USD 4.37 per watt in 2012 to USD 1.66 per watt in 2022 for the commercial segment.
- Therefore, owing to the above-mentioned points, declining costs and increasing efficiencies of solar PV panels are expected to drive the country's solar energy market during the forecast period.
US Solar Energy Industry Overview
The United States solar energy market is fragmented. Some of the key players (in no particular order) include M. A. Mortenson Company, First Solar Inc., NextEra Energy Inc., SOLV Energy, and 8minutenergy Renewables LLC.
Additional Benefits:
- The market estimate (ME) sheet in Excel format
- 3 months of analyst support
TABLE OF CONTENTS
1 INTRODUCTION
- 1.1 Scope of the Study
- 1.2 Market Definition
- 1.3 Study Assumptions
2 EXECUTIVE SUMMARY
3 RESEARCH METHODOLOGY
4 MARKET OVERVIEW
- 4.1 Introduction
- 4.2 United States Solar Energy Installed Capacity and Forecast in Gigawatt (GW), till 2028
- 4.3 Recent Trends and Developments
- 4.4 Government Policies and Regulations
- 4.5 Market Dynamics
- 4.5.1 Drivers
- 4.5.1.1 Declining Costs and Increasing Efficiencies of Solar PV Panels
- 4.5.1.2 Supportive Government Policies Towards Solar
- 4.5.2 Restraints
- 4.5.2.1 Increasing Adoption of Alternative Clean Energy Sources and Increasing Natural Gas Consumption
- 4.5.1 Drivers
- 4.6 Supply Chain Analysis
- 4.7 PESTLE Analysis
5 MARKET SEGMENTATION
- 5.1 Type
- 5.1.1 Solar Photovoltaic (PV)
- 5.1.2 Concentrated Solar Power (CSP)
6 COMPETITIVE LANDSCAPE
- 6.1 Mergers, Acquisitions, Collaborations, and Joint Ventures
- 6.2 Strategies Adopted by Key Players
- 6.3 Company Profiles
- 6.3.1 M. A. Mortenson Company
- 6.3.2 First Solar Inc.
- 6.3.3 NextEra Energy Inc.
- 6.3.4 SunPower Corporation
- 6.3.5 Renewable Energy Systems Ltd
- 6.3.6 Rosendin Electric Inc.
- 6.3.7 Hanwha Corporation
- 6.3.8 Canadian Solar Inc.
- 6.3.9 JinkoSolar Holding Co. Ltd
- 6.3.10 SOLV Energy
- 6.3.11 8minute Solar Energy
7 MARKET OPPORTUNITIES AND FUTURE TRENDS
- 7.1 Technological Advancements in Manufacturing PV Cells
02-2729-4219
+886-2-2729-4219
 太阳能係统市场(按产品类型、系统规模、安装类型和最终用途应用)—2025-2032 年全球预测
 太阳能设备的全球市场(2025年):产品,终端用户竞争:分析,预测,机会
 全球太阳能係统市场分析与预测(至 2034 年):类型、产品、服务、技术、组件、应用、安装类型、最终用户、功能和设备
 气候意识产品市场,依产品类型、类别、应用、国家及地区划分-2025 年至 2032 年全球产业分析、市场规模、市场份额及预测
 2025年併网太阳能市场报告太阳能 EPC(工程、采购和施工)市场(按服务类型、太阳能技术、追踪器类型、容量、安装类型和最终用途)—2025-2030 年全球预测太阳能电池电镀线市场(按电池技术、电镀工艺类型、电镀材质、材料类型和应用)—2025-2030 年全球预测全球太阳能板监控系统市场
 太阳能光伏发电的全球市场的展望:2025年第3季 - 资料全球商业和工业太阳能光电模组市场
▼