


 |
市场调查报告书
商品编码
1640507
生物固形物-市场占有率分析、产业趋势与统计、成长预测(2025-2030 年)Biosolids - Market Share Analysis, Industry Trends & Statistics, Growth Forecasts (2025 - 2030) |
||||||
※ 本网页内容可能与最新版本有所差异。详细情况请与我们联繫。
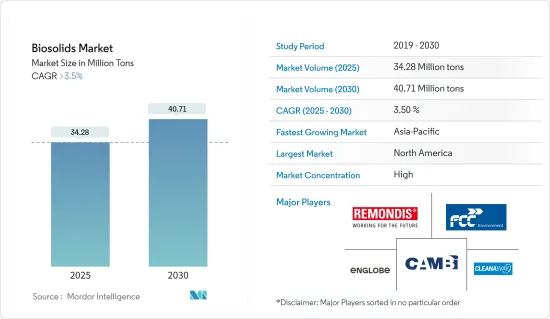
预计 2025 年生物固形物市场规模将达到 3,428 万吨,预计 2030 年将达到 4,071 万吨,预测期内(2025-2030 年)的复合年增长率将超过 3.5%。
COVID-19 疫情对 2020 年的生物固形物市场产生了负面影响。但自疫情爆发以来,农田对生物固形物的需求不断增长,有助于推动整个产业的成长。
关键亮点
- 推动市场发展的主要因素之一是需要替代危险化学肥料和世界各地严格的排放法规。
- 另一方面,公众中关于生物固形物的相互矛盾的资讯预计会减缓所研究市场的成长。
- 亚太地区(主要是中国和印度)对污泥处理的日益关注预计将很快为工业成长提供新的途径。
- 由于政府和公众对环保技术的支持,北美在生物固形物市场占据主导地位。
生物固形物市场趋势
农业用地占市场主导地位
- 生物固形物可用于农田、森林、牧场或需要掩埋的受干扰土地。
- 就消费量而言,农业用地消耗的生物固形物最多。预计亚太地区和北美地区人口持续成长将增加对农业产量的需求,这可能对该领域的生物固形物消费产生正面影响。
- 根据国际谷物理事会预测,2021-2022年世界谷物总产量约22.94亿吨,比上年度增加约3.05%。此外,该理事会预测,2022-2023年世界粮食总产量将下降至22.67亿吨。但预计 2023-2024 年将达到 2,310 吨。
- 中国粮食产量约占全球总产量的7%,养活了全球22%的人口。该国是水稻、棉花、马铃薯和其他作物的最大生产国。
- 根据农业和农民福利部第三次农作物产量预测,预计 2022-23 年该国粮食总产量将从 3.556 亿吨增加到 3.305 亿吨。
- 科学家和农民正在寻求新技术来提高作物产量并满足人口过度增长造成的粮食需求。此外,在美国等国家,可用耕地面积在过去十年中有所减少。
- 生物固形物可以作为肥料和土壤改良剂有效地用于人类作物生产。通常使用传统的农业设备生物固形物施用于土壤。它也可用作牲畜肥料。
- 大公司和农业专家正在牲畜和肉品领域展现出自己的影响力。他们对畜牧业生产的需求不断增加,这是使用生物固形物作为畜牧业生产肥料的驱动力。这导致农业用地对生物固形物的需求增加。
- 生物固形物也有助于降低肥料成本并提供作物生长所需的更多微量营养素。由于全球人口的成长,农业需求预计会增加,这可能会影响生物固形物在农业领域的使用。
- 因此,预计预测期内农业用地将占据市场主导地位。
北美占据市场主导地位
- 由于美国和加拿大等国家的政府和公众对绿色技术的支持,北美占据了市场主导地位。
- 在美国,生物固形物市场很大程度上受到政府和公众使用环保技术的愿望的推动。
- 美国环保署(EPA)采用「生物固形物」这个名称来区分高品质的污水处理污泥与含有大量污染物的原污泥。
- 污水中无法再利用的生物固形物可以被处理掉(例如在垃圾掩埋场)或充分利用(例如沼气或带有能源回收的垃圾掩埋)。
- 生物固形物是在污水处理过程中产生的,被广泛用于满足美国环保署 40 CFR Part 503 的规定。
- 目前国内产生的生物固形物大多是 EQ 或 PC生物固形物,其中含有少量污染物。全国产生约一半的生物固形物被有益地用于土壤改良。
- 在美国,生物固形物被回收或用作肥料,以改善和维持土壤肥力并促进植物生长。透过处理污水污泥,生物固形物被用作有价值的肥料,而不是占用垃圾掩埋场和其他处置场所的空间。大约一半的生物固形物被回收到土地上。
- 随着美国人口的增长,对食物的需求也迅速增长。 2022年,美国家庭平均食品支出将增加约12.72%,达9,343美元。
- 预计农业部门的不断增长将进一步促进生物固形物的消费。 2022年,农业及相关产业对美国国内生产总值(GDP)的贡献约为5.5%。
- 因此,由于上述因素,预计北美将在预测期内占据最大的市场占有率。
生物固形物市场产业概况
生物固形物市场已部分整合。主要企业(不分先后顺序)包括 REMONDIS SE &Co.KG、Cambi ASA、FCC Group、Englobe 和 Cleanaway。
其他福利
- Excel 格式的市场预测 (ME) 表
- 3 个月的分析师支持
目录
第 1 章 简介
- 调查前提条件
- 研究范围
第二章调查方法
第三章执行摘要
第四章 市场动态
- 驱动程式
- 替代北美的有毒化学肥料
- 严格的政府排放法规
- 其他驱动因素
- 限制因素
- 缺乏对生物固形物的正确知识与认识
- 其他限制因素
- 产业价值链分析
- 波特五力分析
- 供应商的议价能力
- 消费者议价能力
- 新进入者的威胁
- 替代品的威胁
- 竞争程度
第五章 市场区隔(市场规模(基于数量))
- 类型
- A 类
- A 类 EQ(卓越品质)
- B 类
- 形式
- 蛋糕
- 液体
- 颗粒
- 应用
- 农业土地利用
- 用于人类作物生产的肥料/土壤改良剂
- 牲畜肥料 - 牧场
- 非农业用地
- 林业作物(土地恢復与林业)
- 土地掩埋(道路与城市湿地)
- 旧矿场掩埋
- 景观美化、休閒区、家庭用途
- 能源回收生产
- 产热、焚烧、气化
- 石油和水泥生产
- 商业用途
- 农业土地利用
- 地区
- 亚太地区
- 中国
- 印度
- 日本
- 韩国
- 马来西亚
- 泰国
- 印尼
- 越南
- 其他亚太地区
- 北美洲
- 美国
- 加拿大
- 墨西哥
- 欧洲
- 德国
- 英国
- 义大利
- 法国
- 西班牙
- 北欧的
- 土耳其
- 俄罗斯
- 欧洲其他地区
- 南美洲
- 巴西
- 阿根廷
- 哥伦比亚
- 南美洲其他地区
- 中东和非洲
- 沙乌地阿拉伯
- 南非
- 奈及利亚
- 卡达
- 埃及
- 阿拉伯聯合大公国
- 其他中东和非洲地区
- 亚太地区
第六章 竞争格局
- 併购、合资、合作、协议
- 市场占有率分析
- 主要企业策略
- 公司简介
- Agrivert Ltd
- Aguas Andinas SA
- Alan Srl
- Allevi Srl
- BCR Environmental
- CRE-Centro di Ricerche Ecologiche
- Cambi ASA
- Casella Waste Systems Inc.
- Cleanaway
- DC Water
- Eco-trass
- Englobe
- FCC Group
- Lystek International
- Merrell Bros. Inc.
- Parker Ag Services LLC
- Recyc Systems Inc.
- REMONDIS SE & Co. KG
- Saur
- SYLVIS
- Synagro Technologies
- Terrapure BR Ltd
- Walker Industries
第七章 市场机会与未来趋势
- 亚太地区对污泥处理的关注度日益提高
- 其他机会
The Biosolids Market size is estimated at 34.28 million tons in 2025, and is expected to reach 40.71 million tons by 2030, at a CAGR of greater than 3.5% during the forecast period (2025-2030).
The COVID-19 pandemic negatively affected the biosolids market in 2020. However, the growing demand for biosolids on agricultural land has fueled overall industry growth since the pandemic.
Key Highlights
- One of the main things driving the market that was looked at is the need to replace dangerous chemical fertilizers and strict emission laws in many countries around the world.
- On the other hand, contradictory information about biosolids that is available to the public is expected to slow the growth of the market studied.
- The rising focus on sludge treatment in the Asia-Pacific, mainly in China and India, is anticipated to offer new avenues for industry growth shortly.
- North America dominated the biosolids market due to government and public support for environmental-friendly technologies.
Biosolids Market Trends
Agricultural Land Application to Dominate the Market
- Biosolids can be used on agricultural land, in forests, on rangelands, or in disturbed land needing reclamation.
- In terms of consumption, agricultural land applications consume the most biosolids. Consistent population growth across Asia-Pacific and North America is expected to augment the need for agricultural yields, which may positively affect the consumption of biosolids in the sector.
- According to the International Grains Council, in FY 2021-2022, the total grain production globally was about 2,294 million metric tons, about 3.05% more than the previous year. Furthermore, as per the council's estimation in FY 2022-2023, the total global grain production will decrease to 2,267 million metric tons. However, it is anticipated to reach 2,310 in FY 2023-2024.
- China accounts for about 7% of the overall crop production globally, thus feeding 22% of the world's population. The country is the largest producer of different crops, including rice, cotton, potatoes, and other crops.
- According to the Third Advance Estimates for crop production by the Ministry of Agriculture and Farmers Welfare, total foodgrain production in the country in 2022-23 was valued at 330.5 million tonnes (MT) from 315.6 MT.
- Scientists and farmers are looking for new technologies to increase the productivity of crops and meet the food demand arising from disproportionate population growth. In addition, there has been a decrease in the total available cropland area in countries such as the United States over the last decade.
- Biosolids can be effectively used as fertilizers and soil conditioners for human crop production. These are usually incorporated into the soil with conventional farm equipment. They are also used as fertilizer for animal crop production.
- Big enterprises and farmers are increasingly making their presence felt in cattle farming and meat products. They are augmenting the demand for animal crop production, which is providing impetus to the application of biosolids as fertilizers for animal crop production. This has led to an increase in demand for biosolids in agricultural land applications.
- They also help reduce fertilizer costs and provide many micronutrients for crop growth. The increasing world population is expected to give rise to a growing need for agriculture, which may impact the use of biosolids in the sector.
- Hence, agricultural land application is expected to dominate the market studied during the forecast period.
North America to Dominate the Market
- North America dominated the market owing to the government and public support for environmental-friendly technologies in countries such as the United States and Canada.
- In the United States, the biosolids market is mostly driven by the fact that both the government and the public want to use technologies that are good for the environment.
- The US EPA adopted the name "biosolids" to differentiate high-quality treated sewage sludge from raw sewage sludge, which contains large amounts of pollutants.
- There are two ways to get rid of biosolids from wastewater that cannot be used again (like putting them in a landfill) and ways to use them in a good way (like landfilling with biogas and energy recovery).
- Biosolids are generated during wastewater treatment processes and are extensively used to satisfy the US EPA's 40 CFR Part 503 regulations.
- The majority of the biosolids that are currently generated in the country are expected to be EQ or PC biosolids containing low levels of pollutants. About half of the biosolids produced in the country are being beneficially used to improve soils.
- In the United States, biosolids are either recycled or applied as fertilizer to improve and maintain productive soils and stimulate plant growth. By treating sewage sludge, the biosolids are used as valuable fertilizer instead of taking up space in a landfill or other disposal facility. Approximately half of all biosolids are recycled to land.
- The demand for food is growing rapidly with the rising population in the United States. In 2022, the average household spending in the United States on food increased by about 12.72% and was valued at USD 9,343.
- The rising agriculture sector is expected to further boost the consumption of biosolids. Agriculture and related industries contributed to about 5.5% of the US gross domestic product (GDP) in 2022.
- Therefore, due to the above factors, North America is anticipated to have the largest market share during the forecast period.
Biosolids Market Industry Overview
The biosolids market is partially consolidated in nature. The major players (not in any particular order) include REMONDIS SE & Co. KG, Cambi ASA, FCC Group, Englobe, and Cleanaway, among others.
Additional Benefits:
- The market estimate (ME) sheet in Excel format
- 3 months of analyst support
TABLE OF CONTENTS
1 INTRODUCTION
- 1.1 Study Assumptions
- 1.2 Scope of the Study
2 RESEARCH METHODOLOGY
3 EXECUTIVE SUMMARY
4 MARKET DYNAMICS
- 4.1 Drivers
- 4.1.1 Replacing Hazardous Chemical Fertilizers in North America
- 4.1.2 Stringent Government Emission Laws
- 4.1.3 Other Drivers
- 4.2 Restraints
- 4.2.1 Lack of Proper Knowledge and Awareness on Biosolids
- 4.2.2 Other Restraints
- 4.3 Industry Value Chain Analysis
- 4.4 Porter's Five Forces Analysis
- 4.4.1 Bargaining Power of Suppliers
- 4.4.2 Bargaining Power of Consumers
- 4.4.3 Threat of New Entrants
- 4.4.4 Threat of Substitute Products and Services
- 4.4.5 Degree of Competition
5 MARKET SEGMENTATION (Market Size in Volume)
- 5.1 Type
- 5.1.1 Class A
- 5.1.2 Class A EQ (Exceptional Quality)
- 5.1.3 Class B
- 5.2 Form
- 5.2.1 Cakes
- 5.2.2 Liquid
- 5.2.3 Pellet
- 5.3 Application
- 5.3.1 Agriculture land Application
- 5.3.1.1 Fertilizer/Soil Conditioner for Human Crop Production
- 5.3.1.2 Fertilizer for Animal Crop Production - Pastures
- 5.3.2 Non-agricultural Land Application
- 5.3.2.1 Forest Crops (Land Restoration and Forestry)
- 5.3.2.2 Land Reclamation (Roads and Urban Wetlands)
- 5.3.2.3 Reclaiming Mining Sites
- 5.3.2.4 Landscaping, Recreational Fields, and Domestic Use
- 5.3.3 Energy Recovery Energy Production
- 5.3.3.1 Heat Generation, Incineration, and Gasification
- 5.3.3.2 Oil and Cement Production
- 5.3.3.3 Commercial Uses
- 5.3.1 Agriculture land Application
- 5.4 Geography
- 5.4.1 Asia-Pacific
- 5.4.1.1 China
- 5.4.1.2 India
- 5.4.1.3 Japan
- 5.4.1.4 South Korea
- 5.4.1.5 Malaysia
- 5.4.1.6 Thailand
- 5.4.1.7 Indonesia
- 5.4.1.8 Vietnam
- 5.4.1.9 Rest of Asia-Pacific
- 5.4.2 North America
- 5.4.2.1 United States
- 5.4.2.2 Canada
- 5.4.2.3 Mexico
- 5.4.3 Europe
- 5.4.3.1 Germany
- 5.4.3.2 United Kingdom
- 5.4.3.3 Italy
- 5.4.3.4 France
- 5.4.3.5 Spain
- 5.4.3.6 NORDIC
- 5.4.3.7 Turkey
- 5.4.3.8 Russia
- 5.4.3.9 Rest of Europe
- 5.4.4 South America
- 5.4.4.1 Brazil
- 5.4.4.2 Argentina
- 5.4.4.3 Colombia
- 5.4.4.4 Rest of South America
- 5.4.5 Middle East and Africa
- 5.4.5.1 Saudi Arabia
- 5.4.5.2 South Africa
- 5.4.5.3 Nigeria
- 5.4.5.4 Qatar
- 5.4.5.5 Egypt
- 5.4.5.6 United Arab Emirates
- 5.4.5.7 Rest of Middle East and Africa
- 5.4.1 Asia-Pacific
6 COMPETITIVE LANDSCAPE
- 6.1 Mergers and Acquisitions, Joint Ventures, Collaborations, and Agreements
- 6.2 Market Share Analysis
- 6.3 Strategies Adopted by Leading Players
- 6.4 Company Profiles
- 6.4.1 Agrivert Ltd
- 6.4.2 Aguas Andinas SA
- 6.4.3 Alan Srl
- 6.4.4 Allevi Srl
- 6.4.5 BCR Environmental
- 6.4.6 C.R.E. - Centro di Ricerche Ecologiche
- 6.4.7 Cambi ASA
- 6.4.8 Casella Waste Systems Inc.
- 6.4.9 Cleanaway
- 6.4.10 DC Water
- 6.4.11 Eco-trass
- 6.4.12 Englobe
- 6.4.13 FCC Group
- 6.4.14 Lystek International
- 6.4.15 Merrell Bros. Inc.
- 6.4.16 Parker Ag Services LLC
- 6.4.17 Recyc Systems Inc.
- 6.4.18 REMONDIS SE & Co. KG
- 6.4.19 Saur
- 6.4.20 SYLVIS
- 6.4.21 Synagro Technologies
- 6.4.22 Terrapure BR Ltd
- 6.4.23 Walker Industries
7 MARKET OPPORTUNITIES AND FUTURE TRENDS
- 7.1 Increasing Focus on Sludge Treatment in Asia-Pacific
- 7.2 Other Opportunities


