


 |
市场调查报告书
商品编码
1644271
地下公共事业测绘:市场占有率分析、产业趋势与统计、成长预测(2025-2030 年)Underground Utility Mapping - Market Share Analysis, Industry Trends & Statistics, Growth Forecasts (2025 - 2030) |
||||||
※ 本网页内容可能与最新版本有所差异。详细情况请与我们联繫。
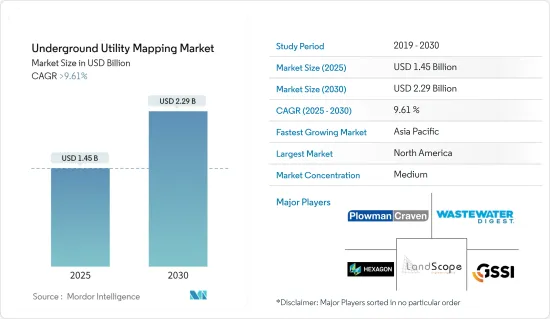
地下公共事业测绘市场规模预计在 2025 年将达到 14.5 亿美元,预计到 2030 年将达到 22.9 亿美元,预测期内(2025-2030 年)的复合年增长率将超过 9.61%。
推动地下公共事业测绘市场发展的两个主要因素是经济活动的活性化(尤其是在新兴市场)以及政府维护地下公用设施的措施增加。
主要亮点
- 近年来,地下公共事业工程 (SUE) 产业一直走在前沿,为地下公共事业基础设施测绘挑战创造了创新解决方案。透过将电磁定位器和透地雷达等地球物理技术与历史记录等非技术方法相结合,该行业可以彙编地下基础设施的综合资料集。
- 此外,世界经济论坛(WEF)预测,到2030年,全球对城市灰色基础设施的投资将激增至10,5,480亿美元。如此巨大的城市发展投资为地下公共事业测绘市场提供了巨大的成长机会。
- 随着都市化进程的加速,全球智慧城市趋势也愈发强劲。联合国预测,到2050年,印度城市人口将增加4.04亿,中国将增加2.92亿,奈及利亚将增加2.12亿。
- 同时,新兴大陆拉丁美洲的都市化最为迅速。全球各地众多智慧城市计划如火如荼地进行,国际投资也不断涌入。经济合作暨发展组织(OECD)估计,2010年至2030年间,全球对智慧城市计画(包括所有主要城市基础设施计划)的投资将达到近1.8兆美元。智慧城市发展的激增将增加地下公共事业地图市场的需求。
- 基础设施规划在城市发展中常常被忽视,但对于复杂设施的无缝运作至关重要。这项工作中的一个重要工具是 3D公共事业地图,它可以提供一个区域及其公共事业的3D观点。该方法可以捕获地下资料,例如用水和污水和煤气管道以及结构图和电线。借助详细的 3D公共事业地图和概念场地模型 (CSM),规划人员可以快速识别挑战并设计出有效的解决方案。
- 透过将新技术与公共事业地图结合,地下公共事业地图市场正在转变。这些进展将提高探勘活动的准确性、效率和安全性。因此,探勘团队能够更好地应对与地下基础设施相关的挑战,简化路线并降低风险,从而推动市场成长并激发创新。
- 透地雷达(GPR) 非常适合精确定位目标的水平位置,但各种因素都会影响深度测量的速度和准确性。土壤类型和水分含量极为重要。例如,沙土和粘土等难以处理的土壤会减慢雷达讯号。潮湿的材料进一步影响讯号速度。因此,确定不同材料中 GPR 讯号的确切速度是一项挑战,但估计的准确度通常在 90% 左右。
地下公共事业测绘市场趋势
透地雷达有望成为最大的组件解决方案
- 透地雷达(GPR) 是公共事业测绘的最佳选择,它发射 MHz 和 GHz 范围内的定向电磁波。透过分析这些讯号回波,GPR 可以精确定位地下公共事业基础设施的位置。
- GPR 技术擅长识别金属和非金属公共事业。快速的资料收集、经济高效和高解析度影像使其成为公共事业测量员进行公共事业测绘调查的首选。
- 除了公共事业测绘之外,GPR 还可以作为评估水泥建筑物的非破坏性工具,揭示钢筋位置、板厚度以及空隙和管道的存在。这种非侵入性方法不仅可以确保准确的结果,而且还最大限度地减少对正在进行的施工计划的干扰。
- 为了前瞻性起见,无人机製造商正在生产具有 GPR 功能的无人机,以便更好地探测地下公共,这预示着一个蓬勃发展的市场机会。
- 随着天然气管道的扩大,精确测绘和监测的需求也随之增加。地面穿透技术在定位、识别和评估管道状况以及保护周围环境方面发挥着至关重要的作用。截至 2024 年 2 月,GGON资料突显了中国在全球天然气管道中的主导地位。目前,中国管道网路已运作中442 条管道,另有 302 条规划或正在建设中,为全球 1,500 多条运作中天然气管道做出了重要贡献。
北美占有最大市场占有率
- 北美快速的都市化和人口成长给现有的基础设施系统带来了压力,增加了对地下公共事业测绘服务的需求。都市区复杂且密集,需要精确测绘以防止施工期间损坏地下设施。
- 根据国家地下资产登记咨询小组的报告,定位地下资产的挑战每年对美国经济造成约 500 亿美元的损失。在过去 20 年里,该问题还导致 1,500 多人受伤,近 400 人死亡。此外,地下公共事业测绘不准确也是造成高速公路建设延误的重要原因。这些不确定性正在推动该地区采用基于先进技术的解决方案。
- 北美许多城市和市政当局正在投资智慧城市计画。这些措施旨在利用科技更好地管理基础设施,增强公共服务并优化资源配置。其中,地下公共事业测绘发挥着至关重要的作用,为基础设施资产管理和规划提供重要资料。
- 该地区正在努力开发有关地下公用设施的资料共用方法,特别是在施工期间捕获的资料。一个值得注意的例子是芝加哥市的试点项目,该项目引入了 3D 地铁地图的资料收集和共用平台。
- 区域参与者越来越多地采用无机成长策略来抢占更大的市场占有率,从而进一步推动该领域的成长。此外,该地区的许多公共工程部门正在使用 GIS 技术来帮助定位地下设施。
地下公共事业测绘产业概况
地下公共事业测绘市场呈现半固体,其特点是大型跨国公司和许多小型企业共存。影响市场的关键参与者是 Hexagon AB、GSSI Geophysical Survey Systems Inc.、LandScope Engineering Ltd.、Plowman Craven Limited、Geospatial Corporation 等。这些参与者正在策略性地利用伙伴关係和收购来增强其产品供应并确保竞争优势。
例如,2024年4月,地下埋藏物损害防治知名公司USIC,LLC(以下简称「USIC」)与美国「合作伙伴助力您的成功」(PaYS)计画正式达成合作关係。该倡议为美国军人提供了报效祖国的机会,同时也为他们退休后的职业生涯做好了准备。伙伴关係签约仪式在USIC总部举行,活动由印第安纳州陆军国民警卫队新兵保留营主办。作为经过认证的 PaYS 合作伙伴,USIC 致力于为士兵在陆军服役期满后提供面试和就业机会。这项战略伙伴关係不仅有利于士兵顺利过渡到平民生活,也凸显了美国致力于与企业界建立牢固关係的决心。
其他福利:
- Excel 格式的市场预测 (ME) 表
- 3 个月的分析师支持
目录
第 1 章 简介
- 研究假设和市场定义
- 研究范围
第二章调查方法
第三章执行摘要
第四章 市场洞察
- 市场概况
- 产业吸引力-波特五力分析
- 新进入者的威胁
- 购买者/消费者的议价能力
- 供应商的议价能力
- 替代品的威胁
- 竞争对手之间的竞争
第五章 市场动态
- 市场驱动因素
- 新技术与公共事业地图相结合以改善探勘活动
- 提高发现应用程式的可用性并提高行销支出的回报
- 市场挑战
- 测绘工具维护成本高
6. COVID-19 对地下公共事业测绘市场的影响
第七章 市场区隔
- 按组件类型
- 解决方案
- 透地雷达
- 电磁定位器
- 其他解决方案
- 服务
- 解决方案
- 按最终用户产业
- 公共
- 石油和天然气
- 建筑和施工
- 通讯业
- 电
- 其他最终用户产业
- 按地区
- 北美洲
- 欧洲
- 亚洲
- 澳洲和纽西兰
- 拉丁美洲
- 中东和非洲
第八章 竞争格局
- 公司简介
- Hexagon AB
- GSSI Geophysical Survey Systems Inc.
- Landscope Engineering Ltd
- Plowman Craven Limited
- Geospatial Corporation
- Vivax-Metrotech Corp.
- Maverick Inspection Ltd
- Red Laser Scanning
- Technics Group
- multiVIEW Locates Inc.
第九章投资分析
第十章:市场的未来
The Underground Utility Mapping Market size is estimated at USD 1.45 billion in 2025, and is expected to reach USD 2.29 billion by 2030, at a CAGR of greater than 9.61% during the forecast period (2025-2030).
Two primary factors are propelling the underground utility mapping market: heightened economic activities, especially in developing nations, and increasing government initiatives aimed at maintaining these underground utilities.
Key Highlights
- In recent years, the subsurface utility engineering (SUE) industry has been at the forefront, crafting innovative solutions to the challenges of mapping underground utility infrastructures. By melding geophysical technologies, such as electromagnetic locators and ground-penetrating radars, with non-technical methods like historical records, the industry is able to amass a comprehensive dataset of subsurface infrastructures.
- Moreover, the World Economic Forum anticipates that global investments in urban grey infrastructure will skyrocket to USD 10,548 billion by 2030. Such monumental urban development investments herald a significant growth opportunity for the underground utility mapping market.
- As urbanization accelerates, the global trend of smart cities is gaining traction. The United Nations projects that by 2050, urban populations will swell by 404 million in India, 292 million in China, and 212 million in Nigeria.
- Meanwhile, Latin America, an emerging continent, is experiencing the swiftest urbanization. With numerous global smart city projects in motion, international investments are pouring in. The Organization for Economic Cooperation and Development (OECD) estimates that from 2010 to 2030, global investments in smart city initiatives will near USD 1.8 trillion, encompassing all metropolitan infrastructure projects. This surge in smart city developments is set to amplify demand in the underground utility mapping market.
- Infrastructure planning, often sidelined in urban development, is vital for the seamless operation of complex facilities. A pivotal tool in this endeavor is 3D utility mapping, which provides a three-dimensional perspective of an area and its utilities. This method captures subsurface data, encompassing water, sewer, and gas lines, alongside structural maps and electrical wiring. Armed with a detailed 3D utility map and a Conceptual Site Model (CSM), planners can swiftly pinpoint challenges and devise effective solutions.
- By merging emerging technologies with utility maps, the underground utility mapping market is undergoing a transformation. These advancements bolster the accuracy, efficiency, and safety of exploration activities. Consequently, exploration teams can adeptly navigate challenges tied to underground infrastructure, streamline their routes, and mitigate risks, driving the market's growth and fostering innovation.
- While Ground Penetrating Radar (GPR) excels at pinpointing the horizontal locations of targets, various factors can sway the speed and precision of depth measurements. Soil type and moisture content are pivotal. For instance, radar signals slow down in challenging soils like sand and clay. Moisture-rich materials further influence signal speed. Thus, while pinpointing the exact speed of GPR signals across different materials poses challenges, estimates generally hover around 90% accuracy.
Underground Utility Mapping Market Trends
Ground Penetrating Radar is Expected to be the Largest Component Type Solution
- Ground-penetrating radar (GPR) stands out as the premier choice for utility mapping, emitting directional electromagnetic waves in the MHz and GHz range. By analyzing the return of these signals, GPR accurately pinpoints the location of underground utility infrastructure.
- GPR technology is notably adept at identifying both metallic and nonmetallic utilities. Utility surveyors favor GPR for its swift data acquisition, cost-effectiveness, and high-resolution imagery in utility mapping surveys.
- Beyond utility mapping, GPR serves as a non-destructive tool for evaluating concrete structures, revealing insights on rebar placements, slab thickness, and the presence of voids or conduits. This non-invasive approach not only ensures precise results but also minimizes disruptions to ongoing construction projects.
- In a forward-looking move, drone manufacturers are crafting GPR-enabled drones, hinting at a burgeoning market opportunity as they become poised to detect underground utilities.
- With the expansion of natural gas pipelines, the demand for precise mapping and monitoring intensifies. Ground penetration techniques play a pivotal role in locating, identifying, and evaluating pipeline conditions, all while safeguarding the surrounding environment. As of February 2024, data from GGON highlights China's dominance in the global gas pipeline landscape. Boasting 442 operational pipelines and an additional 302 either proposed or under construction, China's network is a significant contributor to the global tally of over 1,500 operational gas pipelines.
North America Holds Largest Market Share
- In North America, rapid urbanization and population growth are straining existing infrastructure systems, leading to a heightened demand for underground utility mapping services. The complexity and density of urban areas necessitate precise mapping to prevent damage to underground utilities during construction.
- The National Underground Asset Registry Advisory Group reports that the challenge of locating underground utilities costs the U.S. economy approximately USD 50 billion annually. This issue has also led to over 1,500 injuries and nearly 400 fatalities in the past two decades. Furthermore, inaccuracies in underground utility mapping contribute significantly to delays in highway construction. Such uncertainties are driving the adoption of advanced technology-based solutions in the region.
- Numerous cities and municipalities across North America are channeling investments into smart city initiatives. These efforts aim to harness technology for better infrastructure management, enhanced public services, and optimized resource allocation. Within this context, underground utility mapping plays a pivotal role, offering vital data for infrastructural asset management and planning.
- Efforts are underway in the region to develop methods for sharing data on underground utilities, especially those captured during construction. A notable example is the City of Chicago's pilot program, which aims to deploy a platform for data collection and sharing a 3D map of the subway.
- Regional players are increasingly adopting inorganic growth strategies to capture larger market shares, further propelling the segment's growth. Additionally, many public works departments in the region are utilizing GIS technology to pinpoint the locations of underground utilities.
Underground Utility Mapping Industry Overview
The underground utility mapping market features a semi-consolidated landscape, characterized by the coexistence of global giants and a multitude of small to medium-sized enterprises. Key players shaping the market include Hexagon AB, GSSI Geophysical Survey Systems Inc., LandScope Engineering Ltd, Plowman Craven Limited, and Geospatial Corporation. These players are strategically leveraging partnerships and acquisitions to bolster their product offerings and secure a competitive edge.
For example, in April 2024, USIC, LLC ("USIC"), a prominent player in underground utility damage prevention, forged an official partnership with the U.S. Army's Partnership for Your Success (PaYS) Program. This initiative provides American soldiers with opportunities to serve their country while simultaneously preparing for their post-service careers. The partnership was ceremoniously signed at USIC's corporate headquarters, with the event being hosted by the Indiana Army National Guard Recruiting and Retention Battalion. As a recognized PaYS Partner, USIC pledges to offer soldiers an interview and a shot at employment once they conclude their Army tenure. This strategic alliance not only facilitates a smoother transition for soldiers into civilian life but also underscores the US Army's dedication to nurturing strong relationships with the corporate sector.
Additional Benefits:
- The market estimate (ME) sheet in Excel format
- 3 months of analyst support
TABLE OF CONTENTS
1 INTRODUCTION
- 1.1 Study Assumptions and Market Definition
- 1.2 Scope of the Study
2 RESEARCH METHODOLOGY
3 EXECUTIVE SUMMARY
4 MARKET INSIGHTS
- 4.1 Market Overview
- 4.2 Industry Attractiveness - Porter's Five Forces Analysis
- 4.2.1 Threat of New Entrants
- 4.2.2 Bargaining Power of Buyers/Consumers
- 4.2.3 Bargaining Power of Suppliers
- 4.2.4 Threat of Substitute Products
- 4.2.5 Intensity of Competitive Rivalry
5 MARKET DYNAMICS
- 5.1 Market Drivers
- 5.1.1 Emerging Technologies Combined With Utility Maps to Improve the Exploration Activities
- 5.1.2 Increasing Availability of Detecting Applications and Increased Return on Marketing Spending
- 5.2 Market Challenges
- 5.2.1 Significantly High Maintenance Costs of Mapping Tools
6 IMPACT OF COVID-19 ON THE UNDERGROUND UTILITY MAPPING MARKET
7 MARKET SEGMENTATION
- 7.1 By Component Type
- 7.1.1 Solutions
- 7.1.1.1 Ground Penetrating Radar
- 7.1.1.2 Electromagnetic Locators
- 7.1.1.3 Other Solutions
- 7.1.2 Services
- 7.1.1 Solutions
- 7.2 By End-user Industry
- 7.2.1 Public Safety
- 7.2.2 Oil and Gas
- 7.2.3 Building and Construction
- 7.2.4 Telecommunication
- 7.2.5 Electricity
- 7.2.6 Other End-user Industries
- 7.3 By Geography
- 7.3.1 North America
- 7.3.2 Europe
- 7.3.3 Asia
- 7.3.4 Australia and New Zealand
- 7.3.5 Latin America
- 7.3.6 Middle East and Africa
8 COMPETITIVE LANDSCAPE
- 8.1 Company Profiles
- 8.1.1 Hexagon AB
- 8.1.2 GSSI Geophysical Survey Systems Inc.
- 8.1.3 Landscope Engineering Ltd
- 8.1.4 Plowman Craven Limited
- 8.1.5 Geospatial Corporation
- 8.1.6 Vivax-Metrotech Corp.
- 8.1.7 Maverick Inspection Ltd
- 8.1.8 Red Laser Scanning
- 8.1.9 Technics Group
- 8.1.10 multiVIEW Locates Inc.

