


 |
市场调查报告书
商品编码
1683137
高强度混凝土市场:市场占有率分析、产业趋势与统计、成长预测(2025-2030 年)High-Strength Concrete - Market Share Analysis, Industry Trends & Statistics, Growth Forecasts (2025 - 2030) |
||||||
价格
※ 本网页内容可能与最新版本有所差异。详细情况请与我们联繫。
简介目录
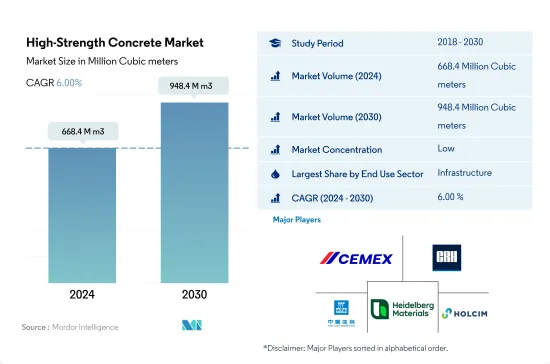
预计2024年高强度混凝土市场规模将达到6.684亿立方米,到2030年预计将达到9.484亿立方米,预测期内(2024-2030年)的复合年增长率为6.00%。
全球住宅领域对高强度混凝土的需求预计将激增
- 2022年全球高强度混凝土消费量与前一年同期比较下降2.32%。商业领域的降幅最大,达 7.24%,主要原因是建筑量低迷。随着大多数经济体在 2023 年稳定并恢復到疫情前的水平,各行业的建设活动将经历强劲增长,全球整体高强度混凝土消费量预计将比 2022 年增长 6.1%。
- 高强度混凝土比普通混凝土具有多种优势,包括承载能力增强、重量减轻和耐久性提高。与预製构件的兼容性进一步简化了施工,节省了时间和金钱。因此,与其他领域相比,高强度混凝土在基础设施领域最受青睐。
- 工业和机构部门是高强度混凝土的第二大消费者。预拌混凝土将在该领域占据主导地位,到 2022 年将占总量的 45%。预计在预测期内,预製类型的复合年增长率最高,约为 7%。
- 在住宅领域,高强度混凝土被广泛应用于高层建筑。其卓越的承载能力使其成为将垂直载重传递至建筑物地基的经济选择。随着全球都市化的加速和对垂直住宅的偏好日益增长,预计在预测期内,住宅领域的高强度混凝土消费量将呈现最快的复合年增长率,达到 7.25%。
全球高强度混凝土市场预计将成长,主要受到亚太地区商业和住宅领域扩张的推动。
- 2022年全球高强度混凝土消费量与前一年同期比较减少1,400万立方公尺。亚太地区将占这一降幅的大部分,2022 年的需求将比 2021 年减少 2,100 万立方公尺。不过,这种情况将在 2023 年发生变化,届时高层建筑计划的激增预计将使全球消费量增加约 3,600 万立方公尺。
- 亚太地区在建筑计划(无论规模大小)方面始终处于领先地位。其中一个例子是印度,截至 2022 年 5 月,印度正在实施或进行中的基础设施计划数量最多,累积金额超过 2500 万美元,超过所有其他国家。中国和澳洲在本次排名中分别排名第三和第四。这些数字证实亚太地区是世界领先的高强度混凝土消费地区。
- 继亚太地区之后,欧洲已成为第二大高强度混凝土市场。俄罗斯、德国和义大利尤其成为重要的参与企业,占2022年欧洲需求的48%。基础设施、工业和设施部门是主要驱动力,占该地区消费的60%以上。
- 亚太地区是高强度混凝土市场成长最快的市场,预测期内预计复合年增长率为 6.5%。这一增长是由该地区快速增长的住宅和商业领域不断增长的需求所推动的。例如,预计在预测期内,商业领域新建占地面积将呈现 5.2% 的强劲复合年增长率。
全球高强度混凝土市场趋势
亚太地区大型办公大楼兴建计划激增,带动全球专用商业占地面积增加
- 2022年,全球新建商业建筑占地面积将与前一年同期比较去年小幅成长0.15%。欧洲表现突出,增幅高达 12.70%,这得益于欧洲各国大力推行节能办公大楼,以实现 2030 年碳排放目标。随着员工重返办公室,欧洲公司正在重新签订租约,刺激 2022 年新办公大楼建造 450 万平方英尺。预计这一势头将在 2023 年继续,全球成长率预计为 4.26%。
- 新冠疫情造成劳动力和材料短缺,导致商业建筑计划取消和延迟。然而,随着停工缓解和建设活动的恢復,2021年全球新建商业占地面积激增11.11%,其中亚太地区以20.98%的成长率领先。
- 展望未来,全球新建商业占地面积的复合年增长率将达到4.56%。预计亚太地区的复合年增长率为 5.16%,超过其他地区。这一成长的驱动力是中国、印度、韩国和日本商业设施建设计划的活性化。尤其北京、上海、香港、台北等中国主要城市甲级办公室建设正在加速。此外,2023 年至 2025 年间,印度七大城市计划开幕约 60 家购物中心,总建筑面积约 2,325 万平方英尺。总合,到 2030 年,亚太地区的这些措施预计将比 2022 年增加 15.6 亿平方英尺的新零售占地面积。
预计南美洲的住宅将出现最快的成长,这得益于政府加大对经济适用住宅计画的投资,这将促进全球住宅产业的发展。
- 2022 年,全球新建住宅占地面积与 2021 年相比减少了约 2.89 亿平方英尺。这是由于土地稀缺、劳动力短缺和建筑材料价格不可持续的高企造成的住宅危机。这场危机对亚太地区产生了严重影响,2022 年新占地面积与 2021 年相比下降了 5.39%。不过,2023 年的前景更加光明,预计全球新建占地面积将比 2022 年增长 3.31%,这要归功于政府投资,这些投资可以在 2030 年前为 30 亿人提供建造新的经济适用住宅的资金。
- 新冠疫情造成经济放缓,大量住宅建设计划取消或推迟,导致2020年全球新建占地面积较2019年下降4.79%。随着2021年限制措施解除,住宅计划被压抑的需求得到释放,新建占地面积较2020年增长11.22%,其中欧洲增幅最高,为18.28%,其次是南美洲,2021年较2020年增长17.36%。
- 预测期内,全球住宅新建占地面积预计复合年增长率为 3.81%,其中南美洲的复合年增长率最快,为 4.05%。巴西的Minha Casa Minha Vida 计画于2023年宣布实施,政府计画投资19.8亿美元,为低收入家庭提供可负担住宅;智利的FOGAES计画也于2023年宣布实施,初期投资为5,000万美元。
高强度混凝土行业概况
高强度混凝土市场较为分散,前五家公司占7.84%的市占率。市场的主要企业包括 CEMEX、SAB de CV、CRH、CSCEC、Heidelberg Materials 和 Holcim。
其他福利
- Excel 格式的市场预测 (ME) 表
- 3 个月的分析师支持
目录
第 1 章执行摘要和主要发现
第二章 报告要约
第 3 章 简介
- 研究假设和市场定义
- 研究范围
- 调查方法
第四章 产业主要趋势
- 最终用途细分趋势
- 商业的
- 业/设施
- 基础设施
- 住宅
- 重大基础设施计划(目前和已宣布)
- 法律规范
- 价值链与通路分析
第 5 章。市场区隔(包括市场规模、2030 年预测、成长前景分析)
- 最终用途领域
- 商业的
- 业/设施
- 基础设施
- 住宅
- 产品
- 现场混合
- 预製
- 预拌混凝土
- 地区
- 亚太地区
- 按国家
- 澳洲
- 中国
- 印度
- 印尼
- 日本
- 马来西亚
- 韩国
- 泰国
- 越南
- 其他亚太地区
- 欧洲
- 按国家
- 法国
- 德国
- 义大利
- 俄罗斯
- 西班牙
- 英国
- 欧洲其他地区
- 中东和非洲
- 按国家
- 沙乌地阿拉伯
- 阿拉伯聯合大公国
- 其他中东和非洲地区
- 北美洲
- 按国家
- 加拿大
- 墨西哥
- 美国
- 南美洲
- 按国家
- 阿根廷
- 巴西
- 南美洲其他地区
- 亚太地区
第六章 竞争格局
- 主要策略趋势
- 市场占有率分析
- 业务状况
- 公司简介
- CEMEX, SAB de CV
- CRH
- CSCEC
- Heidelberg Materials
- Holcim
- OYAK Cement
- Thomas Concrete Group
- UltraTech Cement Ltd.
- Vicat
- Yunnan Construction Investment Holding Group Co., Ltd
第七章:执行长的关键策略问题
第 8 章 附录
- 世界概况
- 概述
- 五力分析框架(产业吸引力分析)
- 全球价值链分析
- 市场动态(DRO)
- 资讯来源和进一步阅读
- 图片列表
- 关键见解
- 资料包
- 词彙表
简介目录
Product Code: 52704
The High-Strength Concrete Market size is estimated at 668.4 million Cubic meters in 2024, and is expected to reach 948.4 million Cubic meters by 2030, growing at a CAGR of 6.00% during the forecast period (2024-2030).
The demand for high-strength concrete is expected to rise rapidly in the global residential sector
- In 2022, global consumption of high-strength concrete dipped by 2.32% compared to the previous year. The commercial sector saw the steepest decline, with a drop of 7.24%, primarily due to sluggish growth in construction volumes. As most economies stabilized and regained pre-pandemic levels in 2023, the sectors experienced high growth in construction activities, leading to an estimated increase of 6.1% in the overall global consumption of high-strength concrete compared to 2022.
- High-strength concrete offers several advantages over regular concrete, including enhanced load-bearing capacity, reduced weight, and heightened durability. Its compatibility with precast elements further streamlines construction, saving both time and money. Therefore, high-strength concrete is most preferred in the infrastructure sector compared to the rest of the sectors.
- The industrial & institutional sector is the second-largest consumer of high-strength concrete. Within this sector, the ready-mix variant dominates, accounting for 45% of the total volume in 2022. The precast type is projected to witness the highest CAGR of approximately 7% during the forecast period.
- In the residential sector, high-strength concrete is extensively used in high-rise buildings. Its exceptional load-bearing capabilities make it an economical choice for transferring vertical loads to a building's foundation. With global urbanization on the rise and a growing preference for vertical housing, the residential sector is anticipated to witness the fastest CAGR of 7.25% in high-strength concrete consumption during the forecast period.
The global high-strength concrete market is poised for growth, largely driven by the expanding commercial and residential sectors in Asia-Pacific
- The global consumption of high-strength concrete witnessed a decline of 14 million cubic meters in 2022 compared to the previous year. Asia-Pacific accounted for a significant portion of this decline, with a drop of 21 million cubic meters in 2022 compared to 2021. However, the scenario was set to change in 2023, as the surge in high-rise construction projects is projected to boost global consumption by approximately 36 million cubic meters.
- Asia-Pacific consistently leads in construction projects, spanning from small to mega-scale. A case in point is India, which, as of May 2022, had the highest number of infrastructure projects in progress or underway, with a cumulative value exceeding USD 25 million, surpassing all other nations. China and Australia secured the 3rd and 4th positions, respectively, in this ranking. These figures underscore the Asia-Pacific's dominance as the primary global consumer of high-strength concrete.
- Following the Asia-Pacific, Europe emerges as the second-largest market for high-strength concrete. Notably, Russia, Germany, and Italy stand out as pivotal players, collectively accounting for 48% of Europe's demand in 2022. The infrastructure, industrial, and institutional sectors are the major drivers, accounting for over 60% of the region's consumption.
- Asia-Pacific is poised to be the fastest-growing market for high-strength concrete, with a projected volume CAGR of 6.5% during the forecast period. This growth is fueled by rising demand from the region's burgeoning residential and commercial sectors. For instance, the commercial sector's new floor area is anticipated to witness a robust CAGR of 5.2% in volume during the forecast period.
Global High-Strength Concrete Market Trends
Asia-Pacific's surge in large-scale office building projects is set to elevate the global floor area dedicated to commercial construction
- In 2022, the global new floor area for commercial construction witnessed a modest growth of 0.15% from the previous year. Europe stood out with a significant surge of 12.70%, driven by a push for high-energy-efficient office buildings to align with its 2030 carbon emission targets. As employees returned to offices, European companies, resuming lease decisions, spurred the construction of 4.5 million square feet of new office space in 2022. This momentum is poised to persist in 2023, with a projected global growth rate of 4.26%.
- The COVID-19 pandemic caused labor and material shortages, leading to cancellations and delays in commercial construction projects. However, as lockdowns eased and construction activities resumed, the global new floor area for commercial construction surged by 11.11% in 2021, with Asia-Pacific taking the lead with a growth rate of 20.98%.
- Looking ahead, the global new floor area for commercial construction is set to achieve a CAGR of 4.56%. Asia-Pacific is anticipated to outpace other regions, with a projected CAGR of 5.16%. This growth is fueled by a flurry of commercial construction projects in China, India, South Korea, and Japan. Notably, major Chinese cities like Beijing, Shanghai, Hong Kong, and Taipei are gearing up for an uptick in Grade A office space construction. Additionally, India is set to witness the opening of approximately 60 shopping malls, spanning 23.25 million square feet, in its top seven cities between 2023 and 2025. Collectively, these endeavors across Asia-Pacific are expected to add a staggering 1.56 billion square feet to the new floor area for commercial construction by 2030, compared to 2022.
South America's estimated fastest growth in residential constructions due to increasing government investments in schemes for affordable housing to boost the global residential sector
- In 2022, the global new floor area for residential construction declined by around 289 million square feet compared to 2021. This can be attributed to the housing crisis generated due to the shortage of land, labor, and unsustainably high construction materials prices. This crisis severely impacted Asia-Pacific, where the new floor area declined 5.39% in 2022 compared to 2021. However, a more positive outlook is expected in 2023 as the global new floor area is predicted to grow by 3.31% compared to 2022, owing to government investments that can finance the construction of new affordable homes capable of accommodating 3 billion people by 2030.
- The COVID-19 pandemic caused an economic slowdown, due to which many residential construction projects got canceled or delayed, and the global new floor area declined by 4.79% in 2020 compared to 2019. As the restrictions were lifted in 2021 and pent-up demand for housing projects was released, new floor area grew 11.22% compared to 2020, with Europe having the highest growth of 18.28%, followed by South America, which rose 17.36% in 2021 compared to 2020.
- The global new floor area for residential construction is expected to register a CAGR of 3.81% during the forecast period, with South America predicted to develop at the fastest CAGR of 4.05%. Schemes and initiatives like the Minha Casa Minha Vida in Brazil announced in 2023 with a few regulatory changes, for which the government plans an investment of USD 1.98 billion to provide affordable housing units for low-income families, and the FOGAES in Chile also publicized in 2023, with an initial investment of USD 50 million, are aimed at providing mortgage loans to families for affordable housing and will encourage the construction of new residential units.
High-Strength Concrete Industry Overview
The High-Strength Concrete Market is fragmented, with the top five companies occupying 7.84%. The major players in this market are CEMEX, S.A.B. de C.V., CRH, CSCEC, Heidelberg Materials and Holcim (sorted alphabetically).
Additional Benefits:
- The market estimate (ME) sheet in Excel format
- 3 months of analyst support
TABLE OF CONTENTS
1 EXECUTIVE SUMMARY & KEY FINDINGS
2 REPORT OFFERS
3 INTRODUCTION
- 3.1 Study Assumptions & Market Definition
- 3.2 Scope of the Study
- 3.3 Research Methodology
4 KEY INDUSTRY TRENDS
- 4.1 End Use Sector Trends
- 4.1.1 Commercial
- 4.1.2 Industrial and Institutional
- 4.1.3 Infrastructure
- 4.1.4 Residential
- 4.2 Major Infrastructure Projects (current And Announced)
- 4.3 Regulatory Framework
- 4.4 Value Chain & Distribution Channel Analysis
5 MARKET SEGMENTATION (includes market size, forecasts up to 2030 and analysis of growth prospects.)
- 5.1 End Use Sector
- 5.1.1 Commercial
- 5.1.2 Industrial and Institutional
- 5.1.3 Infrastructure
- 5.1.4 Residential
- 5.2 Product
- 5.2.1 On-site Mix
- 5.2.2 Precast
- 5.2.3 Ready-Mix
- 5.3 Region
- 5.3.1 Asia-Pacific
- 5.3.1.1 By Country
- 5.3.1.1.1 Australia
- 5.3.1.1.2 China
- 5.3.1.1.3 India
- 5.3.1.1.4 Indonesia
- 5.3.1.1.5 Japan
- 5.3.1.1.6 Malaysia
- 5.3.1.1.7 South Korea
- 5.3.1.1.8 Thailand
- 5.3.1.1.9 Vietnam
- 5.3.1.1.10 Rest of Asia-Pacific
- 5.3.2 Europe
- 5.3.2.1 By Country
- 5.3.2.1.1 France
- 5.3.2.1.2 Germany
- 5.3.2.1.3 Italy
- 5.3.2.1.4 Russia
- 5.3.2.1.5 Spain
- 5.3.2.1.6 United Kingdom
- 5.3.2.1.7 Rest of Europe
- 5.3.3 Middle East and Africa
- 5.3.3.1 By Country
- 5.3.3.1.1 Saudi Arabia
- 5.3.3.1.2 United Arab Emirates
- 5.3.3.1.3 Rest of Middle East and Africa
- 5.3.4 North America
- 5.3.4.1 By Country
- 5.3.4.1.1 Canada
- 5.3.4.1.2 Mexico
- 5.3.4.1.3 United States
- 5.3.5 South America
- 5.3.5.1 By Country
- 5.3.5.1.1 Argentina
- 5.3.5.1.2 Brazil
- 5.3.5.1.3 Rest of South America
- 5.3.1 Asia-Pacific
6 COMPETITIVE LANDSCAPE
- 6.1 Key Strategic Moves
- 6.2 Market Share Analysis
- 6.3 Company Landscape
- 6.4 Company Profiles
- 6.4.1 CEMEX, S.A.B. de C.V.
- 6.4.2 CRH
- 6.4.3 CSCEC
- 6.4.4 Heidelberg Materials
- 6.4.5 Holcim
- 6.4.6 OYAK Cement
- 6.4.7 Thomas Concrete Group
- 6.4.8 UltraTech Cement Ltd.
- 6.4.9 Vicat
- 6.4.10 Yunnan Construction Investment Holding Group Co., Ltd
7 KEY STRATEGIC QUESTIONS FOR CONCRETE, MORTARS AND CONSTRUCTION CHEMICALS CEOS
8 APPENDIX
- 8.1 Global Overview
- 8.1.1 Overview
- 8.1.2 Porter's Five Forces Framework (Industry Attractiveness Analysis)
- 8.1.3 Global Value Chain Analysis
- 8.1.4 Market Dynamics (DROs)
- 8.2 Sources & References
- 8.3 List of Tables & Figures
- 8.4 Primary Insights
- 8.5 Data Pack
- 8.6 Glossary of Terms


