


 |
市场调查报告书
商品编码
1683540
全球废弃物管理设备 -市场占有率分析、行业趋势和统计、成长预测(2025-2030 年)Global Waste Management Equipment - Market Share Analysis, Industry Trends & Statistics, Growth Forecasts (2025 - 2030) |
||||||
※ 本网页内容可能与最新版本有所差异。详细情况请与我们联繫。
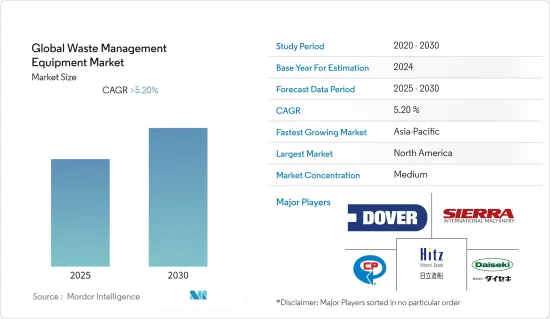
预测期内,全球废弃物管理设备市场预计将以超过 5.2% 的复合年增长率成长。
COVID-19 从细分领域重点转移的角度对废弃物管理行业产生了影响;在封锁期间,由于工业和办公室部分或全部关闭,住宅部分产生的废弃物比工业和商业中心更多。由于製造业活动放缓,工业废弃物和商业废弃物产量大幅下降。由于製药和医疗保健行业的排放增加,危险废弃物排放也增加。新冠疫情促使欧盟成员国采取零废弃物方法,要求它们回收70-80%的废弃物,减少危险废弃物处理和焚烧技术产生的温室排放(根据欧盟委员会的数据)。
新兴国家现有的危险废弃物处理能力已达极限,有可能导致废弃物囤积和处置不充分的情况。城市废弃物的数量不断增加,大大超出了现有的废弃物收集和处理系统的承受能力。据报道,回收活动有所减少,进一步加剧了城市废弃物收集和处理的挑战。根据 AMSA 集团在 2020 年进行的一项研究,义大利米兰市由于严格的封锁,其废弃物排放总量下降了 27.5%。不过,与 2019 年同期相比,废弃物回收量增加了 1%,而路边垃圾箱减少了 38.2%。封锁期间城市废弃物减少了16.65%。
根据世界银行预测,到2050年,废弃物排放将比2020年增加73%。中等收入国家将占这一成长的大部分,未来30年废弃物产生量将几乎翻倍,但低收入国家和许多高所得国家也将做出重大贡献。截至 2021 年,全球仅有 77% 的固态废弃物收集,33% 的废弃物被露天倾倒。低收入国家的情况尤其令人担忧,这些国家产生的废弃物只有40%被收集,93%被倾倒或未妥善管理。根据废料回收工业协会 (ISRI) 2021 年的一项调查,66% 的美国表示,如果回收产品不容易或不方便,他们就不会回收,而美国城市固态废弃物(MSW) 回收率仍然低至 35%。据新加坡国家环境局(NEA)称,2021 年产生了约 694 万吨固态废弃物,其中 383 万吨被回收。非生活和家庭部门的废弃物产生量分别从 2020 年的 412 万吨和 177 万吨增加到 2021 年的 512 万吨和 182 万吨,同样,非生活和家庭部门的回收废弃物分别从 2020 年的 281 万吨和 23 万吨增加到 2021 万吨的 2021 万吨和 23 万吨。因此,人们对正确回收和处理废弃物的认识不断提高,正在推动废弃物管理产业的发展。
废弃物管理设备市场趋势
全球废弃物产生量的增加可能会推动对废弃物管理设备的需求
根据 Sensoneo 发布的《2022 年世界废弃物指数》,土耳其位居废弃物管理最不环保的国家之首,人均回收废弃物47 公斤,非法倾倒废弃物 176 公斤。大部分废弃物是在美国产生的。目前,每个美国排放811公斤垃圾,其中约一半被送往掩埋。但其中只有95公斤被焚烧。
根据 2022 年全球废弃物指数,哥伦比亚排放的都市废弃物最少,为人均 243 公斤。其他国家的垃圾回收率都较低,平均每人每年将 417 公斤废弃物送到掩埋,而这些垃圾的处理方式对环境特别有害。自从上次世界废弃物指数发布以来,冰岛的废弃物管理状况比以往任何时候都更加恶化。根据2022年全球废弃物指数,冰岛的废弃物排放自2019年以来增加了7%,而废弃物回收率下降了68%。同时,瑞士是唯一一个不将废弃物送到垃圾掩埋场的国家。在瑞士,每个居民排放706公斤废弃物,其中333公斤被焚烧,210公斤被回收。
全球整体每年产生约4亿吨塑胶废弃物。美国2021年将产生4,000万吨塑胶废弃物,其中只有5%至6%,即约200万吨将回收。 2021年,纸张回收超过5,000万吨,回收率为68%,纸板回收率为91.4%。世界经济论坛的一项研究显示,美国每天约有1.1亿个玻璃瓶被丢弃,但其中只有三分之一被回收。
联合国粮食及农业组织在最新报告中估计,全球食物浪费量「以初级商品当量计算」为16亿吨。其中,可食用食物废弃物总量达13亿吨。据估计,食物废弃物的碳足迹为每年向大气中释放 33 亿吨二氧化碳当量的温室气体。在新兴国家,农业生产阶段存在大量的食物浪费,而在中高所得地区,零售和消费层面往往有大量的食物浪费。食物浪费(不包括鱼贝类)每年造成 7,500 亿美元的直接经济影响。
人们对工业废弃物回收的兴趣日益浓厚,刺激了市场
都市固态废弃物(MSW)是企业、建筑物、机构、小型企业、住宅和庭院产生的废弃物,2021 年,它通常占全国产生的废弃物总量的不到 5%。根据欧盟官方资料,在同一时期,在大多数已开发国家,总废弃物产生的30%至35%来自建筑业的活动,包括建筑施工、重建和拆除过程。
根据联合国统计,全球每年产生约112亿吨固态废弃物,其中腐烂的废弃物约占全球温室气体排放的5%。据估计,全球每年只有不到20%的废弃物被回收,富裕国家将可回收的垃圾出口到贫穷国家。在美国,所有回收材料的三分之一都出口到海外。在英国,估计有 46% 的回收物出口到土耳其、波兰和马来西亚等国家。
自新冠疫情爆发以来,欧洲、亚洲和美国的回收率都有所下降。但疫情也产生了大量新的废弃物,如个人防护装备和一次性用品。根据《美国科学院院刊》(PNAS)的一项研究,疫情在全球产生了超过 800 万吨塑胶废弃物,其中超过 25,000 吨最终流入海洋。
废弃物管理设备产业概况
全球废弃物管理市场格局高度整合且竞争激烈,许多参与者专注于创新技术,以回收和再利用世界各地各行业和家庭产生的废弃物。该市场的主要全球参与者包括 Recycling Equipment Manufacturing Inc、CP Manufacturing Inc、Dover Corporation、Morita Holding Corporation、Tomra Systems ASA、Wastequip LLC、Blue Group、KK Balers Ltd、Shred-Tech Corporation 和 McNeilus Trucks and Manufacturing, Inc。此外,一些新兴企业也纷纷涌现,它们不断致力于透过遵循零废弃物 3R(减少、重复使用、回收)理念来减少废弃物。市场上也发生了很多併购事件。
其他福利:
- Excel 格式的市场预测 (ME) 表
- 3 个月的分析师支持
目录
第 1 章 简介
- 调查前提条件
- 研究范围
第二章调查方法
- 分析方法
- 研究阶段
第三章执行摘要
第四章 市场动态
- 当前市场状况
- 市场概况
- 市场动态
- 驱动程式
- 限制因素
- 机会
- 价值链/供应链分析
- 波特五力分析
- 新进入者的威胁
- 购买者/消费者的议价能力
- 供应商的议价能力
- 替代品的威胁
- 竞争对手之间的竞争强度
- 废弃物管理设备市场的技术进步
- 废弃物管理设备市场的区域见解
- COVID-19 市场影响
第五章 市场区隔
- 依产品类型
- 废弃物设备
- 废弃物回收分选设备
- 废弃物类型
- 危险货物
- 非危险品
- 按应用
- 工业废弃物
- 普通废弃物
- 其他的
- 按地区
- 北美洲
- 美国
- 加拿大
- 墨西哥
- 欧洲
- 西班牙
- 德国
- 法国
- 英国
- 葡萄牙
- 希腊
- 义大利
- 欧洲其他地区
- 亚太地区
- 中国
- 日本
- 韩国
- 印度
- 其他亚太地区
- 拉丁美洲、中东和非洲
- UAE
- 沙乌地阿拉伯
- 巴西
- 南非
- 其他地区
- 北美洲
第六章 竞争格局
- 公司简介
- Recycling Equipment Manufacturing, Inc
- Sierra International Machinery, LLC
- CP Manufacturing, Inc.
- Dover Corporation
- Daiseki
- Hitachi Zosen
- Morita Holding Corporation
- Tomra Systems ASA
- Wastequip, LLC
- Blue Group*
第七章:市场的未来
第 8 章 附录
The Global Waste Management Equipment Market is expected to register a CAGR of greater than 5.2% during the forecast period.
COVID-19 impacted the waste management industry from the focus of segment shift; during the lockdown, the residential segment generated more waste than industrial and commercial centres, as industries and offices were partially or completely shut. Industrial and commercial waste production fell drastically due to the slowdown in manufacturing activity. Hazardous waste production grew with higher production from the pharmaceutical and medical sectors. The COVID-19 pandemic triggered a zero-waste approach that requires members of the EU to recycle waste between 70-80% while declining GHG emissions attributed to toxic waste disposal and incineration techniques as per the European Commission.
Existing hazardous waste treatment capacity in developing countries was overwhelmed, leading to stockpiling and potentially inadequate disposal. Municipal waste had increased in volume, effectively overwhelming existing waste collection and disposal systems. A reduction in recycling activities was reported which further compounded challenges in the collection and disposal of municipal waste. The study conducted by AMSA Group in 2020 states that in Milan (Italy), the institution of strict lockdown led to a decline in the total waste production by 27.5%. However, recycling of waste increased by 1% compared to 2019 the same period, whereas street bins declined by 38.2%. The month of confinement saw a 16.65% drop in municipal waste.
According to the World Bank, by 2050, waste production will be 73% higher than in 2020. This increase will be mostly driven by middle-income countries in which waste generation will nearly double in the next three decades, though low- and many- high-income countries will contribute significantly to the growing volume. As of 2021, only 77% of global solid waste is collected and 33% of it is openly dumped. The situation in low-income countries is particularly alarming, where only 40% of the generated waste is collected and 93% is dumped or improperly managed. A survey conducted by the Institute of Scrap Recycling Industries (ISRI) in 2021 suggests that 66% of Americans would not recycle a product if it's not easy or inconvenient to do so, and the municipal solid waste (MSW) recycling rate in the US remains as low as 35% in the country. As per National Environment Agency (NEA), Singapore, in 2021, about 6.94 million tonnes of solid waste was generated, of which 3.83 million tonnes were recycled. Waste generated by the non-domestic and domestic sectors both increased in 2021, from 4.12 million tonnes and 1.77 million tonnes respectively in 2020, to 5.12 million tonnes and 1.82 million tonnes respectively in 2021, recycled waste attributed to the non-domestic and domestic sectors likewise increased, from 2.81 million tonnes and 0.23 million tonnes respectively in 2020, to 3.58 million tonnes and 0.24 million tonnes respectively in 2021 in Singapore. Thus increasing awareness about proper recycling and disposal of waste is fueling the growth of waste management industry.
Waste Management Equipment Market Trends
Rising global waste generation is likely to result in the need of waste management equipment
The 2022's Global Waste Index from Sensoneo, reports Turkey is at the top of the list as the least environmentally friendly waste management country, with 47kg of waste per capita recycled and 176kg per capita of waste disposed of illegally each year. Most waste is generated in the United States. Each US citizen currently produces 811kg of waste, and around half of that ends up in the landfill. Meanwhile, just 95kg of that is incinerated.
As per the 2022's Global Waste Index, Colombia produces the least municipal waste, at 243kg per capita while the disposal system in Chile recycles only two kilos per inhabitant. No other country recycles less, 417kg of waste per capita ends up in landfill and is disposed of in a particularly environmentally harmful way. Iceland's waste management has worsened the most since the last Global Waste Index. According to the 2022's Global Waste Index, waste production in Iceland increased by 7% since 2019 and 68% less waste is recycled. While Switzerland is the only country that does not send any waste to landfill. The Swiss produce 706kg of waste per capita, of which 333kg are incinerated and 210kg is recycled.
Globally, about 400 million tons of plastic waste are produced yearly. In 2021, in the U.S.A, 40 million tons of plastic waste is generated of which only 5% to 6% or about two million tons were recycled. More than 50 million tons of paper were recovered for recycling in 2021, achieving a 68% recycling rate and 91.4% of corrugated cardboard was recycled. About 110 million glass bottles are thrown away every day in the U.S., of which only one-third get recycled as per the study done by the World Economic Forum.
The Food and Agriculture Organization of the United Nations in its latest report that the global volume of food wastage is estimated at 1.6 billion tonnes of "primary product equivalents." Total food wastage for the edible part of this amounts to 1.3 billion tonnes. Food wastage's carbon footprint is estimated at 3.3 billion tonnes of CO2 equivalent to GHG released into the atmosphere per year. Home composting can potentially divert up to 150 kg of food waste per household per year from local collection authorities.Developing countries suffer more food losses during agricultural production, while in middle- and high-income regions, food waste at the retail and consumer level tends to be higher. The direct economic consequences of food wastage (excluding fish and seafood) run to the tune of USD 750 billion annually.
Growing concerns of recycling industrial waste fueling the market
Municipal solid waste management (MSW), which is waste generated from companies, buildings, institutions, small businesses, houses, and yards, often comprises less than 5% of the total amount of waste produced in a country in 2021. For the same time period, between 30% and 35% of the total amount of generated waste in most developed countries is attributed to building sector activities such as building construction, renovation, and demolition processes, according to the official EU statistical data.
According to United Nations, every year, an estimated 11.2 billion tonnes of solid waste is collected worldwide and the decay of the organic proportion of solid waste is contributing to about 5% of global greenhouse gas emissions. It is estimated that less than 20% of global waste is recycled each year and rich countries often export recyclables to poorer nations. One-third of recyclables in the US are shipped abroad. The UK estimates that 46% of its recycling goes to countries like Turkey, Poland, and Malaysia.
Recycling rates fell across Europe, Asia, and the US since the onset of the COVID-19 pandemic. But the pandemic also produced a surplus amount of new waste in the forms of PPE and single-use items. A study from the Proceedings of the National Academy of Sciences (PNAS) showed that the pandemic generated over 8 million tons of plastic waste around the world and over 25,000 tons of that waste entered the ocean.
Waste Management Equipment Industry Overview
The Global waste management market's landscape is consolidated and highly competitive with many players focused on innovative technologies to recycle and reuse the waste generated across various industries and households across the globe. The global players leading the market are Recycling Equipment Manufacturing Inc, CP Manufacturing Inc, Dover Corporation, Morita Holding Corporation, Tomra Systems ASA, Wastequip LLC, Blue Group, KK Balers Ltd, Shred-Tech Corporation, and McNeilus Trucks and Manufacturing, Inc. There are also several startups coming up in the industry that are continuously focusing on waste reduction following the Zero Waste - 3R (Reduce, Reuse and Recycle) philosophy. There are also many mergers and acquisitions taking place across the market.
Additional Benefits:
- The market estimate (ME) sheet in Excel format
- 3 months of analyst support
TABLE OF CONTENTS
1 INTRODUCTION
- 1.1 Study Assumptions
- 1.2 Scope of the Study
2 RESEARCH METHODOLOGY
- 2.1 Analysis Method
- 2.2 Research Phases
3 EXECUTIVE SUMMARY
4 MARKET INSIGHTS DYNAMICS
- 4.1 Current Market Scenario
- 4.2 Market Overview
- 4.3 Market Dynamics
- 4.3.1 Drivers
- 4.3.2 Restraints
- 4.3.3 Opportunities
- 4.4 Value Chain / Supply Chain Analysis
- 4.5 Porter's Five Forces Analysis
- 4.5.1 Threat of New Entrants
- 4.5.2 Bargaining Power of Buyers/Consumers
- 4.5.3 Bargaining Power of Suppliers
- 4.5.4 Threat of Substitute Products
- 4.5.5 Intensity of Competitive Rivalry
- 4.6 Technological Advancements in Waste Management Equipment Market
- 4.7 Regional insights on Waste Management Equipment Market
- 4.8 Impact of COVID-19 on the market
5 MARKET SEGMENTATION
- 5.1 By Product Type
- 5.1.1 Waste Disposal Equipment
- 5.1.2 Waste Recycling & Sorting Equipment
- 5.2 By Waste Type
- 5.2.1 Hazardous
- 5.2.2 Non-Hazardous
- 5.3 By Application
- 5.3.1 Industrial Waste
- 5.3.2 Municipal Waste
- 5.3.3 Others
- 5.4 By Geography
- 5.4.1 North America
- 5.4.1.1 US
- 5.4.1.2 Canada
- 5.4.1.3 Mexico
- 5.4.2 Europe
- 5.4.2.1 Spain
- 5.4.2.2 Germany
- 5.4.2.3 France
- 5.4.2.4 UK
- 5.4.2.5 Portugal
- 5.4.2.6 Greece
- 5.4.2.7 Italy
- 5.4.2.8 Rest of Europe
- 5.4.3 Asia-Pacific
- 5.4.3.1 China
- 5.4.3.2 Japan
- 5.4.3.3 South Korea
- 5.4.3.4 India
- 5.4.3.5 Rest of Asia-Pacific
- 5.4.4 LAMEA
- 5.4.4.1 UAE
- 5.4.4.2 Saudi Arabia
- 5.4.4.3 Brazil
- 5.4.4.4 South Africa
- 5.4.4.5 Rest of LAMEA
- 5.4.1 North America
6 COMPETITIVE LANDSCAPE
- 6.1 Overview
- 6.2 Company Profiles
- 6.2.1 Recycling Equipment Manufacturing, Inc
- 6.2.2 Sierra International Machinery, LLC
- 6.2.3 CP Manufacturing, Inc.
- 6.2.4 Dover Corporation
- 6.2.5 Daiseki
- 6.2.6 Hitachi Zosen
- 6.2.7 Morita Holding Corporation
- 6.2.8 Tomra Systems ASA
- 6.2.9 Wastequip, LLC
- 6.2.10 Blue Group*


