


 |
市场调查报告书
商品编码
1683936
中国LED照明:市场占有率分析、产业趋势与统计、成长预测(2025-2030年)China LED Lighting - Market Share Analysis, Industry Trends & Statistics, Growth Forecasts (2025 - 2030) |
||||||
价格
※ 本网页内容可能与最新版本有所差异。详细情况请与我们联繫。
简介目录
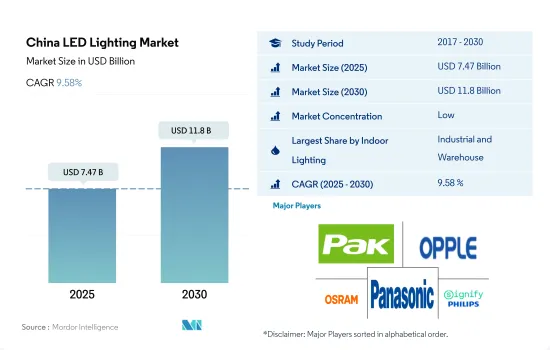
预计2025年中国LED照明市场规模为74.7亿美元,到2030年将达到118亿美元,预测期间(2025-2030年)的复合年增长率为9.58%。
新创公司数量的增加、製造设施数量的增加以及零售的成长预计将推动室内照明的需求。
- 到 2023 年,工业和仓储(I&W)将占据大部分份额(79.6%),其次是商业、农业和住宅。预计未来几年所有应用领域的市场占有率将略有下降,而工业和水务领域的市场份额将增加。中国工业面临多重内部和外部阻力,包括国内消费低迷、景气下降、以及新冠肺炎病例激增导致的供应链中断。此外,中国在 2021 年维持了工业生产。 2021 年,中国总产出为 4,8,658 亿美元,比 2020 年成长 26.04%。因此,工业产量的增加将在未来几年创造对室内照明的需求。
- 由于全球汽车市场依赖中国提供廉价的零件和整车供应商,中国各地对汽车製造厂和仓库的需求正在成长。鑑于这些案例,预计研究期间室内 LED 的需求将会上升。 BMW在渖阳开设了新工厂,奥迪在长春的新电动车工厂也开始生产。
- 中国零售业持续呈现强劲成长迹象,2023年5月零售业与前一年同期比较增12.7%。预计网路购物激增将推动该地区对新仓库的进一步需求,进而推动对室内照明的需求。
- 中国是全球最大的数十亿美元新兴企业生产国之一。 2022年,中国产生了74家新的独角兽企业,落后美国。约70%的新独角兽来自医疗保健和智慧物流领域,带动商业空间需求激增。根据上述案例,预计明年室内LED的需求将会增加。
中国LED照明市场趋势
稳定的出生率与住宅、小型企业和电动车的正成长相辅相成
- 2022年,中国总人口为14.1175亿人。 2022年,中国每1,000名成年人出生6.77名婴儿。随着年轻人口的稳定成长,2021年中国每年新建商业地产面积约1.4105亿平方公尺,2022年3月工工业部将再支持孵化3,000家小巨人企业。到2025年,中国要打造1,000家单项产品冠军企业和10,000家小巨人企业。商业和企业的成长推动了对更多 LED 的需求。
- 在中国社会经济底层,截至2019年,超过60%的居民拥有自己的房屋。与大城市的居民相比,拥有率相当高。在二、三线城市和城镇,41%的房主没有房屋抵押贷款。 2019年农村和都市区平均家庭户面积分别为48.9平方公尺和39.8平方公尺。 LED 使用量的增加可能受到住宅购买量增加的影响。
- 由于人口成长,截至2021年9月,中国的汽车持有为2.97亿辆。 2021年第三季机动车註册量为883万辆。 2021年,超过85%的电动车销量发生在中国。 2021年,中国电动车销量比全球其他地区(300万辆)多330万辆。到 2021 年,中国的电动车持有将达到 780 万辆,仍将是全球最大电动车保有量国家。随着电动车数量的不断增长,中国 LED 照明市场也将随之成长,带动对 LED 的需求增加。
人均所得成长补充家庭成长
- 2017年,中国平均家庭规模为3.03人。到2021年,这一数字将下降到2.7人,这意味着独栋住宅/住宅的数量将会增加。自1998年以来,现有公共住宅被私有化,大量供给以自有住宅为主的私人住房,使中国从一个公住宅占多数的国家转变为住房自有率最高的国家。到2020年,中国90%以上的家庭将拥有住宅(都市区为87%,农村为96%)。与许多富裕国家相比,超过20%的中国家庭拥有多处房产。因此,房地产数量的增加预计将推动该国采用LED满足照明需求。
- 中国的可支配收入正在增加,这反过来又增强了个人的消费能力,让他们有更多钱来购买新的居住空间。 2022年12月,中国的人均收入达到12,732.5美元,而2021年12月为12,615.7美元。截至2022年3月,印度的人均所得为2,301.4美元,低于中国。
- 据报道,2019年中国农村人均住宅占地面积为48,900平方米,高于前一年的47,300平方米。在都市区,由于对小型公寓/单间公寓的投资增加,公寓的平均面积从 2019 年的 39,800 平方米下降到 2020 年的 38,600 平方米。这推动了该国LED照明的发展。例如,中国人正在中国较小的城市投资廉价公寓。 2012年,中国家庭获得了22亿元人民币(3.1亿美元)的节能灯泡和LED灯使用计画。预计这种案例将增加该国对 LED 照明的需求。
中国LED照明产业概况
中国LED照明市场较为分散,前五大企业市占率合计为26.92%。该市场的主要企业有:广东百强企业、欧普照明、欧司朗有限公司、松下控股公司和 Signify(飞利浦)(按字母顺序排列)。
其他福利
- Excel 格式的市场预测 (ME) 表
- 3 个月的分析师支持
目录
第 1 章执行摘要和主要发现
第二章 报告要约
第三章 引言
- 研究假设和市场定义
- 研究范围
- 调查方法
第四章 产业主要趋势
- 汽车产量
- 人口
- 人均收入
- 汽车贷款利率
- 充电站数量
- 持有汽车数量
- LED进口总量
- 照明功耗
- #家庭数量
- 道路网络
- LED渗透率
- #体育场数量
- 园艺区
- 法律规范
- 室内照明
- 中国
- 户外照明
- 中国
- 汽车照明
- 中国
- 室内照明
- 价值炼和通路分析
第五章 市场区隔
- 室内照明
- 农业照明
- 商业照明
- 办公室
- 零售
- 其他的
- 工业/仓库
- 住宅照明
- 户外照明
- 公共设施
- 路
- 其他的
- 汽车实用照明
- 日间行车灯 (DRL)
- 方向指示器
- 头灯
- 倒车灯
- 红绿灯
- 尾灯
- 其他的
- 汽车照明
- 二轮车
- 商用车
- 搭乘用车
第六章 竞争格局
- 关键策略趋势
- 市场占有率分析
- 业务状况
- 公司简介(包括全球概况、市场层级概况、主要业务部门、财务状况、员工人数、关键资讯、市场排名、市场占有率、产品和服务、最新发展分析)
- ACUITY BRANDS, INC.
- Guangdong PAK Corporation Co.,Ltd.
- HELLA GmbH & Co. KGaA(FORVIA)
- KOITO MANUFACTURING CO., LTD.
- OPPLE Lighting Co., Ltd
- OSRAM GmbH.
- Panasonic Holdings Corporation
- Signify(Philips)
- Stanley Electric Co., Ltd.
- Valeo
第七章:执行长的关键策略问题
第 8 章 附录
- 世界概况
- 概述
- 五力分析框架
- 全球价值链分析
- 市场动态(DRO)
- 资讯来源及延伸阅读
- 图片列表
- 关键见解
- 资料包
- 词彙表
简介目录
Product Code: 50001634
The China LED Lighting Market size is estimated at 7.47 billion USD in 2025, and is expected to reach 11.8 billion USD by 2030, growing at a CAGR of 9.58% during the forecast period (2025-2030).
Growing star-ups, rising manufacturing facilities, and increasing retail sales are expected to raise the demand for indoor lighting
- In 2023, industrial and warehouse (I&W) accounted for the majority of the share (79.6%), followed by commercial, agricultural, and residential. The market share is expected to have a minimal reduction in all applications and a gain in (I&W) in the coming years. Chinese industries faced several internal and external headwinds, such as weak domestic consumption, declining business confidence, and supply chain disruptions caused by the surge of COVID-19. Further, China sustained its industrial production in 2021. In 2021, China produced a total of USD 4865.8 billion, an increase of 26.04% compared to 2020. Thus, the growing industrial production will create demand for Indoor lighting in the coming years.
- The demand for automotive manufacturing plants and warehouses across China is rising, and this is due to the global auto market relying on China because of its cheap components, source of finished cars, and others. Such instances necessitate more requirements for Indoor LEDs during the study period. BMW opened a new factory in the city of Shenyang, and Audi started production at a new EV factory in the city of Changchun.
- China's retail sector continues to show signs of robust growth, with retail sales surging by 12.7% in May 2023 from a year earlier. The rapid increase in online shoppers is further expected to boost the need for new warehouses in the region, resulting in more demand for indoor lighting.
- China is one of the top players in creating billion-dollar start-ups. In 2022, China added 74 new unicorns, falling behind the United States. Around 70% of its new unicorns come from the healthcare and smart logistics sectors, which surges the demand for commercial spaces. The above instances are expected to drive the demand for Indoor LEDs in the coming year.
China LED Lighting Market Trends
A steady birth rate is complementing the positive growth of homeowners, small and medium-sized businesses, and electric vehicles
- In 2022, China had a total population of 1,411.75 million. In China, 6.77 children were born for every 1,000 adults in 2022. With the steady growth of the youth, around 141.05 million sq. m of commercial real estate was being built each year in China in 2021. The incubation of an additional 3,000 small giant enterprises in the year was supported by the Ministry of Industry and Information Technology in March 2022. By 2025, China wants to have 1,000 single-product champion enterprises and 10,000 tiny giant businesses. The demand to use more LEDs will be driven by the growth in businesses and enterprises.
- In China's lower socioeconomic strata, as of 2019, more than 60% of residents were homeowners. In comparison to citizens of big cities, the ownership rate was substantially greater. In lower-tier cities and towns, 41% of homeowners did not have a mortgage on their home. In 2019, the average household size in rural and urban areas was 48.9 sq. m and 39.8 sq. m, respectively. The increased use of LEDs may be influenced by the rise in home purchases.
- Owing to the growing population, China had 297 million cars as of September 2021. Motor vehicle registrations totaled 8.83 million in the third quarter of 2021. In 2021, more than 85% of all electric vehicle sales took place in China. In 2021, China sold 3.3 million more electric vehicles than the rest of the world (3.0 million). With 7.8 million vehicles, China's electric car fleet continued to be the largest in the world in 2021. The requirement for additional LEDs will be facilitated by the rise in the LED lighting market in China due to the rise in the number of EVs.
The rising per capita income complements the growth of households
- The average household size in China registered 3.03 persons in 2017. By 2021, it reduced to 2.7, indicating an increase in private households/housing ownerships. After 1998, China went from being a nation dominated by public renters to one with the highest homeownership rates, owing to the privatization of existing public housing and the vast provision of private housing, primarily in the ownership sector. By 2020, more than 90% of households in China owned their homes (87% in urban areas and 96% in rural areas). In contrast to many affluent countries, more than 20% of Chinese households own several properties. Thus, the increase in the number of properties is expected to create more LED penetration for the need for illumination in the country.
- In China, disposable income is growing, resulting in the rising spending power of individuals who spend more money on new residential spaces. China's per capita income reached USD 12,732.5 in December 2022 compared to USD 12,615.7 in December 2021. India's per capita income was USD 2,301.4 as of Mar 2022, which is lower than China's.
- In China, the floor area of residential buildings per capita for rural areas was reported at 48.900 sq. m in 2019, an increase from the previous year of 47.300 sq. m. In urban areas, it was 38.600 sq. m in 2020, a decrease from 39.800 sq. m in 2019 due to an increase in the investment in small-size apartments/studio apartments. This is propelling the growth of LED lighting in the country. For instance, people in China invested in low-cost apartments in small Chinese cities. In 2012, households in China were offered a program of CNY 2.2 billion (USD 0.31 billion) for the use of energy-conserving light bulbs and LEDs. Such instances are expected to increase the demand for LED lighting in the country.
China LED Lighting Industry Overview
The China LED Lighting Market is fragmented, with the top five companies occupying 26.92%. The major players in this market are Guangdong PAK Corporation Co.,Ltd., OPPLE Lighting Co., Ltd, OSRAM GmbH., Panasonic Holdings Corporation and Signify (Philips) (sorted alphabetically).
Additional Benefits:
- The market estimate (ME) sheet in Excel format
- 3 months of analyst support
TABLE OF CONTENTS
1 EXECUTIVE SUMMARY & KEY FINDINGS
2 REPORT OFFERS
3 INTRODUCTION
- 3.1 Study Assumptions & Market Definition
- 3.2 Scope of the Study
- 3.3 Research Methodology
4 KEY INDUSTRY TRENDS
- 4.1 Automotive Production
- 4.2 Population
- 4.3 Per Capita Income
- 4.4 Interest Rate For Auto Loans
- 4.5 Number Of Charging Stations
- 4.6 Number Of Automobile On-road
- 4.7 Total Import Of Leds
- 4.8 Lighting Electricity Consumption
- 4.9 # Of Households
- 4.10 Road Networks
- 4.11 Led Penetration
- 4.12 # Of Stadiums
- 4.13 Horticulture Area
- 4.14 Regulatory Framework
- 4.14.1 Indoor Lighting
- 4.14.1.1 China
- 4.14.2 Outdoor Lighting
- 4.14.2.1 China
- 4.14.3 Automotive Lighting
- 4.14.3.1 China
- 4.14.1 Indoor Lighting
- 4.15 Value Chain & Distribution Channel Analysis
5 MARKET SEGMENTATION (includes market size in Value in USD and Volume, Forecasts up to 2030 and analysis of growth prospects)
- 5.1 Indoor Lighting
- 5.1.1 Agricultural Lighting
- 5.1.2 Commercial
- 5.1.2.1 Office
- 5.1.2.2 Retail
- 5.1.2.3 Others
- 5.1.3 Industrial and Warehouse
- 5.1.4 Residential
- 5.2 Outdoor Lighting
- 5.2.1 Public Places
- 5.2.2 Streets and Roadways
- 5.2.3 Others
- 5.3 Automotive Utility Lighting
- 5.3.1 Daytime Running Lights (DRL)
- 5.3.2 Directional Signal Lights
- 5.3.3 Headlights
- 5.3.4 Reverse Light
- 5.3.5 Stop Light
- 5.3.6 Tail Light
- 5.3.7 Others
- 5.4 Automotive Vehicle Lighting
- 5.4.1 2 Wheelers
- 5.4.2 Commercial Vehicles
- 5.4.3 Passenger Cars
6 COMPETITIVE LANDSCAPE
- 6.1 Key Strategic Moves
- 6.2 Market Share Analysis
- 6.3 Company Landscape
- 6.4 Company Profiles (includes Global level Overview, Market level overview, Core Business Segments, Financials, Headcount, Key Information, Market Rank, Market Share, Products and Services, and analysis of Recent Developments)
- 6.4.1 ACUITY BRANDS, INC.
- 6.4.2 Guangdong PAK Corporation Co.,Ltd.
- 6.4.3 HELLA GmbH & Co. KGaA (FORVIA)
- 6.4.4 KOITO MANUFACTURING CO., LTD.
- 6.4.5 OPPLE Lighting Co., Ltd
- 6.4.6 OSRAM GmbH.
- 6.4.7 Panasonic Holdings Corporation
- 6.4.8 Signify (Philips)
- 6.4.9 Stanley Electric Co., Ltd.
- 6.4.10 Valeo
7 KEY STRATEGIC QUESTIONS FOR LED CEOS
8 APPENDIX
- 8.1 Global Overview
- 8.1.1 Overview
- 8.1.2 Porter's Five Forces Framework
- 8.1.3 Global Value Chain Analysis
- 8.1.4 Market Dynamics (DROs)
- 8.2 Sources & References
- 8.3 List of Tables & Figures
- 8.4 Primary Insights
- 8.5 Data Pack
- 8.6 Glossary of Terms
02-2729-4219
+886-2-2729-4219
 LED 照明和 OLED 照明:市场分析和製造趋势
 LED嵌灯市场报告:按应用和地区划分(2026-2034年)
 LED照明市场:2026-2032年全球市场预测(依产品类型、安装方式、技术、应用、最终用户及通路划分)相机LED照明市场:2026-2032年全球市场预测(依产品类型、照明类型、应用、最终用户及通路划分)
 2026-2030年全球LED照明市场LED面板灯市场:按安装方式、面板尺寸、产品类型、色温、应用和分销管道划分-全球预测,2026-2032年橱柜LED照明市场:依产品类型、安装类型、安装方式、应用、通路和最终用途划分-2026-2032年全球预测LED灯带控制器市场按应用、颜色类型、控制技术、分销管道、控制方式、安装方式和电压类型划分,全球预测(2026-2032年)
 柔性照明箔市场规模、份额和成长分析:按产品类型、材料类型、应用、最终用户、分销管道、地区和行业预测,2026-2033年
 LED照明市场分析及预测(至2035年):按类型、产品类型、服务、技术、组件、应用、形状、材质、最终用户和功能划分
▼