


 |
市场调查报告书
商品编码
1684033
普通波特兰水泥:市场占有率分析、行业趋势和成长预测(2025-2030 年)Ordinary Portland Cement - Market Share Analysis, Industry Trends & Statistics, Growth Forecasts (2025 - 2030) |
||||||
价格
※ 本网页内容可能与最新版本有所差异。详细情况请与我们联繫。
简介目录
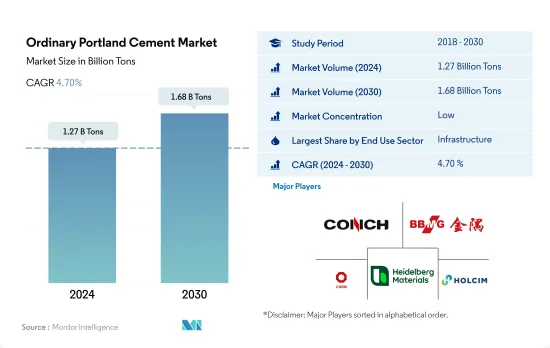
普通波特兰水泥市场规模预计在2024年为12.7亿吨,预计到2030年将达到16.8亿吨,预测期内(2024-2030年)的复合年增长率为4.70%。
基础设施支出的增加可能会推动对普通波特兰水泥的需求。
- 在2022年的全球水泥市场中,普通波特兰水泥(OPC)占了29.18%的较大市场占有率。受住宅和基础设施建设行业需求增长的推动,预计 2023 年 OPC消费量将增长 0.81%。
- 2022年,基础建设成为OPC的主要消费者,占近一半的市场份额(47.91%)。在投资增加的推动下,预计2023年全球基础建设支出将达到2.78兆美元。美国特别计画到2025年拨款1.2兆美元,其中包括透过《基础建设投资和就业法案》拨款5,500亿美元。这些资金将用于各种计划,包括道路、桥樑、铁路、智慧基础设施、宽频和电动车。因此,基础设施领域的OPC需求预计将从2023年的5.7676亿吨飙升至2030年的7.7892亿吨。
- 商业领域将成为 OPC 成长最快的消费者,预测期内复合年增长率将达到 6.30%。预计到2024年,对购物中心、办公室和其他商业设施的需求不断增长将推动全球新增3.01亿平方英尺的商业占地面积。例如,印尼计画在2025年竣工六个购物中心计划,总合面积达29.2万平方公尺。因此,预计到 2030 年全球 OPC 需求将比 2023 年的水准增加 5,652 万吨。
预测期内,普通波特兰水泥的消费量预计将由中东和非洲主导。
- 2022年全球一般波特兰水泥消费量与前一年同期比较%。下降的主要原因是亚太地区消费量下降了5.72%。建设产业面临阻力,通货膨胀飙升,原物料价格上涨,景气衰退迫在眉睫。除了这些因素之外,投资放缓和计划延迟也抑制了普通波特兰水泥的需求。不过,预计 2023 年将出现温和復苏,消费量预计将成长 0.81%。这一增长主要受预计欧洲需求增长 5.69% 的推动。
- 到2022年,亚太地区将成为一般波特兰水泥的主要消费地区,占全球需求的70.71%。值得注意的是,中国、日本和印度等国家在塑造这项需求方面发挥了关键作用。中国对交通基础设施的投资从2021年的1,576亿美元增加到2022年的1,656亿美元。日本製造业设施建设激增,而印度则专注于透过公路、铁路和高速公路计划加强连结性。
- 中东和非洲将成为普通波特兰水泥消费量成长最快的地区,预计预测期内复合年增长率将达到 6.98%。阿联酋表现突出,2021年至2022年基础建设投资激增82%。到2022年,沙乌地阿拉伯和阿联酋将分别占全球消费量的11%和3%。特别是沙乌地阿拉伯雄心勃勃的「2030愿景」和价值约26.6亿美元的投资基金协议,凸显了沙乌地阿拉伯王国对发展商业、旅游和住宅计划的承诺。
普通波特兰水泥的全球市场趋势
亚太地区大型办公大楼建设计划的激增将推动全球商业建筑占地面积的增加。
- 2022年,全球商业建筑占地面积预计与前一年同期比较仅小幅成长0.15%。欧洲表现突出,增幅达 12.70%,这得益于欧洲大力推行节能办公大楼,以实现 2030 年二氧化碳排放目标。随着员工重返办公室,欧洲公司正在重新签订租约,刺激 2022 年新办公大楼建设面积达到 450 万平方英尺。预计这一势头将在 2023 年持续下去,全球成长率预计为 4.26%。
- 新冠疫情造成劳动力和材料短缺,导致商业建筑计划取消和延迟。然而,随着停工缓解和建设活动恢復,2021 年全球新增商业占地面积飙升 11.11%,其中亚太地区以 20.98% 的成长率领先。
- 展望未来,全球新增商业占地面积的复合年增长率将达到4.56%。预计亚太地区的复合年增长率将达到 5.16%,超过其他地区。这一增长背后的驱动力是中国、印度、韩国和日本商业建筑计划的活性化。尤其北京、上海、香港、台北等中国主要城市的甲级办公室建设正在加速。此外,印度计划于 2023 年至 2025 年间在七大城市开设约 60 家购物中心,总面积约 2,325 万平方英尺。总合到 2030 年,亚太地区的这些措施将比 2022 年增加 15.6 亿平方英尺的新零售占地面积。
预计南美洲的住宅将出现最快的成长,这得益于政府加大对经济适用住宅计画的投资,这将推动全球住宅产业的发展。
- 2022年,全球新建住宅占地面积与2021年相比减少了约2.89亿平方英尺。这是由于土地稀缺、劳动力短缺以及建筑材料价格不可持续的高企造成的住宅危机。这场危机对亚太地区造成了严重影响,2022 年新占地面积与 2021 年相比下降了 5.39%。不过,2023 年的前景更加光明,预计全球新建占地面积将比 2022 年增长 3.31%,这要归功于政府投资,这些投资可以为 2030 年之前 30 亿人建造新的经济适用住宅提供资金。
- 新冠疫情造成经济放缓,导致大量住宅建设计划取消或延后,2020年全球新建占地面积较2019年下降4.79%。随着2021年限制措施的解除,住宅计划被压抑的需求得到释放,2021年全球新建占地面积较2020年增长11.22%,其中欧洲增幅最高,为18.28%,其次是南美洲,2021年较2020年增长17.36%。
- 预测期内,全球住宅新占地面积预计复合年增长率为 3.81%,其中南美洲的复合年增长率最快,为 4.05%。巴西的「Minha Casa Minha Vida」计画于2023年宣布实施,是政府投资19.8亿美元为低收入家庭提供经济适用住宅的计画;智利的「FOGAES」计画也于2023年宣布实施,初始投资额为5,000万美元。
普通波特兰水泥产业概况
普通波特兰水泥市场分散,前五大公司占34.16%的市占率。市场的主要企业有:安徽海螺水泥股份有限公司、北京金隅集团、中国建筑材料集团公司、海德堡材料和霍尔希姆。
其他福利
- Excel 格式的市场预测 (ME) 表
- 3个月的分析师支持
目录
第一章执行摘要和主要发现
第二章 报告要约
第三章 引言
- 研究假设和市场定义
- 研究范围
- 调查方法
第四章 产业主要趋势
- 最终用途趋势
- 商业
- 工业/设施
- 基础设施
- 住宅
- 重大基础设施计划(目前和已宣布)
- 法律规范
- 价值炼和通路分析
第五章市场区隔
- 最终用途部门
- 商业
- 工业/设施
- 基础设施
- 住宅
- 地区
- 亚太地区
- 按国家
- 澳洲
- 中国
- 印度
- 印尼
- 日本
- 马来西亚
- 韩国
- 泰国
- 越南
- 其他亚太地区
- 欧洲
- 按国家
- 法国
- 德国
- 义大利
- 俄罗斯
- 西班牙
- 英国
- 其他欧洲国家
- 中东和非洲
- 按国家
- 沙乌地阿拉伯
- 阿拉伯聯合大公国
- 其他中东和非洲地区
- 北美洲
- 按国家
- 加拿大
- 墨西哥
- 美国
- 南美洲
- 按国家
- 阿根廷
- 巴西
- 南美洲其他地区
- 亚太地区
第六章竞争格局
- 关键策略趋势
- 市场占有率分析
- 业务状况
- 公司简介
- Anhui Conch Cement Company Limited
- BBMG Corporation
- CEMEX, SAB de CV
- China National Building Material Group Corporation
- Dangote Cement Plc.
- Heidelberg Materials
- Holcim
- SIG
- UltraTech Cement Ltd.
- Votorantim Cimentos
第 7 章 CEO 的关键策略问题CEO 的关键策略问题
第 8 章 附录
- 世界概况
- 概述
- 五力分析框架(产业吸引力分析)
- 全球价值链分析
- 市场动态(DRO)
- 资讯来源及延伸阅读
- 图片列表
- 关键见解
- 资料包
- 词彙表
简介目录
Product Code: 50001940
The Ordinary Portland Cement Market size is estimated at 1.27 billion Tons in 2024, and is expected to reach 1.68 billion Tons by 2030, growing at a CAGR of 4.70% during the forecast period (2024-2030).
Rising infrastructure spending is likely to drive the demand for ordinary Portland cement
- In 2022, the global cement market saw ordinary Portland cement (OPC) dominate, capturing a significant 29.18% market share. The consumption of OPC was projected to grow by 0.81% in 2023, driven by rising demand from the residential and infrastructure construction sectors.
- Infrastructure emerged as the leading consumer of OPC in 2022, accounting for nearly half (47.91%) of the market. Global infrastructure spending was set to hit USD 2.78 trillion in 2023, buoyed by increased investments. Notably, the United States plans to allocate USD 1.2 trillion by 2025, including USD 550 billion from the Infrastructure Investment and Jobs Act. These funds will be channeled into diverse projects like roads, bridges, rail, smart infrastructure, broadband, and electric vehicles. Consequently, OPC demand for the infrastructure sector is projected to surge from 576.76 million tons in 2023 to 778.92 million tons in 2030.
- The commercial segment is poised to be the fastest-growing consumer of OPC, with a robust CAGR of 6.30% during the forecast period. The global new floor area for commercial spaces is projected to rise by 301 million sq. ft in 2024, driven by heightened demand for shopping malls, offices, and other commercial establishments. For instance, Indonesia has six shopping mall projects slated for completion by 2025, adding up to a combined area of 292 thousand sq. meters. Consequently, the global OPC demand for the commercial sector is anticipated to climb by 56.52 million tons by 2030, compared to the levels seen in 2023.
The Middle East & Africa is expected to lead in terms of consumption volume of ordinary Portland cement during the forecast period
- In 2022, the global consumption of ordinary Portland cement dipped by 3.14% compared to the previous year. This decline was largely driven by a 5.72% drop in consumption from Asia-Pacific. The construction industry faced headwinds, grappling with surging inflation, soaring raw material prices, and an impending recession. These factors, coupled with a pullback in investments and project delays, weighed on the demand for ordinary Portland cement. However, in 2023, they anticipated a modest rebound, with consumption projected to inch up by 0.81%. This uptick is primarily driven by a projected 5.69% surge in demand from Europe.
- Asia-Pacific emerged as the dominant consumer of ordinary Portland cement in 2022, accounting for a significant 70.71% of the global demand. Notably, countries like China, Japan, and India played pivotal roles in shaping this demand. China's investment in transport infrastructure rose from USD 157.6 billion in 2021 to USD 165.6 billion in 2022. Japan witnessed a surge in manufacturing facility constructions, while India focused on bolstering its connectivity through road, rail, and highway projects.
- The Middle East & Africa is poised to witness the swiftest growth in ordinary Portland cement consumption, with a projected CAGR of 6.98% during the forecast period. The United Arab Emirates stood out, with an 82% surge in infrastructure investments from 2021 to 2022. In 2022, Saudi Arabia and the UAE accounted for 11% and 3% of global consumption, respectively. Notably, Saudi Arabia's ambitious Vision 2030 and its agreements, including those worth nearly USD 2.66 billion for investment funds, underscore its commitment to developing commercial, tourism, and residential projects.
Global Ordinary Portland Cement Market Trends
Asia-Pacific's surge in large-scale office building projects is set to elevate the global floor area dedicated to commercial construction
- In 2022, the global new floor area for commercial construction witnessed a modest growth of 0.15% from the previous year. Europe stood out with a significant surge of 12.70%, driven by a push for high-energy-efficient office buildings to align with its 2030 carbon emission targets. As employees returned to offices, European companies, resuming lease decisions, spurred the construction of 4.5 million square feet of new office space in 2022. This momentum is poised to persist in 2023, with a projected global growth rate of 4.26%.
- The COVID-19 pandemic caused labor and material shortages, leading to cancellations and delays in commercial construction projects. However, as lockdowns eased and construction activities resumed, the global new floor area for commercial construction surged by 11.11% in 2021, with Asia-Pacific taking the lead with a growth rate of 20.98%.
- Looking ahead, the global new floor area for commercial construction is set to achieve a CAGR of 4.56%. Asia-Pacific is anticipated to outpace other regions, with a projected CAGR of 5.16%. This growth is fueled by a flurry of commercial construction projects in China, India, South Korea, and Japan. Notably, major Chinese cities like Beijing, Shanghai, Hong Kong, and Taipei are gearing up for an uptick in Grade A office space construction. Additionally, India is set to witness the opening of approximately 60 shopping malls, spanning 23.25 million square feet, in its top seven cities between 2023 and 2025. Collectively, these endeavors across Asia-Pacific are expected to add a staggering 1.56 billion square feet to the new floor area for commercial construction by 2030, compared to 2022.
South America's estimated fastest growth in residential constructions due to increasing government investments in schemes for affordable housing to boost the global residential sector
- In 2022, the global new floor area for residential construction declined by around 289 million square feet compared to 2021. This can be attributed to the housing crisis generated due to the shortage of land, labor, and unsustainably high construction materials prices. This crisis severely impacted Asia-Pacific, where the new floor area declined 5.39% in 2022 compared to 2021. However, a more positive outlook is expected in 2023 as the global new floor area is predicted to grow by 3.31% compared to 2022, owing to government investments that can finance the construction of new affordable homes capable of accommodating 3 billion people by 2030.
- The COVID-19 pandemic caused an economic slowdown, due to which many residential construction projects got canceled or delayed, and the global new floor area declined by 4.79% in 2020 compared to 2019. As the restrictions were lifted in 2021 and pent-up demand for housing projects was released, new floor area grew 11.22% compared to 2020, with Europe having the highest growth of 18.28%, followed by South America, which rose 17.36% in 2021 compared to 2020.
- The global new floor area for residential construction is expected to register a CAGR of 3.81% during the forecast period, with South America predicted to develop at the fastest CAGR of 4.05%. Schemes and initiatives like the Minha Casa Minha Vida in Brazil announced in 2023 with a few regulatory changes, for which the government plans an investment of USD 1.98 billion to provide affordable housing units for low-income families, and the FOGAES in Chile also publicized in 2023, with an initial investment of USD 50 million, are aimed at providing mortgage loans to families for affordable housing and will encourage the construction of new residential units.
Ordinary Portland Cement Industry Overview
The Ordinary Portland Cement Market is fragmented, with the top five companies occupying 34.16%. The major players in this market are Anhui Conch Cement Company Limited, BBMG Corporation, China National Building Material Group Corporation, Heidelberg Materials and Holcim (sorted alphabetically).
Additional Benefits:
- The market estimate (ME) sheet in Excel format
- 3 months of analyst support
TABLE OF CONTENTS
1 EXECUTIVE SUMMARY & KEY FINDINGS
2 REPORT OFFERS
3 INTRODUCTION
- 3.1 Study Assumptions & Market Definition
- 3.2 Scope of the Study
- 3.3 Research Methodology
4 KEY INDUSTRY TRENDS
- 4.1 End Use Sector Trends
- 4.1.1 Commercial
- 4.1.2 Industrial and Institutional
- 4.1.3 Infrastructure
- 4.1.4 Residential
- 4.2 Major Infrastructure Projects (current And Announced)
- 4.3 Regulatory Framework
- 4.4 Value Chain & Distribution Channel Analysis
5 MARKET SEGMENTATION (includes market size, forecasts up to 2030 and analysis of growth prospects.)
- 5.1 End Use Sector
- 5.1.1 Commercial
- 5.1.2 Industrial and Institutional
- 5.1.3 Infrastructure
- 5.1.4 Residential
- 5.2 Region
- 5.2.1 Asia-Pacific
- 5.2.1.1 By Country
- 5.2.1.1.1 Australia
- 5.2.1.1.2 China
- 5.2.1.1.3 India
- 5.2.1.1.4 Indonesia
- 5.2.1.1.5 Japan
- 5.2.1.1.6 Malaysia
- 5.2.1.1.7 South Korea
- 5.2.1.1.8 Thailand
- 5.2.1.1.9 Vietnam
- 5.2.1.1.10 Rest of Asia-Pacific
- 5.2.2 Europe
- 5.2.2.1 By Country
- 5.2.2.1.1 France
- 5.2.2.1.2 Germany
- 5.2.2.1.3 Italy
- 5.2.2.1.4 Russia
- 5.2.2.1.5 Spain
- 5.2.2.1.6 United Kingdom
- 5.2.2.1.7 Rest of Europe
- 5.2.3 Middle East and Africa
- 5.2.3.1 By Country
- 5.2.3.1.1 Saudi Arabia
- 5.2.3.1.2 United Arab Emirates
- 5.2.3.1.3 Rest of Middle East and Africa
- 5.2.4 North America
- 5.2.4.1 By Country
- 5.2.4.1.1 Canada
- 5.2.4.1.2 Mexico
- 5.2.4.1.3 United States
- 5.2.5 South America
- 5.2.5.1 By Country
- 5.2.5.1.1 Argentina
- 5.2.5.1.2 Brazil
- 5.2.5.1.3 Rest of South America
- 5.2.1 Asia-Pacific
6 COMPETITIVE LANDSCAPE
- 6.1 Key Strategic Moves
- 6.2 Market Share Analysis
- 6.3 Company Landscape
- 6.4 Company Profiles
- 6.4.1 Anhui Conch Cement Company Limited
- 6.4.2 BBMG Corporation
- 6.4.3 CEMEX, S.A.B. de C.V.
- 6.4.4 China National Building Material Group Corporation
- 6.4.5 Dangote Cement Plc.
- 6.4.6 Heidelberg Materials
- 6.4.7 Holcim
- 6.4.8 SIG
- 6.4.9 UltraTech Cement Ltd.
- 6.4.10 Votorantim Cimentos
7 KEY STRATEGIC QUESTIONS FOR CONCRETE, MORTARS AND CONSTRUCTION CHEMICALS CEOS
8 APPENDIX
- 8.1 Global Overview
- 8.1.1 Overview
- 8.1.2 Porter's Five Forces Framework (Industry Attractiveness Analysis)
- 8.1.3 Global Value Chain Analysis
- 8.1.4 Market Dynamics (DROs)
- 8.2 Sources & References
- 8.3 List of Tables & Figures
- 8.4 Primary Insights
- 8.5 Data Pack
- 8.6 Glossary of Terms
02-2729-4219
+886-2-2729-4219
 2026年全球波特兰水泥市场报告
 全球波特兰水泥市场:市场规模、占有率、成长率、产业分析、依类型、应用和地区划分的分析以及未来预测(2026-2034)
 波特兰水泥市场机会、成长动力、产业趋势分析及 2025 - 2034 年预测