


 |
市场调查报告书
商品编码
1684057
亚太水泥 -市场占有率分析、产业趋势和成长预测(2025-2030 年)Asia-Pacific Cement - Market Share Analysis, Industry Trends & Statistics, Growth Forecasts (2025 - 2030) |
||||||
价格
※ 本网页内容可能与最新版本有所差异。详细情况请与我们联繫。
简介目录
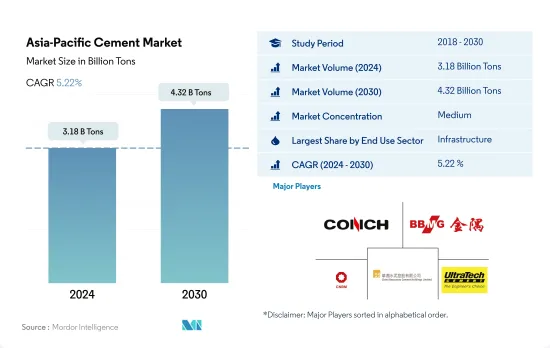
亚太水泥市场规模预计在2024年为31.8亿吨,预计到2030年将达到43.2亿吨,预测期内(2024-2030年)的复合年增长率为5.22%。
亚太地区的基础设施支出预计将达到1.74兆美元,这可能会推动水泥需求。
- 2022年该地区水泥消费量较去年与前一年同期比较下降6.37%。下降的主要原因是商业、住宅和工业/机构部门的新占地面积下降。其中,2022年工业及机构及住宅领域新建占地面积分别较2021年下降5.63%及5.39%。至2023年,亚太地区将占全球水泥市场的约72.53%。
- 预计基础设施产业将成为该地区最大的水泥消费产业,到2022年将占到39.48%左右。随着基础设施项目投资的增加,该行业对水泥的需求预计将会增加。例如,印度的目标是到2030年将基础建设投资达到4.5兆美元。预测显示,到2030年该地区的基础设施投资将达到1.74兆美元,其中2023年至2030年期间水泥产业的成长率为16.03%。
- 商业部门将成为该地区成长最快的水泥消费部门,预计预测期内复合年增长率为 6.48%。预计该地区对购物中心和办公室等商业空间的需求将大幅增加。预计到 2025 年该地区将出现显着增长,新商业占地面积与前一年同期比较增加 1.78 亿平方英尺。例如,印尼计划在2025年建成6个购物中心计划,总面积达29.2万平方公尺。由于这些趋势,该地区的商业水泥市场预计将从 2022 年的约 3.36 亿吨增长到 2030 年的 5.23 亿吨。
虽然越南将成为成长最快的国家,但预计中国将在预测期内保持在亚太地区的领先地位。
- 2022年,亚太地区水泥需求预计将与前一年同期比较减6.4%,主要原因是该地区主要国家中国的需求下降11.3%。预计2023年该地区部分国家的需求将略有下降,预计整体成长率与2022年相比为负0.4%。
- 中国的建筑产量一直居高不下,是亚太地区最大的水泥消费国。值得注意的是,到2022年,光是基础设施领域就将占亚太地区水泥总需求的79%。然而,由于房地产行业的挑战和新基础设施计划的减少,预计中国水泥需求将在预测期内(2023-2030年)下降。
- 继中国之后,印度已成为亚太地区第二大水泥消费国。印度住宅领域占水泥需求的很大一部分,到2022年将占该产业总需求的61%。与其他地区不同,印度主要依赖混凝土进行建筑,这导致水泥需求增加。
- 在该地区的国家中,越南预计将出现最高的水泥需求成长,预测期内水泥需求量的复合年增长率为 7.46%。需求激增可归因于促进房地产开发的新土地政策,以及政府在2030年建造100万套经济适用住宅的雄心勃勃的计划。
亚太水泥市场趋势
印度及其他地区零售和办公空间的成长推动了亚太商业建筑业的发展
- 2022年亚太地区零售新增占地面积与前一年同期比较去年同期下降3.23%。造成这项挫折的因素包括监管压力、通货膨胀上升和抵押房屋抵押贷款利率飙升等。预计到 2023 年,该地区将復苏,新增商业占地面积约 1.46 亿平方英尺。激增的主要原因是外国直接投资(FDI)增加,刺激了对新办公室、仓库、零售店和其他设施的需求。其中,预计2023年越南建筑业将吸引7,144万美元的外国直接投资。
- 2020 年,亚太地区新零售占地面积遭遇重大挫折,与 2019 年相比下降了 21.92%。下降的主要原因是政府大规模封锁扰乱了计划工作,并严重影响了供应链、设施和劳动力。然而,随着限制的放宽,该地区出现了显着的復苏,2021 年新的商业占地面积跃升 20.98%,达到约 5.26 亿平方英尺的占地面积。
- 预计亚太地区新商业占地面积将大幅成长,预计 2030 年将比 2023 年增加 14.1 亿平方英尺。这一增长是由对购物中心、办公空间和零售店不断增长的需求所推动的。亚太地区已成为世界零售强国,贡献了全球零售成长的近四分之三。例如,印度前七大城市的甲级办公大楼市场规模到 2026 年可能成长至 10 亿平方英尺,到 2030 年可能成长至 12 亿平方英尺。整体而言,预测期内亚太地区新商业占地面积预计复合年增长率为 5.16%。
印度的经济适用住宅将会增加,到2030年可能达到2,500万套,该地区的住宅建设也将扩大。
- 2022年亚太地区住宅占地面积与前一年同期比较%。在新冠疫情期间建筑活动激增之后,该行业正逐渐恢復正常,而此次建筑活动数量出现下降。该地区住宅产业的发展受到人口成长、富裕程度提高和都市化快速发展的推动。预计 2023 年该地区新住宅占地面积将比 2022 年增加 4.1 亿平方英尺。
- 2020年,亚太地区新建住宅占地面积较2019年下降约5.06%。这主要是由于政府封锁、供应链中断、劳动力短缺、建筑生产力放缓以及外国投资低迷。然而,随着限制措施的放宽,该地区出现了强劲復苏,由于新房屋建设增加,2021 年新住宅住宅占地面积激增约 14 亿平方英尺。例如,仅在 2021 年,印度住宅房地产市场将在前七大城市推出约 163,000 套住宅。
- 预计预测期内亚太地区住宅新建占地面积的复合年增长率将达到 3.98%。这一增长是由于住宅需求、投资增加和政府的优惠政策所致。预计建造更多经济适用住宅的重点将振兴该地区的住宅建筑业并推动其復苏。到 2030 年,预计印度将有超过 40% 的人口居住在都市区,这将需要额外 2,500 万套经济适用住宅。预计需求激增将有助于印度住宅房地产市场在 2030 年达到 150 万套。
亚太地区水泥产业概况
亚太水泥市场适度整合,前五大公司占50.04%。该市场的主要企业有:安徽海螺水泥股份有限公司、北京金隅集团、中国建筑材料集团公司、华润水泥控股和UltraTech Cement Ltd.(按字母顺序排列)。
其他福利
- Excel 格式的市场预测 (ME) 表
- 3个月的分析师支持
目录
第一章执行摘要和主要发现
第二章 报告要约
第三章 引言
- 研究假设和市场定义
- 研究范围
- 调查方法
第四章 产业主要趋势
- 最终用途趋势
- 商业
- 工业/设施
- 基础设施
- 住宅
- 重大基础设施计划(目前和已宣布)
- 法律规范
- 价值炼和通路分析
第五章市场区隔
- 最终用途部门
- 商业
- 工业/设施
- 基础设施
- 住宅
- 产品
- 混合水泥
- 纤维水泥
- 普通波特兰水泥
- 白水泥
- 其他的
- 国家
- 澳洲
- 中国
- 印度
- 印尼
- 日本
- 马来西亚
- 韩国
- 泰国
- 越南
- 其他亚太地区
第六章竞争格局
- 关键策略趋势
- 市场占有率分析
- 商业状况
- 公司简介
- Adani Group
- Anhui Conch Cement Company Limited
- BBMG Corporation
- China National Building Material Group Corporation
- China Resource Cement Holdings
- SCG
- SIG
- TAIWAN CEMENT LTD.
- UltraTech Cement Ltd.
- Vietnam National Cement Corporation
第 7 章 CEO 的关键策略问题CEO 的关键策略问题
第 8 章 附录
- 世界概况
- 概述
- 五力分析框架(产业吸引力分析)
- 全球价值链分析
- 市场动态(DRO)
- 资讯来源及延伸阅读
- 图片列表
- 关键见解
- 资料包
- 词彙表
简介目录
Product Code: 50002010
The Asia-Pacific Cement Market size is estimated at 3.18 billion Tons in 2024, and is expected to reach 4.32 billion Tons by 2030, growing at a CAGR of 5.22% during the forecast period (2024-2030).
Infrastructure spending in Asia-Pacific is expected to reach USD 1.74 trillion and is likely to drive the demand for cement
- In 2022, the cement consumption volume in the region saw a 6.37% decline from the previous year. This drop was primarily driven by reduced new floor area constructions in the commercial, residential, and industrial & institutional sectors. Notably, the industrial & institutional, and residential sectors saw a 5.63% and 5.39% decrease in new floor area, respectively, in 2022, compared to 2021. By 2023, Asia-Pacific accounted for approximately 72.53% of the global cement market.
- The infrastructure sector emerged as the region's largest cement consumer, representing about 39.48% in 2022. With increased investments in infrastructure projects, this sector's cement demand is expected to rise. For instance, India has set its sights on a USD 4.5 trillion infrastructure investment by 2030. Projections indicate that infrastructure spending in the region will hit USD 1.74 trillion by 2030, propelling the cement sector to a 16.03% growth from 2023 to 2030.
- The commercial sector is poised to be the region's fastest-growing cement consumer, with a projected CAGR of 6.48% during the forecast period. The region is poised to experience a significant uptick in demand for commercial spaces, including shopping malls and offices. In 2025, the region is projected to witness a notable surge, adding 178 million sq. ft of new commercial floor area, compared to the previous year. For example, Indonesia has six shopping mall projects slated for completion by 2025, adding up to a total of 292 thousand sq. meters. These trends indicate that the cement market for the commercial sector in the region is set to reach 523 million tons in 2030, up from around 336 million tons in 2022.
Vietnam is the fastest-growing country, while China is expected to maintain its leading position in Asia-Pacific during the forecast period
- In 2022, the demand for cement in Asia-Pacific dropped by 6.4% compared to the previous year, primarily driven by an 11.3% decline in demand from China, which is the region's dominant player. Several countries in the region were expected to see a slight dip in demand in 2023, and the overall growth was projected to be negative, at -0.4%, compared to 2022.
- China, with its consistently high construction output, stands as the largest cement consumer in Asia-Pacific. Notably, in 2022, its infrastructure sector alone accounted for 79% of the region's total cement demand in that sector. However, China's cement demand is anticipated to decline during the forecast period (2023-2030) due to challenges in the real estate industry and a decrease in new infrastructure projects.
- Following China, India emerges as the second-largest consumer of cement in Asia-Pacific. The residential sector in India holds the major share of cement demand, representing 61% of the total demand across sectors in 2022. Unlike some of its regional counterparts, India predominantly relies on concrete for its buildings, driving up the demand for cement.
- Among the countries in the region, Vietnam is projected to witness the highest growth in the demand for cement, and it is expected to register a CAGR of 7.46% by volume during the forecast period. This surge in demand is likely to be attributed to new land policies that bolster real estate development and the government's ambitious plan to construct 1 million affordable housing units by 2030.
Asia-Pacific Cement Market Trends
Rising retail and office spaces in countries such as India to boost the Asia-Pacific commercial construction sector
- In 2022, Asia-Pacific witnessed a 3.23% decline in its commercial new floor area compared to the previous year. This setback was attributed to factors such as regulatory pressures, higher inflation, and a surge in mortgage rates. In 2023, the region rebounded, with commercial construction new floor area increasing by approximately 146 million sq. ft. This surge was primarily driven by a rise in foreign direct investment (FDI), which spurred the demand for new offices, warehouses, retail outlets, and other facilities. Notably, the Vietnamese construction sector attracted an FDI capital of USD 71.44 million in 2023.
- In 2020, the Asia-Pacific region experienced a significant setback in commercial new floor area, with a volume decline of 21.92% compared to 2019. This decline was primarily due to widespread government lockdowns, which disrupted project work and severely impacted supply chains, equipment, and labor. However, as restrictions eased, the region witnessed a remarkable rebound, with its commercial new floor area surging by 20.98% in 2021, reaching a volume of approximately 526 million sq. ft.
- Asia-Pacific's commercial new floor area is projected to witness substantial growth, with an estimated increase of 1.41 billion sq. ft by 2030 compared to 2023. This surge is fueled by a rising demand for shopping malls, office spaces, retail outlets, and more. The Asia-Pacific region is emerging as a global retail powerhouse, contributing to nearly three-quarters of the worldwide retail growth. For instance, the Indian Grade A office market in its top seven cities may to expand to 1 billion sq. ft by 2026 and further to 1.2 billion sq. ft. by 2030. Overall, the commercial new floor area in Asia-Pacific is projected to witness a volume CAGR of 5.16% during the forecast period.
Rising affordable housing units, such as India's likely to reach 25 million by 2030, to augment the residential constructions in the region
- In 2022, the residential new floor area in the Asia-Pacific region saw a volume decline of approximately 5.39% from the previous year. This dip was a result of the sector normalizing after a surge in building activity during the COVID-19 pandemic. The region's residential sector is driven by a growing population, increasing wealth, and rapid urbanization. The residential new floor area in the region was expected to rise by 410 million sq. ft in 2023 compared to 2022.
- In 2020, the residential new floor area in Asia-Pacific declined in volume by around 5.06% compared to 2019. This was primarily due to government-imposed lockdowns, disruptions in the supply chain, labor shortages, reduced construction productivity, and low foreign investments. However, as restrictions eased, the region saw a significant rebound, with the residential new floor area surging by about 1.4 billion sq. ft in 2021, driven by the addition of new residential housing units. For instance, in 2021 alone, the Indian residential real estate market introduced approximately 163 thousand new residential units across its top seven cities.
- The residential new floor area in the Asia-Pacific region is projected to witness a CAGR of 3.98% during the forecast period. This growth can be attributed to the demand for housing, increased investments, and favorable government policies. The focus on constructing more affordable housing units is expected to rejuvenate the residential construction sector in the region, aiding its recovery. By 2030, it is estimated that over 40% of India's population will reside in urban areas, leading to a demand for an additional 25 million affordable housing units. This surge in demand is expected to push the Indian residential real estate market to reach 1.5 million units by 2030.
Asia-Pacific Cement Industry Overview
The Asia-Pacific Cement Market is moderately consolidated, with the top five companies occupying 50.04%. The major players in this market are Anhui Conch Cement Company Limited, BBMG Corporation, China National Building Material Group Corporation, China Resource Cement Holdings and UltraTech Cement Ltd. (sorted alphabetically).
Additional Benefits:
- The market estimate (ME) sheet in Excel format
- 3 months of analyst support
TABLE OF CONTENTS
1 EXECUTIVE SUMMARY & KEY FINDINGS
2 REPORT OFFERS
3 INTRODUCTION
- 3.1 Study Assumptions & Market Definition
- 3.2 Scope of the Study
- 3.3 Research Methodology
4 KEY INDUSTRY TRENDS
- 4.1 End Use Sector Trends
- 4.1.1 Commercial
- 4.1.2 Industrial and Institutional
- 4.1.3 Infrastructure
- 4.1.4 Residential
- 4.2 Major Infrastructure Projects (current And Announced)
- 4.3 Regulatory Framework
- 4.4 Value Chain & Distribution Channel Analysis
5 MARKET SEGMENTATION (includes market size, forecasts up to 2030 and analysis of growth prospects.)
- 5.1 End Use Sector
- 5.1.1 Commercial
- 5.1.2 Industrial and Institutional
- 5.1.3 Infrastructure
- 5.1.4 Residential
- 5.2 Product
- 5.2.1 Blended Cement
- 5.2.2 Fiber Cement
- 5.2.3 Ordinary Portland Cement
- 5.2.4 White Cement
- 5.2.5 Other Types
- 5.3 Country
- 5.3.1 Australia
- 5.3.2 China
- 5.3.3 India
- 5.3.4 Indonesia
- 5.3.5 Japan
- 5.3.6 Malaysia
- 5.3.7 South Korea
- 5.3.8 Thailand
- 5.3.9 Vietnam
- 5.3.10 Rest of Asia-Pacific
6 COMPETITIVE LANDSCAPE
- 6.1 Key Strategic Moves
- 6.2 Market Share Analysis
- 6.3 Company Landscape
- 6.4 Company Profiles
- 6.4.1 Adani Group
- 6.4.2 Anhui Conch Cement Company Limited
- 6.4.3 BBMG Corporation
- 6.4.4 China National Building Material Group Corporation
- 6.4.5 China Resource Cement Holdings
- 6.4.6 SCG
- 6.4.7 SIG
- 6.4.8 TAIWAN CEMENT LTD.
- 6.4.9 UltraTech Cement Ltd.
- 6.4.10 Vietnam National Cement Corporation
7 KEY STRATEGIC QUESTIONS FOR CONCRETE, MORTARS AND CONSTRUCTION CHEMICALS CEOS
8 APPENDIX
- 8.1 Global Overview
- 8.1.1 Overview
- 8.1.2 Porter's Five Forces Framework (Industry Attractiveness Analysis)
- 8.1.3 Global Value Chain Analysis
- 8.1.4 Market Dynamics (DROs)
- 8.2 Sources & References
- 8.3 List of Tables & Figures
- 8.4 Primary Insights
- 8.5 Data Pack
- 8.6 Glossary of Terms
02-2729-4219
+886-2-2729-4219
 水泥市场:依产品类型、建筑风格、材料成分、黏结强度、纹理和表面处理、建筑构件、终端用户产业和通路划分-2026-2032年全球预测餐俱生产线市场:依产品类型、材料、价格范围、通路和最终用户划分,全球预测,2026-2032年
 2026年全球注射式水泥市场报告2026年全球磷酸钙水泥市场报告
 水泥:市场占有率分析、产业趋势与统计、成长预测(2026-2031)
 日本水泥水泥熟料市场规模、份额、趋势及预测(按类型、通路、应用、最终用途产业及地区划分),2026-2034年水泥市场规模、份额、趋势及预测(按类型、最终用途及地区划分),2026-2034年2026年全球水泥及混凝土製品市场报告2026年全球矿渣水泥市场报告
 低碳水泥和混凝土产业的成长机会
▼