


 |
市场调查报告书
商品编码
1685714
美国LED照明:市场占有率分析、产业趋势与成长预测(2025-2030年)US LED Lighting - Market Share Analysis, Industry Trends & Statistics, Growth Forecasts (2025 - 2030) |
||||||
价格
※ 本网页内容可能与最新版本有所差异。详细情况请与我们联繫。
简介目录
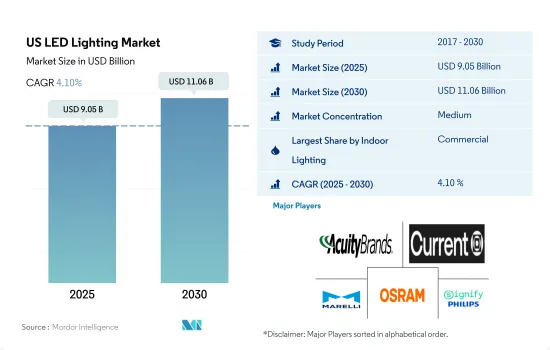
预计2025年美国LED照明市场规模为90.5亿美元,到2030年将达到110.6亿美元,预测期间(2025-2030年)的复合年增长率为4.10%。
该地区可支配收入的增加、政府投资和商业建筑的增加正在推动 LED 照明市场的成长。
- 从价值份额来看,2023年商业设施将占据大部分市场份额,其次是工业/仓库和住宅。推动工业部门韧性成长的主要因素是中国劳动力水准的变化、美国生产的监管负担较低以及製造业收入相对于美国国内生产总值的高度活力。
- 从2023年的成交量份额来看,商业领域将占多数,其次是住宅领域和工业及仓储领域。美国对储存空间的需求前景光明。随着电子商务的加速发展,仓储产业可能会看到比以往更多的成长机会。 2020年第三季美国零售电子商务销售额估计为2,095亿美元。与 2019 年第三季相比成长了 36.7%。
- 建设产业是各行各业中一个不断发展的行业。其中包括私营和商业部门的建筑商、承包商和土木工程师。预计从 2019 年到 2029 年,建筑和采矿业的就业人数将增加 4%,与总就业人数的平均成长率大致相同。这种增长的部分原因是人口增长导致对新建筑、道路和其他结构的需求不断增加。
- 2022年,美国小型企业数量将达3,320万家。五家发展最快的新兴企业的总部均设在旧金山。 40% 的美国新兴企业至少有一名女性担任领导职务。到2022年,超过65%的中小企业累计盈利。由于上述案例,预计未来几年室内LED的需求将会成长。
美国LED照明市场趋势
家庭数量增加推动LED市场成长
- 2021年,美国总人口3.3218亿。预计2021年美国总体生育率为每名妇女生育1.66个孩子,比前一年增加0.01个。粗略地说,美国每1000人就有11个新生儿。比前一年增加了0.1。 2021 年美国的出生预期寿命为 76.33 岁。根据这些资料,世界上出生的婴儿越来越多,人口也越来越多。这意味着需要更多的空间来居住,导致市场扩大。因此,新住宅的建设将导致新型 LED 的销售增加。
- 2022年,美国共有1.312亿个家庭。美国家庭数量比 2020 年(1.2845 亿户)更多。 2022年,美国典型家庭规模为3.13人。 2022年拥有住房的家庭比例将达到65.9%。 2020年,六间及六间住宅占全住宅的19.3%。家庭成员数量的增加以及房间数量的不断增加,推动了 LED 照明的普及。
- 电动车 (EV) 市场正在快速扩张,预计未来十年仍将持续扩张。美国电动车销量已从 2011 年占所有汽车销量的 0.2% 成长至 2021 年的 4.6%。从 2011 年到 2021 年的 10 年间,道路上的电动车数量大幅增加,从约 22,000 辆增加到 200 多万辆。因此,随着电动车的普及,各种电动车应用中使用的半导体晶片的需求不断增加,从而导致对 LED 照明的需求增加。
私人住宅增加和政府法规推动LED市场
- 截至 2021 年,美国约有 1.24 亿个家庭。 2017年至2021年每户人口为2.6人,2022年登记的住宅总套数为1.437亿套。预计2020年人口将达3.314亿,2022年将增至3.332亿,成长率为0.6%。此外,房屋自有率高达64.6%。考虑上述案例显示家庭规模正在减少,需要新的住宅,人口正在成长。基于这些案例,预计LED将得到更广泛的应用,以满足家庭照明需求。在美国,可支配收入不断增加,这反过来又增加了个人的消费能力,使他们能够花更多的钱来购买新的居住空间。 2021年12月,美国人均收入将达36,430美元,2020年12月为33,740.8美元。与其他开发中国家相比,美国的收入较高。例如,截至2020年,墨西哥的人均收入为2,639.7美元,而加拿大的人均收入为29,330美元,较低。
- 5月份私人住宅开工数量以年度为基础为163.1万套。这比 2022 年 5 月的 154.3 万套高出 5.7%,比 2023 年 4 月修订后的 134 万套高出 21.7%。根据 2023 年的新规定,根据《能源政策法》(EPAct)第 179D 条的规定,最高税额扣抵抵免额将跃升至每平方英尺升级空间 5 美元。 2022 年,免税额为每平方英尺 1.88 美元(但计划上涨至每平方英尺 2 美元)。所涵盖的计划涉及室内照明、空调和建筑外部。预计此类案例将进一步刺激该国对 LED 照明的需求。
美国LED照明产业概况
美国LED照明市场适度整合,前五大企业占64.62%。该市场的主要企业有:ACUITY BRANDS, INC.、Current Lighting Solutions, LLC.、Marelli Holdings、OSRAM GmbH。以及 Signify(飞利浦)。
其他福利
- Excel 格式的市场预测 (ME) 表
- 3个月的分析师支持
目录
第一章执行摘要和主要发现
第二章 报告要约
第三章 引言
- 研究假设和市场定义
- 研究范围
- 调查方法
第四章 产业主要趋势
- 汽车产量
- 人口
- 人均收入
- 汽车贷款利率
- 充电站数量
- 持有汽车数量
- LED进口总量
- 照明功耗
- #家庭数量
- 道路网络
- LED渗透率
- #体育场数量
- 园艺区
- 法律规范
- 室内照明
- 美国
- 户外照明
- 美国
- 汽车照明
- 美国
- 室内照明
- 价值炼和通路分析
第五章市场区隔
- 室内照明
- 农业照明
- 商业照明
- 办公室
- 零售
- 其他的
- 工业/仓库
- 住宅照明
- 户外照明
- 公共设施
- 路
- 其他的
- 汽车实用照明
- 日间行车灯 (DRL)
- 方向指示器
- 头灯
- 倒车灯
- 红绿灯
- 尾灯
- 其他的
- 汽车照明
- 二轮车
- 商用车
- 搭乘用车
第六章 竞争格局
- 关键策略趋势
- 市场占有率分析
- 商业状况
- 公司简介
- ACUITY BRANDS, INC.
- Current Lighting Solutions, LLC.
- Dialight
- GRUPO ANTOLIN IRAUSA, SA
- KOITO MANUFACTURING CO., LTD.
- Marelli Holdings Co., Ltd.
- NVC INTERNATIONAL HOLDINGS LIMITED
- OSRAM GmbH.
- Signify(Philips)
- Stanley Electric Co., Ltd.
第七章:CEO面临的关键策略问题
第 8 章 附录
- 世界概况
- 概述
- 五力分析框架
- 全球价值链分析
- 市场动态(DRO)
- 资讯来源及延伸阅读
- 图片列表
- 关键见解
- 资料包
- 词彙表
简介目录
Product Code: 46621
The US LED Lighting Market size is estimated at 9.05 billion USD in 2025, and is expected to reach 11.06 billion USD by 2030, growing at a CAGR of 4.10% during the forecast period (2025-2030).
The increasing disposable income, government investments, and rising commercial construction in the region drive the growth of led lighting market
- In terms of value share, in 2023, commercial accounted for the majority of the share, followed by industrial and warehouse, and residential. The main factors contributing to the growth of the industrial sector's resilience are changes in labor force levels in China, less regulatory burden for US production than European counterparts, and greater vitality of manufacturing income relative to the United States Gross Domestic Product.
- In terms of volume share, in 2023, commercial accounted for the majority of the share, followed by the residential sector and industrial and warehouse sector. America's need for storage space is advancing toward a brighter future. With the acceleration of e-commerce, the warehousing industry may see more growth opportunities than ever. The US retail e-commerce sales in Q3 2020 are estimated at USD 209.5 billion. This is a 36.7% increase over Q3 2019.
- The construction industry is a growth industry in all areas. These include builders, contractors, and civil engineers in the private and commercial sectors. Employment in the construction and mining sector is expected to increase by 4% from 2019 to 2029, about the same rate as the average for all jobs. Part of the driver of this growth is the increasing demand for new buildings, roads, and other structures due to population growth.
- In 2022, there were 33.2 million small businesses in the United States. The five fast-growing startups are headquartered in San Francisco. 40% of US startups have at least one woman in leadership. Over 65% of small businesses reported profits in 2022. The above instances are expected to create more demand for Indoor LEDs in the coming years.
US LED Lighting Market Trends
Increase in the number of households to drive the growth of the LED market
- In 2021, there were 332.18 million people living in the US as a whole. The overall fertility rate in the US was expected to be 1.66 children per woman in 2021. When compared to the prior year, it went up 0.01. In rough terms, there were 11 live births per 1,000 people in the US. This rose from the previous year by 0.1. In the US, the average life expectancy at birth was 76.33 years in 2021. According to the data, more children are being born and more people in the world, which means that more space will need to be inhabited by people, which will help the market expand. Thus, the sale of new LEDs will rise as a result of the building of the new home.
- The United States had 131.2 million households in 2022. There are now more households in the United States than there were in 2020 (128.45 million). In 2022, there were 3.13 people in the typical American family. The proportion of owner-occupied households in 2022 was 65.9%. In 2020, six or more rooms were present in 19.3% of all occupied dwelling units. The expansion of LEDs will be fueled by an increase in families and the need to accommodate this increase in the typical number of rooms.
- The market for electric cars (EVs) has expanded quickly and is anticipated to do so throughout the next ten years. From just 0.2% of all car sales in 2011 to 4.6% in 2021, electric car sales in the US grew. Over the decade of 2011-21, the number of EVs on the road increased significantly, from around 22,000 to over 2 million. As a result, the need for semiconductor chips used in various EV applications rose along with the popularity of EVs, raising the need for LED illumination.
Increase in the number of private-owned dwellings and government regulations to drive the market for LEDs
- As of 2021, there were around 124 million households in the United States. Person per household between 2017 and 2021 was 2.6 persons, and the total housing units registered were 143.7 million by 2022. Furthermore, the population in 2020 was 331.4 million, which increased to 333.2 million by 2022, representing 0.6% growth. The owner-occupied housing unit rate was 64.6%, which is higher. Considering the above instances, it suggested that the household size is smaller and requires new housing units, and the population is growing, which also represents the same. Such instances are expected to create more LED penetration for the need for illumination in the country. In the United States, disposable income is growing, resulting in the rising spending power of individuals who can spend more on new residential spaces. The United States per Capita income reached USD 36,430 in December 2021, compared with USD 33,740.8 in December 2020. Compared to other developing nations, the US is getting more. For instance, Mexico had a per capita income of USD 2,639.7 as of 2020, and Canada had USD 29,330, which is lower.
- The number of privately owned home starts in May was 1,631,000 on an annual basis. This is 5.7% above the May 2022 rate of 1,543,000 and is 21.7% higher than the revised April 2023 estimate of 1,340,000. As per the Energy Policy Act (EPAct) section 179D, the maximum tax deduction jumped to USD 5 per sq. ft. of upgraded space in 2023 under the new regulations. Which had USD 1.88 per sq. ft. deductions in 2022 (but is set to rise to USD 2.00 per sq. ft.). Eligible projects include those related to interior lighting, HVAC, and building envelopes. Such instances are further expected to surge the demand for LED lighting in the country.
US LED Lighting Industry Overview
The US LED Lighting Market is moderately consolidated, with the top five companies occupying 64.62%. The major players in this market are ACUITY BRANDS, INC., Current Lighting Solutions, LLC., Marelli Holdings Co., Ltd., OSRAM GmbH. and Signify (Philips) (sorted alphabetically).
Additional Benefits:
- The market estimate (ME) sheet in Excel format
- 3 months of analyst support
TABLE OF CONTENTS
1 EXECUTIVE SUMMARY & KEY FINDINGS
2 REPORT OFFERS
3 INTRODUCTION
- 3.1 Study Assumptions & Market Definition
- 3.2 Scope of the Study
- 3.3 Research Methodology
4 KEY INDUSTRY TRENDS
- 4.1 Automotive Production
- 4.2 Population
- 4.3 Per Capita Income
- 4.4 Interest Rate For Auto Loans
- 4.5 Number Of Charging Stations
- 4.6 Number Of Automobile On-road
- 4.7 Total Import Of Leds
- 4.8 Lighting Electricity Consumption
- 4.9 # Of Households
- 4.10 Road Networks
- 4.11 Led Penetration
- 4.12 # Of Stadiums
- 4.13 Horticulture Area
- 4.14 Regulatory Framework
- 4.14.1 Indoor Lighting
- 4.14.1.1 United States
- 4.14.2 Outdoor Lighting
- 4.14.2.1 United States
- 4.14.3 Automotive Lighting
- 4.14.3.1 United States
- 4.14.1 Indoor Lighting
- 4.15 Value Chain & Distribution Channel Analysis
5 MARKET SEGMENTATION (includes market size in Value in USD and Volume, Forecasts up to 2030 and analysis of growth prospects)
- 5.1 Indoor Lighting
- 5.1.1 Agricultural Lighting
- 5.1.2 Commercial
- 5.1.2.1 Office
- 5.1.2.2 Retail
- 5.1.2.3 Others
- 5.1.3 Industrial and Warehouse
- 5.1.4 Residential
- 5.2 Outdoor Lighting
- 5.2.1 Public Places
- 5.2.2 Streets and Roadways
- 5.2.3 Others
- 5.3 Automotive Utility Lighting
- 5.3.1 Daytime Running Lights (DRL)
- 5.3.2 Directional Signal Lights
- 5.3.3 Headlights
- 5.3.4 Reverse Light
- 5.3.5 Stop Light
- 5.3.6 Tail Light
- 5.3.7 Others
- 5.4 Automotive Vehicle Lighting
- 5.4.1 2 Wheelers
- 5.4.2 Commercial Vehicles
- 5.4.3 Passenger Cars
6 COMPETITIVE LANDSCAPE
- 6.1 Key Strategic Moves
- 6.2 Market Share Analysis
- 6.3 Company Landscape
- 6.4 Company Profiles (includes Global level Overview, Market level overview, Core Business Segments, Financials, Headcount, Key Information, Market Rank, Market Share, Products and Services, and analysis of Recent Developments)
- 6.4.1 ACUITY BRANDS, INC.
- 6.4.2 Current Lighting Solutions, LLC.
- 6.4.3 Dialight
- 6.4.4 GRUPO ANTOLIN IRAUSA, S.A.
- 6.4.5 KOITO MANUFACTURING CO., LTD.
- 6.4.6 Marelli Holdings Co., Ltd.
- 6.4.7 NVC INTERNATIONAL HOLDINGS LIMITED
- 6.4.8 OSRAM GmbH.
- 6.4.9 Signify (Philips)
- 6.4.10 Stanley Electric Co., Ltd.
7 KEY STRATEGIC QUESTIONS FOR LED CEOS
8 APPENDIX
- 8.1 Global Overview
- 8.1.1 Overview
- 8.1.2 Porter's Five Forces Framework
- 8.1.3 Global Value Chain Analysis
- 8.1.4 Market Dynamics (DROs)
- 8.2 Sources & References
- 8.3 List of Tables & Figures
- 8.4 Primary Insights
- 8.5 Data Pack
- 8.6 Glossary of Terms
02-2729-4219
+886-2-2729-4219
 2025年LED(发光二极体)霓虹灯全球市场报告2025年双色发光二极体(LED)环形灯全球市场报告
 全球LEDBrick灯市场全球泛光灯摄影机市场全球LED霓虹灯市场
 2025 年至 2033 年 LED 筒灯市场报告(按应用(改造、零售和酒店、户外、办公室、建筑、住宅、工业)和地区划分)
 LED 照明和 OLED 照明:市场分析和製造趋势LED泛光灯市场报告(按应用(改造、零售和酒店、户外、办公室、建筑、住宅、工业)和地区)2025-2033LED面板灯市场报告(按应用(改造、零售和酒店、户外、办公室、建筑、住宅、工业)和地区)2025-2033全球LED檯灯市场
▼