


 |
市场调查报告书
商品编码
1685715
聚甲醛(POM):市场占有率分析、产业趋势与成长预测(2024-2029)Polyoxymethylene (POM) - Market Share Analysis, Industry Trends & Statistics, Growth Forecasts (2024 - 2029) |
||||||
价格
※ 本网页内容可能与最新版本有所差异。详细情况请与我们联繫。
简介目录
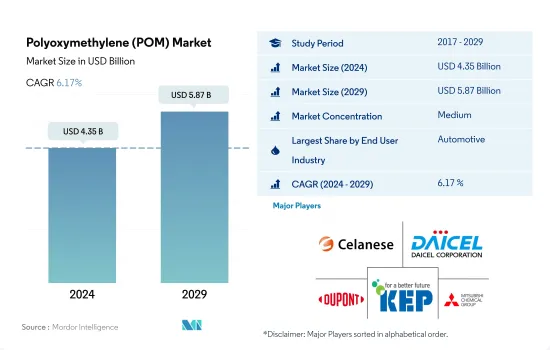
聚甲醛 (POM) 市场规模预计在 2024 年为 43.5 亿美元,预计到 2029 年将达到 58.7 亿美元,预测期内(2024-2029 年)的复合年增长率为 6.17%。
家电需求成长推动POM市场成长
- POM 树脂用于现代燃料系统、内装、泵浦、输送和其他应用。 2022年聚缩醛树脂在全球工程塑胶市场的销售份额为3.56%。
- 汽车是POM树脂的最大消费产业。 2021 年至 2022 年,汽车产量增加了 5% 以上。个人出行需求的不断增长推动了汽车製造业的成长,尤其是两轮车和汽车的生产。这一趋势在世界几乎所有地区都在加剧,尤其是亚太地区。例如,2022年亚太地区的汽车产量份额将达到72.44%。
- 电气和电子产业是POM树脂的第二大消费产业。该产业2022年的产值约为5.807兆美元,较2021年成长1.16%。预计2023年全球消费性电子产品销售额将成长至1.103兆美元,可能会推动对聚甲醛树脂的需求。
- 工业机械是 POM 树脂的第三大消费产业,由于全球工业机械製造业的成长,2022 年其收益占有率为 16.93%。例如,2021年全球工具机产量为839亿美元,与前一年同期比较成长24%。
- 航太工业是 POM 树脂成长最快的消费产业。根据收入计算,预计 2023 年至 2029 年的复合年增长率为 6.81%。
亚太地区电子产业蓬勃发展推动市场成长
- 聚甲醛广泛用于製造需要良好尺寸稳定性和滑动性能的精密零件。 2022 年全球 POM 市场占整个工程塑胶市场收入的 3.55%。
- 2022年,亚太地区将成为最大的地区,价值份额为66.06%。这是由于电气和电子以及汽车行业在 2022 年分别占了 39.15% 和 28.83% 的市场占有率。由于对游戏机和电子设备的需求不断增加,该地区对 POM 的需求预计也会增加。
- 2022年,欧洲成为全球第二大POM树脂消费国。由于该地区汽车和电子设备产量的增加,同年POM市场收益占有率为17.4%。例如,该地区的汽车产量在2022年将占全球产量的12.28%。随着汽车需求的增加,生产的汽车数量也将增加,预计将导致对POM树脂的需求增加。
- 中东也是汽车产业带动的消费成长地区之一。该地区的快速成长是由沙乌地阿拉伯等主要经济体的经济多元化所推动的。沙乌地阿拉伯目前的目标是到 2030 年减少对进口的依赖并发展国内汽车工业。因此,预计在预测期内汽车产业对 POM 树脂的需求将大幅成长。
全球聚甲醛(POM)市场趋势
电子产业的技术进步可能推动成长
- 电子产品技术创新的快速步伐推动着对更新、更快的电气和电子产品的持续需求。 2022年,全球电气电子产品销售额预计将达到5.807兆美元,其中亚太地区占74%的市场占有率,其次是欧洲,占13%。预计预测期内全球电气和电子设备市场复合年增长率将达到 6.61%。
- 2018年,亚太地区经济成长强劲,受中国、韩国、日本、印度和东南亚国协快速工业化的推动。 2020年,受疫情影响,晶片短缺、供应链效率低等因素导致全球电子电气生产放缓,营收与前一年同期比较增仅0.1%。由于疫情期间人们被迫待在室内,对远距工作和家庭娱乐消费性电子产品的需求推动了这一成长。
- 预测期内,对数位化、机器人、虚拟实境、扩增实境、物联网 (IoT) 和 5G 连接等先进技术的需求预计将成长。预计 2027 年全球电气和电子设备产量将成长 5.9%。由于技术进步,预测期内对消费性电子产品的需求预计将上升。例如,预计 2027 年全球消费性电子产业收益将达到约 9,046 亿美元,而 2023 年将达到 7,191 亿美元。因此,预计技术发展将在预测期内推动对电气和电子产品的需求。
聚甲醛(POM)产业概览
聚甲醛(POM)市场适度整合,前五大公司占54.80%的市占率。市场的主要企业有:塞拉尼斯公司、大赛璐公司、杜邦公司、韩国工程塑胶公司和三菱化学公司。
其他福利
- Excel 格式的市场预测 (ME) 表
- 3个月的分析师支持
目录
第一章执行摘要和主要发现
第二章 报告要约
第三章 引言
- 研究假设和市场定义
- 研究范围
- 调查方法
第四章 产业主要趋势
- 最终用户趋势
- 航太
- 车
- 建筑与施工
- 电气和电子
- 包装
- 进出口趋势
- 聚甲醛(POM)贸易
- 价格趋势
- 形状趋势
- 法律规范
- 阿根廷
- 澳洲
- 巴西
- 加拿大
- 中国
- EU
- 印度
- 日本
- 马来西亚
- 墨西哥
- 奈及利亚
- 俄罗斯
- 沙乌地阿拉伯
- 南非
- 韩国
- 阿拉伯聯合大公国
- 英国
- 美国
- 价值炼和通路分析
第五章市场区隔
- 最终用户产业
- 航太
- 车
- 电气和电子
- 工业/机械
- 其他最终用户产业
- 地区
- 非洲
- 按国家
- 奈及利亚
- 南非
- 其他非洲国家
- 亚太地区
- 按国家
- 澳洲
- 中国
- 印度
- 日本
- 马来西亚
- 韩国
- 其他亚太地区
- 欧洲
- 按国家
- 法国
- 德国
- 义大利
- 俄罗斯
- 英国
- 其他欧洲国家
- 中东
- 按国家
- 沙乌地阿拉伯
- 阿拉伯聯合大公国
- 其他中东地区
- 北美洲
- 按国家
- 加拿大
- 墨西哥
- 美国
- 南美洲
- 按国家
- 阿根廷
- 巴西
- 南美洲其他地区
- 非洲
第六章 竞争格局
- 关键策略趋势
- 市场占有率分析
- 商业状况
- 公司简介.
- Celanese Corporation
- China BlueChemical Ltd.
- Daicel Corporation
- DuPont
- Henan Energy Group Co., Ltd.
- Kolon BASF innoPOM, Inc.
- Korea Engineering Plastics Co., Ltd.
- Mitsubishi Chemical Corporation
- SABIC
- Yuntianhua Group Co., Ltd.
第七章:CEO面临的关键策略问题
第 8 章 附录
- 世界概况
- 概述
- 五力分析框架(产业吸引力分析)
- 全球价值链分析
- 市场动态(DRO)
- 资讯来源及延伸阅读
- 图片列表
- 关键见解
- 资料包
- 词彙表
简介目录
Product Code: 46627
The Polyoxymethylene (POM) Market size is estimated at 4.35 billion USD in 2024, and is expected to reach 5.87 billion USD by 2029, growing at a CAGR of 6.17% during the forecast period (2024-2029).
Increasing demand for consumer electronics to aid market growth for POM
- POM resins are used in modern fuel systems, interior appearance, pumping, conveying, and other applications. Polyacetal resins had a revenue share of 3.56% of the global engineering plastics market in 2022.
- Automotive is the largest consumer of POM resins. Automotive production increased by over 5% from 2021 to 2022 by volume. With the increasing demand for private mobility, automotive manufacturing, especially the production of two-wheelers and cars, is on the rise. This trend has increased in almost all global regions, particularly in Asia-Pacific. For instance, vehicle production in Asia-Pacific held a volume share of 72.44% in 2022.
- The electrical and electronics industry is the second-largest consumer of POM resins. The industry had a production revenue of USD 5807 billion in 2022, increasing by 1.16% from 2021. Global consumer electronics revenue is projected to grow to USD 1103 billion in 2023, which may drive the demand for polyacetal resin.
- Industrial machinery is the third-largest consumer of POM resin, accounting for a revenue share of 16.93% in 2022 due to an increase in industrial machinery manufacturing at a global scale. For instance, in 2021, the global production value of machine tools was USD 83.9 billion, a 24% increase over the previous year.
- The aerospace industry is the fastest-growing consumer of POM resins. It is expected to record a CAGR of 6.81% by revenue between 2023 and 2029.
Growing electronics industry in Asia-Pacific to aid market growth
- Polyoxymethylene is widely used in the production of precision parts for applications requiring good dimensional stability and sliding properties. The global POM market held a revenue share of 3.55% of the overall engineering plastics market in 2022.
- In 2022, Asia-Pacific was the largest region, with a 66.06% value share. It witnessed a growth of 10.83% by value in the same year compared to 2021, attributed to the electrical and electronics and automotive industries, which held 39.15% and 28.83% of the market share, respectively, by value in 2022. With an increase in the demand for gaming consoles and electronic devices, the demand for POM is likely to increase in the region.
- Europe was the second-largest consumer of POM resins globally in 2022. The region held a revenue share of 17.4% of the POM market in the same year due to the increasing production of vehicles and electronics in the region. For example, the region's vehicle production held a share of 12.28% of global production in 2022. With the growing demand for vehicles, production is likely to increase, thus increasing the demand for POM resins.
- The Middle East is also one of the growing consumers led by the automotive industry. The rapid growth in the region can be accounted for by the attempts of major countries, like Saudi Arabia, at economic diversification. Saudi Arabia is currently aiming to reduce its import dependence and develop the domestic automotive industry by 2030. As a result, the demand for POM resins from the automotive industry is expected to grow significantly during the forecast period.
Global Polyoxymethylene (POM) Market Trends
Technological advancements in electronics industry may foster the growth
- The rapid pace of technological innovation in electronic products is driving the consistent demand for new and fast electrical and electronic products. In 2022, the global revenue of electrical and electronics stood at USD 5,807 billion, with Asia-Pacific holding a 74% market share, followed by Europe with a 13% share. The global electrical and electronics market is expected to record a CAGR of 6.61% during the forecast period.
- In 2018, the Asia-Pacific region witnessed strong economic growth owing to rapid industrialization in China, South Korea, Japan, India, and ASEAN countries. In 2020, due to the pandemic, there was a slowdown in global electrical and electronics production due to the shortage of chips and inefficiencies in the supply chain, which led to a stagnant growth rate of 0.1% in revenue compared to the previous year. This growth was driven by the demand for consumer electronics for remote working and home entertainment as people were forced to remain indoors during the pandemic.
- The demand for advanced technologies, such as digitalization, robotics, virtual reality, augmented reality, IoT (Internet of Things), and 5G connectivity, is expected to grow during the forecast period. Global electrical and electronics production is expected to register a growth rate of 5.9% in 2027. As a result of technological advancements, the demand for consumer electronics is expected to rise during the forecast period. For instance, the global consumer electronics industry is projected to witness a revenue reach of around USD 904.6 billion in 2027, compared to USD 719.1 billion in 2023. As a result, technological development is projected to lead the demand for electrical and electronic products during the forecast period.
Polyoxymethylene (POM) Industry Overview
The Polyoxymethylene (POM) Market is moderately consolidated, with the top five companies occupying 54.80%. The major players in this market are Celanese Corporation, Daicel Corporation, DuPont, Korea Engineering Plastics Co., Ltd. and Mitsubishi Chemical Corporation (sorted alphabetically).
Additional Benefits:
- The market estimate (ME) sheet in Excel format
- 3 months of analyst support
TABLE OF CONTENTS
1 EXECUTIVE SUMMARY & KEY FINDINGS
2 REPORT OFFERS
3 INTRODUCTION
- 3.1 Study Assumptions & Market Definition
- 3.2 Scope of the Study
- 3.3 Research Methodology
4 KEY INDUSTRY TRENDS
- 4.1 End User Trends
- 4.1.1 Aerospace
- 4.1.2 Automotive
- 4.1.3 Building and Construction
- 4.1.4 Electrical and Electronics
- 4.1.5 Packaging
- 4.2 Import And Export Trends
- 4.2.1 Polyoxymethylene (POM) Trade
- 4.3 Price Trends
- 4.4 Form Trends
- 4.5 Regulatory Framework
- 4.5.1 Argentina
- 4.5.2 Australia
- 4.5.3 Brazil
- 4.5.4 Canada
- 4.5.5 China
- 4.5.6 EU
- 4.5.7 India
- 4.5.8 Japan
- 4.5.9 Malaysia
- 4.5.10 Mexico
- 4.5.11 Nigeria
- 4.5.12 Russia
- 4.5.13 Saudi Arabia
- 4.5.14 South Africa
- 4.5.15 South Korea
- 4.5.16 United Arab Emirates
- 4.5.17 United Kingdom
- 4.5.18 United States
- 4.6 Value Chain & Distribution Channel Analysis
5 MARKET SEGMENTATION (includes market size in Value in USD and Volume, Forecasts up to 2029 and analysis of growth prospects)
- 5.1 End User Industry
- 5.1.1 Aerospace
- 5.1.2 Automotive
- 5.1.3 Electrical and Electronics
- 5.1.4 Industrial and Machinery
- 5.1.5 Other End-user Industries
- 5.2 Region
- 5.2.1 Africa
- 5.2.1.1 By Country
- 5.2.1.1.1 Nigeria
- 5.2.1.1.2 South Africa
- 5.2.1.1.3 Rest of Africa
- 5.2.2 Asia-Pacific
- 5.2.2.1 By Country
- 5.2.2.1.1 Australia
- 5.2.2.1.2 China
- 5.2.2.1.3 India
- 5.2.2.1.4 Japan
- 5.2.2.1.5 Malaysia
- 5.2.2.1.6 South Korea
- 5.2.2.1.7 Rest of Asia-Pacific
- 5.2.3 Europe
- 5.2.3.1 By Country
- 5.2.3.1.1 France
- 5.2.3.1.2 Germany
- 5.2.3.1.3 Italy
- 5.2.3.1.4 Russia
- 5.2.3.1.5 United Kingdom
- 5.2.3.1.6 Rest of Europe
- 5.2.4 Middle East
- 5.2.4.1 By Country
- 5.2.4.1.1 Saudi Arabia
- 5.2.4.1.2 United Arab Emirates
- 5.2.4.1.3 Rest of Middle East
- 5.2.5 North America
- 5.2.5.1 By Country
- 5.2.5.1.1 Canada
- 5.2.5.1.2 Mexico
- 5.2.5.1.3 United States
- 5.2.6 South America
- 5.2.6.1 By Country
- 5.2.6.1.1 Argentina
- 5.2.6.1.2 Brazil
- 5.2.6.1.3 Rest of South America
- 5.2.1 Africa
6 COMPETITIVE LANDSCAPE
- 6.1 Key Strategic Moves
- 6.2 Market Share Analysis
- 6.3 Company Landscape
- 6.4 Company Profiles (includes Global Level Overview, Market Level Overview, Core Business Segments, Financials, Headcount, Key Information, Market Rank, Market Share, Products and Services, and Analysis of Recent Developments).
- 6.4.1 Celanese Corporation
- 6.4.2 China BlueChemical Ltd.
- 6.4.3 Daicel Corporation
- 6.4.4 DuPont
- 6.4.5 Henan Energy Group Co., Ltd.
- 6.4.6 Kolon BASF innoPOM, Inc.
- 6.4.7 Korea Engineering Plastics Co., Ltd.
- 6.4.8 Mitsubishi Chemical Corporation
- 6.4.9 SABIC
- 6.4.10 Yuntianhua Group Co., Ltd.
7 KEY STRATEGIC QUESTIONS FOR ENGINEERING PLASTICS CEOS
8 APPENDIX
- 8.1 Global Overview
- 8.1.1 Overview
- 8.1.2 Porter's Five Forces Framework (Industry Attractiveness Analysis)
- 8.1.3 Global Value Chain Analysis
- 8.1.4 Market Dynamics (DROs)
- 8.2 Sources & References
- 8.3 List of Tables & Figures
- 8.4 Primary Insights
- 8.5 Data Pack
- 8.6 Glossary of Terms
02-2729-4219
+886-2-2729-4219
 聚甲醛市场机会、成长驱动因素、产业趋势分析及预测(2026-2035年)
 2025-2033年聚甲醛市场报告(按类型、製程、等级、最终用户和地区)
 聚甲醛市场按树脂类型、等级、形态、通路和应用划分-2025-2032年全球预测
 2025年聚甲醛(POM)全球市场报告
 聚甲醛的全球市场
 聚甲醛市场规模、份额、成长分析(按类型、应用、加工方法、等级和地区)- 2025 年至 2032 年产业预测
 2030 年聚甲醛市场预测:按类型、加工方法、应用、最终用户和地区进行的全球分析
 全球聚甲醛 (POM) 市场:按类型、按加工技术、按等级、按最终用途行业、按地区 - 预测(至 2029 年)
 聚甲醛市场报告:2030 年趋势、预测与竞争分析