


 |
市场调查报告书
商品编码
1685835
南美工程塑胶:市场占有率分析、行业趋势和统计、成长预测(2024-2029 年)South America Engineering Plastics - Market Share Analysis, Industry Trends & Statistics, Growth Forecasts (2024 - 2029) |
||||||
※ 本网页内容可能与最新版本有所差异。详细情况请与我们联繫。
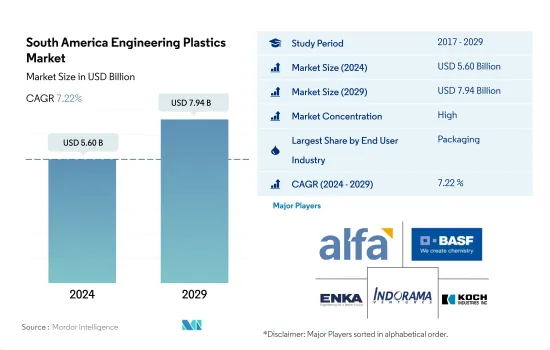
南美工程塑胶市场规模预计在 2024 年为 56 亿美元,预计到 2029 年将达到 79.4 亿美元,预测期内(2024-2029 年)的复合年增长率为 7.22%。
预测期内包装产业将占据市场主导地位
- 工程塑胶比通用一般塑胶具有更优异的机械性能和热性能,这意味着它们的应用是无限的。工程塑胶正在汽车、航太、建筑等各种应用领域中取代金属和其他传统材料。
- 工程塑胶的最大消费者是包装产业。工程塑胶包装有多种材质和形状,包括薄膜、瓶子和容器,每种都有其独特的特性。这些特性包括温度范围、适当的食品用途、保存期限、外观、阻隔性等。工程塑胶既适用于热灌装,也可用于冷灌装,也可在微波炉中加热,预计在预测期内该产业的消费量复合年增长率为 5.13%。
- 汽车产业是工程塑胶的第二大消费产业,其中各种复合材料取代了更昂贵的金属及其合金,每种复合材料都是针对其独特的条件和要求而设计的。业界采用高强度工程塑胶不仅可以降低零件加工、组装和维护成本,而且可以使汽车更轻、更节能。巴西和阿根廷是该地区汽车工业最发达的国家,预计2023年至2029年期间汽车产业消费以收益为准的复合年增长率为6.74%。
- 由于对智慧电子产品和先进设备的需求不断增加,电气和电子产业预计将成为成长最快的产业,从而促进产业的成长。预测期内,该产业的需求量预计复合年增长率为 7.74%。
巴西将在整个预测期内保持主导地位
- 2022年南美洲在全球工程塑胶消费量中的份额(以销售额计算)为4.56%。工程塑胶用于各种行业,包括汽车、包装、电气和电子。
- 巴西是最大的工程塑胶消费国,2022年销量较去年与前一年同期比较成长10.18%。巴西占南美洲包装和汽车总产量的近60%和66%。即食方便食品的需求不断增长,以及忙碌生活方式的兴起,导致包装材料的消费增加,活性化了该地区工程塑胶的销售趋势。汽车需求的激增是个人出行需求不断增长的结果。技术创新正在推动对电子设备的需求。
- 阿根廷是一个以汽车工业为主导的快速成长消费国家,政府颁布了新的立法,鼓励对汽车标誌产业的新投资,并加强供应链。这将加强该行业的出口导向,并在预测期内促进新引擎技术的发展。这将有助于增加对汽车工程塑胶的需求,预计在预测期内复合年增长率将达到 10.77%(以收益为准)。
- 由于先进材料、有机电子、小型化和颠覆性技术的使用,预测期(2023-2029 年),该地区工程塑胶的消费量预计将以 7.21% 的复合以收益为准增长。
南美洲工程塑胶市场趋势
技术创新步伐加快推动产业成长
- 在南美洲,巴西占该地区2017年电气和电子製造业收入的最大份额,接近40%。 2017年,巴西电子产品电商渗透率接近20%。该地区的技术进步增加了对智慧电视、智慧冰箱、智慧空调等家用电器以及其他电气和电子产品的需求。 2017 年至 2019 年,南美电气和电子製造收入的复合年增长率超过 6.16%。
- 2020年,受疫情影响,远距办公和家庭娱乐等家用电器需求增加,该地区电气和电子产品产量增加,与前一年同期比较增1.1%。可支配收入的增加、奢侈品需求的不断增长、技术进步和生活水准的提高是推动电气和电子设备市场成长的一些主要因素。因此,该地区 2021 年的电气和电子设备产量销售额也成长了 14.9%。
- 电子创新的快速步伐推动着对更新、更快的电气和电子产品的持续需求。因此,该地区对电气和电子设备生产的需求也在增加。 LG、三星、Panasonic、松下、戴尔、SONY、东芝、索尼、飞利浦、Sharp Corporation、苹果、联想等跨国公司的进驻也对电气和电子设备市场产生了积极影响。预计所有这些因素将在预测期内推动该地区的电气和电子设备产量增加约 7%。
南美洲工程塑胶产业概况
南美洲工程塑胶市场相当集中,前五大公司占据了89.63%的市场。市场的主要企业是:Alfa SAB de CV、 BASF SE、Enka、Indorama Ventures Public Company Limited 和 Koch Industries, Inc.(按字母顺序排列)。
其他福利
- Excel 格式的市场预测 (ME) 表
- 3 个月分析师支持
目录
第 1 章执行摘要和主要发现
第二章 报告要约
第 3 章 简介
- 研究假设和市场定义
- 研究范围
- 调查方法
第四章 产业主要趋势
- 最终用户趋势
- 航太
- 车
- 建筑和施工
- 电气和电子
- 包装
- 进出口趋势
- 氟树脂交易
- 聚酰胺(PA)贸易
- 聚碳酸酯(PC)贸易
- 聚对苯二甲酸乙二酯(PET)贸易
- 聚甲基丙烯酸甲酯(PMMA)贸易
- 聚甲醛(POM)贸易
- 苯乙烯共聚物(ABS 和 SAN)贸易
- 价格趋势
- 回收概述
- 聚酰胺 (PA) 回收趋势
- 聚碳酸酯 (PC) 回收趋势
- 聚对苯二甲酸乙二醇酯 (PET) 的回收趋势
- 苯乙烯共聚物(ABS、SAN)的回收趋势
- 法律规范
- 阿根廷
- 巴西
- 价值链与通路分析
第五章 市场区隔
- 最终用户产业
- 航太
- 车
- 建筑和施工
- 电气和电子
- 工业/机械
- 包装
- 其他最终用户产业
- 树脂类型
- 氟树脂
- 依亚型
- 乙烯-四氟乙烯(ETFE)
- 氟化乙丙烯 (FEP)
- 聚四氟乙烯(PTFE)
- 聚氟乙烯 (PVF)
- 聚二氟亚乙烯(PVDF)
- 其他子树脂类型
- 液晶聚合物(LCP)
- 聚酰胺(PA)
- 副树脂类型
- 芳香聚酰胺
- 聚酰胺(PA)6
- 聚酰胺(PA)66
- 聚邻苯二甲酰胺
- 聚丁烯对苯二甲酸酯(PBT)
- 聚碳酸酯(PC)
- 聚醚醚酮 (PEEK)
- 聚对苯二甲酸乙二醇酯(PET)
- 聚酰亚胺(PI)
- 聚甲基丙烯酸甲酯 (PMMA)
- 聚甲醛(POM)
- 苯乙烯共聚物(ABS 和 SAN)
- 氟树脂
- 国家
- 阿根廷
- 巴西
- 南美洲其他地区
第六章 竞争格局
- 主要策略趋势
- 市场占有率分析
- 业务状况
- 公司简介.
- Alfa SAB de CV
- BASF SE
- Celanese Corporation
- China Petroleum & Chemical Corporation
- Covestro AG
- Enka
- Formosa Plastics Group
- Indorama Ventures Public Company Limited
- Koch Industries, Inc.
- LANXESS
- Mitsubishi Chemical Corporation
- SABIC
- Teijin Limited
- Trinseo
- Unigel Plasticos
第七章:执行长的关键策略问题
第 8 章 附录
- 世界概况
- 概述
- 五力分析框架(产业吸引力分析)
- 全球价值链分析
- 市场动态(DRO)
- 资讯来源和进一步阅读
- 图片列表
- 关键见解
- 资料包
- 词彙表
The South America Engineering Plastics Market size is estimated at 5.60 billion USD in 2024, and is expected to reach 7.94 billion USD by 2029, growing at a CAGR of 7.22% during the forecast period (2024-2029).
Packaging industry to dominate the market during the forecast period
- Engineering plastics, with their superior mechanical and thermal properties compared to common or commodity plastics, have endless applications. They have replaced metals and other traditionally used materials in various application areas, such as automotive, aerospace, building & construction, and more.
- The packaging industry is the largest consumer of engineering plastics. Packaging made from engineering plastics comes in a variety of material types and forms, including films, bottles, containers, and others, each with its own unique characteristics. These characteristics encompass temperature range, appropriate food use, shelf life, appearance, and barrier properties. Suitable for both hot and cold filling, as well as microwave reheating, engineering plastics are expected to see a CAGR of 5.13% in terms of consumption volume from this industry during the forecast period.
- The automotive industry is the second-largest consumer of engineering plastics, which have replaced expensive metals and their alloys with various types of composites, each designed for unique conditions and requirements. The industry uses high-strength engineering plastics, which not only reduces the cost of part processing, assembly, and maintenance but also makes the vehicle lighter and more energy-efficient. Brazil and Argentina have the most developed automotive industries in the region, and consumption in this industry is expected to record a CAGR of 6.74% in terms of revenue from 2023 to 2029.
- The electrical and electronics industry is projected to be the fastest-growing segment due to the increasing demand for smart electronics and advanced devices, contributing to the industry's growth. The demand in this industry is anticipated to record a CAGR of 7.74% in terms of volume during the forecast period.
Brazil to remain dominant during the forecast period
- South America accounted for a share of 4.56%, by revenue, of the consumption of engineering plastics globally in 2022. Engineering plastics have applications in different industries, such as automotive, packaging, electrical and electronics.
- Brazil is the largest consumer of engineering plastics and witnessed a growth of 10.18% in revenue in 2022 compared to the previous year. Brazil occupied nearly 60% and 66% volume shares of packaging and automotive production, respectively, of overall South America. With the growing demand for ready-to-eat convenience food and the emerging trend of on-the-go lifestyles, the consumption of packaging materials increased, increasing the sales of engineering plastics in the region. The surge in automobile demand is a consequence of the increasing demand for private mobility. Technological innovations are driving demand for electronic gadgets.
- Argentina is the fastest-growing consumer, led by the automotive industry, as the government legislated a new Act to promote new investments in the car-marking industry and strengthen its supply chain. This will reinforce the industry's export-oriented profile, promoting the development of new engine technologies during the forecast period. Therefore, the demand for engineering plastics in automotive is likely to increase, registering a CAGR of 10.77%, by revenue, in the country during the forecast period.
- The consumption of engineering plastics in the region is expected to register a CAGR of 7.21% by revenue during the forecast period (2023-2029), owing to the use of advanced materials, organic electronics, miniaturization, and disruptive technologies.
South America Engineering Plastics Market Trends
Rapid pace of technological innovations to boost the industry growth
- In South America, Brazil held the major share of nearly 40% of the region's electrical and electronics production revenue in 2017. In 2017, Brazilian electronics products had a penetration of nearly 20% in the e-commerce sector. The advancement of technology in the region increased the demand for consumer electronics products, such as smart TVs, smart refrigerators, smart air conditioners, and other electrical and electronic products. South American electrical and electronics production revenue witnessed a CAGR of over 6.16% between 2017 and 2019.
- In 2020, with the rise in demand for consumer electronics for remote working and home entertainment due to the pandemic, the production of electrical and electronic products in the region increased at a growth rate of 1.1% by revenue compared to the previous year. Rising disposable income, increased demand for luxury products, technological advancements, and improvement in living standards are some of the major factors driving the electrical and electronics market's growth. As a result, in the region, electrical and electronics production also increased at a rate of 14.9% by revenue in 2021.
- The rapid pace of electronic technological innovation is driving consistent demand for newer and faster electrical and electronic products. As a result, it has also increased the demand for the production of electrical and electronics in the region. The penetration of multinational companies, like LG, Samsung, Microsoft, Panasonic, Dell, Intel, Toshiba, Sony, Philips, Sharp, Apple, and Lenovo, also positively affects the electrical and electronics market. All such factors are expected to fuel the production revenue of electrical and electronics in the region during the forecast period at a rate of around 7%.
South America Engineering Plastics Industry Overview
The South America Engineering Plastics Market is fairly consolidated, with the top five companies occupying 89.63%. The major players in this market are Alfa S.A.B. de C.V., BASF SE, Enka, Indorama Ventures Public Company Limited and Koch Industries, Inc. (sorted alphabetically).
Additional Benefits:
- The market estimate (ME) sheet in Excel format
- 3 months of analyst support
TABLE OF CONTENTS
1 EXECUTIVE SUMMARY & KEY FINDINGS
2 REPORT OFFERS
3 INTRODUCTION
- 3.1 Study Assumptions & Market Definition
- 3.2 Scope of the Study
- 3.3 Research Methodology
4 KEY INDUSTRY TRENDS
- 4.1 End User Trends
- 4.1.1 Aerospace
- 4.1.2 Automotive
- 4.1.3 Building and Construction
- 4.1.4 Electrical and Electronics
- 4.1.5 Packaging
- 4.2 Import And Export Trends
- 4.2.1 Fluoropolymer Trade
- 4.2.2 Polyamide (PA) Trade
- 4.2.3 Polycarbonate (PC) Trade
- 4.2.4 Polyethylene Terephthalate (PET) Trade
- 4.2.5 Polymethyl Methacrylate (PMMA) Trade
- 4.2.6 Polyoxymethylene (POM) Trade
- 4.2.7 Styrene Copolymers (ABS and SAN) Trade
- 4.3 Price Trends
- 4.4 Recycling Overview
- 4.4.1 Polyamide (PA) Recycling Trends
- 4.4.2 Polycarbonate (PC) Recycling Trends
- 4.4.3 Polyethylene Terephthalate (PET) Recycling Trends
- 4.4.4 Styrene Copolymers (ABS and SAN) Recycling Trends
- 4.5 Regulatory Framework
- 4.5.1 Argentina
- 4.5.2 Brazil
- 4.6 Value Chain & Distribution Channel Analysis
5 MARKET SEGMENTATION (includes market size in Value in USD and Volume, Forecasts up to 2029 and analysis of growth prospects)
- 5.1 End User Industry
- 5.1.1 Aerospace
- 5.1.2 Automotive
- 5.1.3 Building and Construction
- 5.1.4 Electrical and Electronics
- 5.1.5 Industrial and Machinery
- 5.1.6 Packaging
- 5.1.7 Other End-user Industries
- 5.2 Resin Type
- 5.2.1 Fluoropolymer
- 5.2.1.1 By Sub Resin Type
- 5.2.1.1.1 Ethylenetetrafluoroethylene (ETFE)
- 5.2.1.1.2 Fluorinated Ethylene-propylene (FEP)
- 5.2.1.1.3 Polytetrafluoroethylene (PTFE)
- 5.2.1.1.4 Polyvinylfluoride (PVF)
- 5.2.1.1.5 Polyvinylidene Fluoride (PVDF)
- 5.2.1.1.6 Other Sub Resin Types
- 5.2.2 Liquid Crystal Polymer (LCP)
- 5.2.3 Polyamide (PA)
- 5.2.3.1 By Sub Resin Type
- 5.2.3.1.1 Aramid
- 5.2.3.1.2 Polyamide (PA) 6
- 5.2.3.1.3 Polyamide (PA) 66
- 5.2.3.1.4 Polyphthalamide
- 5.2.4 Polybutylene Terephthalate (PBT)
- 5.2.5 Polycarbonate (PC)
- 5.2.6 Polyether Ether Ketone (PEEK)
- 5.2.7 Polyethylene Terephthalate (PET)
- 5.2.8 Polyimide (PI)
- 5.2.9 Polymethyl Methacrylate (PMMA)
- 5.2.10 Polyoxymethylene (POM)
- 5.2.11 Styrene Copolymers (ABS and SAN)
- 5.2.1 Fluoropolymer
- 5.3 Country
- 5.3.1 Argentina
- 5.3.2 Brazil
- 5.3.3 Rest of South America
6 COMPETITIVE LANDSCAPE
- 6.1 Key Strategic Moves
- 6.2 Market Share Analysis
- 6.3 Company Landscape
- 6.4 Company Profiles (includes Global Level Overview, Market Level Overview, Core Business Segments, Financials, Headcount, Key Information, Market Rank, Market Share, Products and Services, and Analysis of Recent Developments).
- 6.4.1 Alfa S.A.B. de C.V.
- 6.4.2 BASF SE
- 6.4.3 Celanese Corporation
- 6.4.4 China Petroleum & Chemical Corporation
- 6.4.5 Covestro AG
- 6.4.6 Enka
- 6.4.7 Formosa Plastics Group
- 6.4.8 Indorama Ventures Public Company Limited
- 6.4.9 Koch Industries, Inc.
- 6.4.10 LANXESS
- 6.4.11 Mitsubishi Chemical Corporation
- 6.4.12 SABIC
- 6.4.13 Teijin Limited
- 6.4.14 Trinseo
- 6.4.15 Unigel Plasticos
7 KEY STRATEGIC QUESTIONS FOR ENGINEERING PLASTICS CEOS
8 APPENDIX
- 8.1 Global Overview
- 8.1.1 Overview
- 8.1.2 Porter's Five Forces Framework (Industry Attractiveness Analysis)
- 8.1.3 Global Value Chain Analysis
- 8.1.4 Market Dynamics (DROs)
- 8.2 Sources & References
- 8.3 List of Tables & Figures
- 8.4 Primary Insights
- 8.5 Data Pack
- 8.6 Glossary of Terms
 工程塑胶市场:按产品类型、加工技术、形状和应用分類的全球市场预测-2026-2032年聚甲醛市场:2026-2032年全球市场预测(依产品类型、等级、加工技术、应用及通路划分)
 工程塑胶市场报告:按类型、性能参数、应用和地区划分(2026-2034 年)
 全球高性能塑胶化合物市场-按塑胶类型、添加剂类型、最终用途产业和地区划分-预测(至2030年)
 先进工程热塑性塑胶市场预测至2034年-按产品类型、加工技术、应用和地区分類的全球分析
 全球聚甲醛树脂市场规模、份额、趋势和成长分析报告(2026-2034)
 MPPE工程塑胶市场规模、份额和成长分析:按产品类型、配方类型、应用、终端用户产业和地区划分-2026-2033年产业预测
 工程塑胶:市场占有率分析、产业趋势与统计、成长预测(2026-2031)工程塑胶市场规模、份额、成长及全球产业分析:按类型和应用划分,区域洞察及2026-2034年预测
 2026年全球工程塑胶市场报告