


 |
市场调查报告书
商品编码
1685890
非洲生物刺激素:市场占有率分析、产业趋势与成长预测(2025-2030 年)Africa Biostimulants - Market Share Analysis, Industry Trends & Statistics, Growth Forecasts (2025 - 2030) |
||||||
※ 本网页内容可能与最新版本有所差异。详细情况请与我们联繫。
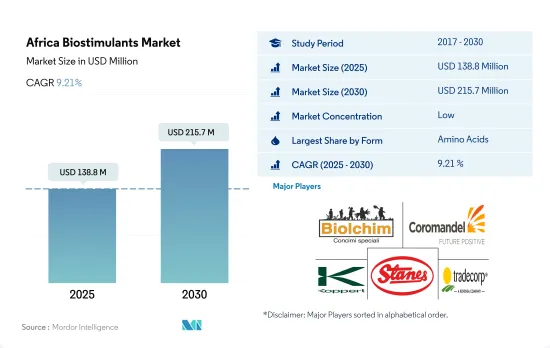
预计 2025 年非洲生物刺激素市场规模为 1.388 亿美元,到 2030 年将达到 2.157 亿美元,预测期内(2025-2030 年)的复合年增长率为 9.21%。
- 胺基酸类生物刺激素将主导非洲市场,2022 年价值 3,530 万美元。胺基酸类生物刺激素被广泛应用,因为它们能够促进种子发芽和幼苗生长,提高作物对各种生物和生物胁迫的适应性,增强养分的吸收和利用,特别是氮和磷,并提高农药和化肥等其他农业投入的效率。
- 腐殖酸基生物刺激素可能推动市场发展,因为它具有抗逆性增强、养分吸收增加、化学投入总体减少,以及易于透过灌溉和土壤喷洒施用等优势,预计到 2029 年将增长约 78.5%,达到 4,960 万美元。
- 腐植酸基生物刺激素是一种有机土壤改良剂,来自土壤、泥炭、煤炭和其他化石矿床中的腐植质,可促进土壤健康和植物生长。富含腐植酸。这些生物刺激素占2022年非洲生物刺激素市场以金额为准的23.4%,是第二大市场占有率。
- 由于海藻萃取物类生物刺激素在许多沿海地区供应充足,且能够减少农业对化学肥料的需求,因此有潜力增加市场占有率。这些因素可能会在预测期内推动对海藻基生物刺激素的需求。 2022 年,以海藻萃取物为基础的生物刺激素的销售额约为 2,310 万美元。
- 预计 2023 年至 2029 年间,腐植酸和富里酸基生物刺激素的成长速度将超过其他生物刺激素。
- 非洲以其多样化的农业系统而闻名,全部区域种植着各种各样的作物。农业在非洲经济中发挥关键作用,2021年作物农业种植面积已成长至约12万公顷。玉米、小麦和玉米等谷类是该地区种植最广泛的作物。
- 非洲农业的成长领域之一是生物刺激素市场,其价值显着成长,从 2017 年到 2021 年成长了约 18.7%。预计这种成长将持续下去,市值预计将成长 67.8%。
- 非洲其他地区将占据非洲生物刺激素市场的大部分份额,到 2022 年将占市场份额的约 81.1%。以面积计算,突尼斯是最大的有机生产国,而衣索比亚在 2020 年拥有最多的有机生产国,约 22 万家。然而,大多数非洲国家缺乏有机农业立法,阻碍了某些地区建立成熟的生物刺激素市场。
- 至2022年,海藻基生物刺激素将占市场份额的43.8%,价值约340万美元。在奈及利亚,海藻萃取物基生物刺激素的使用十分广泛。
- 由于国内外消费者对有机产品的兴趣日益浓厚,预计未来几年非洲对生物刺激素的需求将会成长。农民越来越了解过度依赖化学投入的弊端以及使用生物刺激素的经济效益。由于这些因素,非洲生物刺激素市场有望大幅成长,并为该地区的农民和企业提供机会。
非洲生物刺激素市场趋势
该地区的有机产业拥有 834,000 个有机生产商,突尼斯拥有更多的有机农地。
- 2022年,非洲地区有机农地面积超过120万公顷,占全球有机农地面积的9.0%。
- 2020 年,非洲有机种植面积比 2019 年增加 149,000 公顷,与前一年同期比较增 7.7%,生产者约 834,000 家。突尼斯拥有最多的有机土地(2020 年超过 29 万公顷),衣索比亚拥有最多的有机生产者(约 22 万人)。岛国圣多美和普林西比是该地区投入有机农业土地最多的国家,其农业面积的20.7%为有机作物。
- 在非洲,经济作物在有机农地中所占比例大,占有机农地总面积的63.2%,达81.74万公顷。田间作物占非洲有机农地面积的第二大份额,约占有机土地总面积的25.6%,总合331,200公顷。至2022年,园艺作物将占非洲有机农地总面积的11.2%,达144,900公顷。
- 有机农地面积较大的非洲国家包括非洲其他地区、埃及和南非。到 2022 年,非洲其他地区将占非洲有机农业总面积的 95.0%,达到 120 万公顷,其次是埃及,为 45,100 公顷,占 3.5%,南非为 12,600 公顷,占 1.0%。
- 在非洲,2017年至2022年间,有机农业面积增加了6.9%。预计到2029年将成长约52.2%,达到200万美元。
埃及、南非和奈及利亚是有机产品人均支出最高的国家
- 多年来,非洲的人均收入一直在持续成长,导致人们在营养食品上的支出增加。非洲各地的货架上有机食品和饮料越来越常见。经过认证的有机农产品的国内消费量相对较低,因此大多数有机产品都用于出口。
- 在非洲,有机产品的消费量显着增加,尤其是在埃及、南非和奈及利亚。 2021年,埃及的人均有机产品消费量为55.5美元,其次是南非,为7.1美元。有机生产者数量最多的国家是衣索比亚(近 222,000 家)、坦尚尼亚(近 149,000 家)和乌干达(超过 139,000 家)。
- 非洲地区普遍消费的有机产品包括新鲜蔬菜和水果。在非洲,人们做出了巨大努力,将有机农业纳入政策、国家推广体系、行销和价值链发展的主流。所有这些因素都引起了消费者的兴趣。
- 预计 2023 年至 2029 年间,非洲对有机食品的需求将会扩大,这得益于人均饮料消费量(尤其是果汁)的增加、健康意识的增强以及消费者转向无化学成分的有机饮料和食品。
- 然而,低收入人口以及缺乏有机标准和其他当地市场认证基础设施是该地区有机市场成长的主要阻碍因素。
非洲生物刺激素产业概况
非洲生物刺激素市场较为分散,前五大企业占18.64%。市场的主要企业有:Biolchim SPA、Coromandel International Ltd、Koppert Biological Systems Inc.、T. Stanes and Company Limited 和 Trade Corporation International(按字母顺序排列)。
其他福利
- Excel 格式的市场预测 (ME) 表
- 3个月的分析师支持
目录
第一章执行摘要和主要发现
第二章 报告要约
第三章 引言
- 研究假设和市场定义
- 研究范围
- 调查方法
第四章 产业主要趋势
- 有机种植区
- 有机产品人均支出
- 法律规范
- 埃及
- 奈及利亚
- 南非
- 价值炼和通路分析
第五章市场区隔
- 形式
- 胺基酸
- 富里酸
- 腐植酸
- 蛋白质水解物
- 海藻萃取物
- 其他生物刺激素
- 作物类型
- 经济作物
- 园艺作物
- 田间作物
- 原产地
- 埃及
- 奈及利亚
- 南非
- 其他非洲国家
第六章竞争格局
- 关键策略趋势
- 市场占有率分析
- 商业状况
- 公司简介.
- Atlantica Agricola
- Biolchim SPA
- Coromandel International Ltd
- Haifa Group
- Humic Growth Solutions Inc.
- Koppert Biological Systems Inc.
- Microbial Biological Fertilizers International
- T. Stanes and Company Limited
- Trade Corporation International
- UPL
第七章:CEO面临的关键策略问题
第 8 章 附录
- 世界概况
- 概述
- 五力分析框架
- 全球价值链分析
- 市场动态(DRO)
- 资讯来源及延伸阅读
- 图片列表
- 关键见解
- 资料包
- 词彙表
The Africa Biostimulants Market size is estimated at 138.8 million USD in 2025, and is expected to reach 215.7 million USD by 2030, growing at a CAGR of 9.21% during the forecast period (2025-2030).
- Amino acid-based biostimulants dominate the African market, valued at USD 35.3 million in 2022. Amino acid-based biostimulants are widely used because of their ability to enhance seed germination and seedling growth, improve crop resilience to various biotic and abiotic stresses, boost nutrient uptake and utilization, especially with regard to nitrogen and phosphorus, and amplify the efficiency of other agricultural inputs such as pesticides and fertilizers.
- The benefits of humic acid-based biostimulants, such as increased stress tolerance, increased nutrient uptake, and an overall reduction in chemical inputs, as well as their ease of application via fertigation or soil application methods, may drive the market, with the market value expected to grow by about 78.5% to USD 49.6 million by 2029.
- Humic acid-based biostimulants, which are a type of organic soil amendment derived from humic substances found in soil, peat, coal, and other fossil deposits, are known to enhance soil health and plant growth. They are rich in humic acids. These biostimulants account for the second-largest market share, representing 23.4% of the African biostimulant market by value in 2022.
- Seaweed extract-based biostimulants can potentially improve their market share in the African region due to their abundant availability in many coastal areas and their ability to decrease the need for chemical fertilizers in agriculture. These factors may drive the demand for seaweed-based biostimulants during the forecast period. Seaweed extract-based biostimulants accounted for about USD 23.1 million in 2022.
- Humic and fulvic acid-based biostimulants are anticipated to grow faster than other biostimulants between 2023 and 2029.
- Africa is known for its diverse agricultural systems, with a wide range of crops grown across the region. Agriculture plays a vital role in the African economy, and organic farming gained traction, with approximately 120 thousand hectares of organic crop area in 2021. Cereal crops, such as maize, wheat, and corn, are among the most widely grown crops in the region.
- One area of growth in African agriculture is the biostimulants market, which saw a significant increase in value, rising by approximately 18.7% from 2017 to 2021. This growth is expected to continue, with the market value projected to increase by 67.8%.
- The majority of the African biostimulants market is dominated by the Rest of African region, accounting for about 81.1% of the market value in 2022. Tunisia is the top organic producer in terms of area, and Ethiopia has the highest number of organic producers, with approximately 220,000 in 2020. However, the lack of legislation for organic farming in most African countries has hampered the establishment of a well-established biostimulant market in some areas.
- Seaweed-based biostimulants make up 43.8% of the market value, valued at about USD 3.4 million in 2022. The use of seaweed extract-based biostimulants is prevalent in Nigeria.
- The demand for biostimulants in Africa is expected to rise in the coming years, driven by increasing consumer interest in organic products, both domestically and internationally. Farmers are becoming more informed about the drawbacks of heavy reliance on chemical inputs and the economic benefits of using biostimulants. With these factors in play, the biostimulants market in Africa is poised for significant growth, providing opportunities for both farmers and businesses in the region.
Africa Biostimulants Market Trends
8,34,000 organic producers are in the region's organic sector with Tunisia is having more organic land
- In 2022, the area of organic agricultural land in the African region amounted to over 1.2 million hectares, representing 9.0% of the global organic agricultural area.
- In 2020, Africa reported 149,000 hectares more in organic cultivation land than in 2019, recording a 7.7% increase Y-o-Y in line with the presence of nearly 834,000 producers. Tunisia had the largest amount of organic land (more than 290,000 hectares in 2020), whereas Ethiopia had the highest number of organic producers (almost 220,000). The island states of Sao Tome and Principe have the most significant amount of land committed to organic farming in the region, with 20.7% of their agricultural area dedicated to organic crops.
- In the African region, cash crops account for a significant share of organic agricultural land, amounting to 63.2% of the total organic acreage with 817.4 thousand hectares. Row crops hold the second-largest share of organic acreage in Africa, which amounts to about 25.6% of the total organic acreage, totaling 331.2 thousand hectares. Horticultural crops account for 11.2% of the total organic acreage in Africa, with 144.9 thousand hectares in 2022.
- The African countries with significant organic agricultural acreage include the Rest of Africa regional segment, Egypt, and South Africa. In 2022, the Rest of Africa segment accounted for 95.0% of the total organic agricultural acreage in Africa, with 1.2 million hectares, Egypt accounted for a 3.5% share with 45.1 thousand hectares, and South Africa accounted for a 1.0% share with 12.6 thousand hectares.
- Organic agricultural acreage rose by 6.9% between 2017 and 2022 in Africa. It is anticipated to increase by about 52.2% and reach USD 2.0 million by 2029.
Per capita spending on organic product predominant in Egypt, South Africa, and Nigeria countries
- Africa's per capita income has consistently increased throughout the years, encouraging people to spend more money on nutritious food. Organic foods and beverages are gaining more shelf space in the African region. Since the domestic consumption of certified organic produce is relatively small, most organic goods are produced for export.
- In Africa, consumption of organic products has increased significantly, especially in Egypt, South Africa, and Nigeria. In 2021, the per capita consumption of organic products was USD 55.5 in Egypt, followed by South Africa with USD 7.1. The countries with the highest number of organic producers were Ethiopia (almost 222,000), Tanzania (nearly 149,000), and Uganda (over 139,000).
- In the African region, commonly consumed organic products include fresh vegetables and fruits. In Africa, significant efforts have been made to mainstream organic agriculture into policy, national extension systems, marketing, and value chain development. All these factors have gained the attention of consumers.
- With the increasing per capita consumption of beverages, primarily fruit juices, growing health awareness, and consumers shifting toward organic drinks and food that do not contain chemical ingredients, the demand for the African organic food market is expected to grow between 2023 and 2029.
- However, low-income levels and a lack of organic standards and other infrastructure for local market certification are the major restraining factors for the growth of the organic market in the region.
Africa Biostimulants Industry Overview
The Africa Biostimulants Market is fragmented, with the top five companies occupying 18.64%. The major players in this market are Biolchim SPA, Coromandel International Ltd, Koppert Biological Systems Inc., T. Stanes and Company Limited and Trade Corporation International (sorted alphabetically).
Additional Benefits:
- The market estimate (ME) sheet in Excel format
- 3 months of analyst support
TABLE OF CONTENTS
1 EXECUTIVE SUMMARY & KEY FINDINGS
2 REPORT OFFERS
3 INTRODUCTION
- 3.1 Study Assumptions & Market Definition
- 3.2 Scope of the Study
- 3.3 Research Methodology
4 KEY INDUSTRY TRENDS
- 4.1 Area Under Organic Cultivation
- 4.2 Per Capita Spending On Organic Products
- 4.3 Regulatory Framework
- 4.3.1 Egypt
- 4.3.2 Nigeria
- 4.3.3 South Africa
- 4.4 Value Chain & Distribution Channel Analysis
5 MARKET SEGMENTATION (includes market size in Value in USD and Volume, Forecasts up to 2030 and analysis of growth prospects)
- 5.1 Form
- 5.1.1 Amino Acids
- 5.1.2 Fulvic Acid
- 5.1.3 Humic Acid
- 5.1.4 Protein Hydrolysates
- 5.1.5 Seaweed Extracts
- 5.1.6 Other Biostimulants
- 5.2 Crop Type
- 5.2.1 Cash Crops
- 5.2.2 Horticultural Crops
- 5.2.3 Row Crops
- 5.3 Country
- 5.3.1 Egypt
- 5.3.2 Nigeria
- 5.3.3 South Africa
- 5.3.4 Rest of Africa
6 COMPETITIVE LANDSCAPE
- 6.1 Key Strategic Moves
- 6.2 Market Share Analysis
- 6.3 Company Landscape
- 6.4 Company Profiles (includes Global Level Overview, Market Level Overview, Core Business Segments, Financials, Headcount, Key Information, Market Rank, Market Share, Products and Services, and Analysis of Recent Developments).
- 6.4.1 Atlantica Agricola
- 6.4.2 Biolchim SPA
- 6.4.3 Coromandel International Ltd
- 6.4.4 Haifa Group
- 6.4.5 Humic Growth Solutions Inc.
- 6.4.6 Koppert Biological Systems Inc.
- 6.4.7 Microbial Biological Fertilizers International
- 6.4.8 T. Stanes and Company Limited
- 6.4.9 Trade Corporation International
- 6.4.10 UPL
7 KEY STRATEGIC QUESTIONS FOR AGRICULTURAL BIOLOGICALS CEOS
8 APPENDIX
- 8.1 Global Overview
- 8.1.1 Overview
- 8.1.2 Porter's Five Forces Framework
- 8.1.3 Global Value Chain Analysis
- 8.1.4 Market Dynamics (DROs)
- 8.2 Sources & References
- 8.3 List of Tables & Figures
- 8.4 Primary Insights
- 8.5 Data Pack
- 8.6 Glossary of Terms
 生物刺激剂:市场占有率分析、产业趋势与统计、成长预测(2026-2031)
 日本生物刺激剂市场报告(按产品类型、作物类型、形态、产地、配销通路、应用、最终用户和地区划分,2026-2034年)
 美国生物刺激剂及生物肥料市场分析及机会
 全球植物健康诱导剂市场:预测至2032年-按诱导剂类型、製剂、作用机制、作物类型、应用方法、最终用户、通路和地区进行分析
 生物刺激剂市场机会、成长驱动因素、产业趋势分析及预测(2025-2034年)2032年农业生物刺激素市场预测:按活性成分、作物类型、施用方法、配方和地区进行的全球分析
 海洋生物刺激素市场-全球产业规模、份额、趋势、机会和预测,按成分、应用模式、最终用途、地区和竞争细分,2020-2030 年预测
 生物刺激素市场(按形态、来源、使用方法和作物类型)—2025-2032 年全球预测生物刺激素市场-全球产业规模、份额、趋势、机会及预测(按活性成分、作物类型、应用、地区和竞争情况细分,2020-2030 年)
 腐植酸基生物刺激素市场,依产品类型、形式、应用、作物类型、国家划分 - 2025 年至 2032 年全球产业分析、市场规模、市场份额及预测