


 |
市场调查报告书
商品编码
1939064
工程塑胶:市场占有率分析、产业趋势与统计、成长预测(2026-2031)Engineering Plastics - Market Share Analysis, Industry Trends & Statistics, Growth Forecasts (2026 - 2031) |
||||||
※ 本网页内容可能与最新版本有所差异。详细情况请与我们联繫。
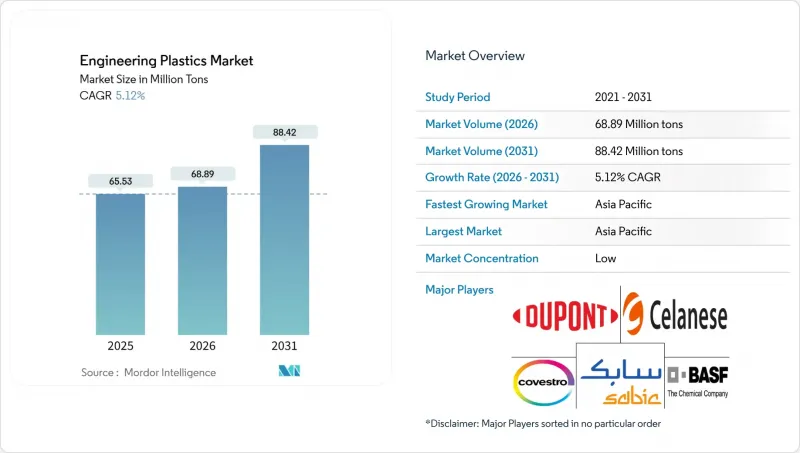
2025年工程塑胶市场价值为6,225万吨,预计2031年将达到8,354万吨,高于2026年的6,538万吨。
预计在预测期(2026-2031 年)内,复合年增长率将达到 5.03%。
轻量化计画在交通运输和航太的应用、车辆和工业设备的电气化以及半导体製造的日益普及,都推动了对高强度重量比和几何自由度高的材料的需求。亚太地区持续的产能投资、商业规模化学回收的兴起以及旨在提高燃油效率和减少碳排放的法规,进一步增强了这一增长势头。
全球工程塑胶市场趋势与洞察
促进交通运输和航太领域的轻量化发展
汽车燃油经济法规(例如,美国CAFE标准要求到2025年达到54.5英里/加仑的燃油经济性)正在推动汽车製造商(OEM)进行轻量化研发,预计每减重10%,燃油经济性就能提高6%至8%。飞机项目也呈现类似的趋势。波音787飞机采用50%的复合材料材料,实现了22%的燃油节省;空中巴士A350飞机采用53%的复合材料,也取得了类似的燃油经济性提升。碳纤维增强热塑性塑胶(CFTP)正日益普及,因为与热固性塑胶不同,CFTP可以重新加热和回收利用,自动化纤维铺放技术正在缩短生产週期。风力发电机叶片目前消耗的碳纤维比航太工业还要多,100公尺长的碳纤维叶片比玻璃纤维叶片减重38%。这些成功案例增强了正在评估用于轮毂、座椅和飞机辅助结构的聚合物基结构的OEM製造商的信心。
电气化所带来的快速需求
高压电动车需要具有优异阻燃性和介电强度的机壳,这推动了对聚亚苯硫醚、聚醚醚酮和玻璃纤维增强聚酰胺的需求。特斯拉Optimus原型机等机器人生产线凸显了PEEK在连续使用下的耐久性,证明了其在高檔致动器中的有效性。人工智慧晶片的半导体製造厂在细间距连接器中使用液晶聚合物,这种聚合物在260°C以上的温度下仍能保持尺寸稳定性,从而确保无铅回流焊接过程中的讯号完整性。电动车(EV)架构从400V到800V的过渡对介电强度提出了更高的要求,原始设备製造商(OEM)要求绝缘材料的相对追踪指数(CTI)达到600或更高。同时,聚碳酸酯-硅氧烷混合物越来越多地被用于防止热失控,无需依赖厚重的金属屏蔽层即可阻止热传递。
单体价格波动
丙烯和乙烯价格与原油价格波动密切相关。这是因为亚洲裂解装置严重依赖石脑油,原油价格每上涨10美元/桶,丙烯成本就会上涨90美元/吨,从而挤压了以固定价格OEM合约销售的转换商的利润空间。 2025年上半年,中国苯乙烯单体产能达2,151万吨,占全球供应量的49%。这导致现货价格暴跌至高成本生产商的现金成本以下。主要经济体之间关税的提高进一步扭曲了贸易流量,迫使苯乙烯类ABS和聚碳酸酯工厂大幅减产。高性能树脂,例如聚酰亚胺,尤其容易受到价格波动的影响,因为特种二酐单体的交易价格是商品原料价格的四到五倍,这限制了下游市场供应紧张时转嫁价格上涨的能力。
细分市场分析
聚对苯二甲酸乙二醇酯(PET)在工程塑胶市场中占据主导地位,预计到2025年将维持50.05%的市场份额,这主要得益于饮料和硬包装的普遍需求。然而,该领域面临一次性产品需求成长放缓以及日益提高的再生材料含量目标,这需要对生产流程进行投资。随着汽车製造商选择生物基PA11来减少范围3排放,同时又不影响拉伸强度,聚酰胺共混物正重新受到青睐。氟聚合物虽然目前在工程塑胶市场仅占个位数的中等份额,但预计将以7.34%的复合年增长率快速成长,这得益于其卓越的耐化学性和耐热性,使其在航太线材涂层和7奈米以下晶片製造领域得到广泛应用。
聚砜、PEEK(聚醚醚酮)和液晶聚合物适用于熔点高于280°C、连续使用温度高于240°C的特定应用。聚碳酸酯虽然因其双酚A(BPA)含量在食品容器中的应用而备受关注,但其优异的抗衝击性使其在玻璃製品和家用电器机壳保持主导地位。聚甲醛因其良好的加工性能而适用于齿轮和窗户升降器,而苯乙烯共聚物的性能介于通用ABS树脂和特殊共混物之间,是兼顾强度和成本的家用电器框架的标准材料。
工程塑胶市场报告按树脂类型(含氟聚合物、液晶聚合物、聚酰胺、聚丁烯对苯二甲酸酯、聚碳酸酯等)、终端用户产业(航太、汽车、建筑等)和地区(亚太、北美、欧洲、南美、中东和非洲)进行细分。市场预测以数量(吨)和价值(美元)为单位。
区域分析
预计到2025年,亚太地区将占全球工程塑胶市场份额的55.10%,并在2031年之前以5.38%的复合年增长率增长,这主要得益于中国和印度产能的扩张、电动车(EV)的加速普及以及电子产品出口需求的持续增长。中国的苯乙烯产量已占全球总产量的49%,巩固了其在该地区的价格主导。同时,各国政府也积极推动高附加价值聚合物的自给自足。印度正利用税额扣抵和进口关税减免等政策,吸引那些觊觎其南部汽车产业基地的跨国模具製造商。日本专注于半导体光掩模用超高纯度聚合物,这表明该地区的聚合物市场覆盖范围广,从大规模生产到高附加价值应用均有涉及。
北美地区得益于民用航太领域的强劲需求以及从密西根州延伸至乔治亚的不断扩张的电池製造走廊。包括美国税法S 45Z无污染燃料抵免(针对化学回收生产)在内的先进回收立法支持,正在刺激循环经济领域的创新。欧洲正透过其「绿色交易」引领永续性发展,推动生物基聚酰胺和化学回收聚碳酸酯的研发。然而,高昂的电力成本和关于全氟烷基和多氟烷基物质(PFAS)的争议阻碍了含氟聚合物产能的扩张。
由于巴西和阿根廷汽车产业的本土化,南美洲市场正经历渐进式成长,但高性能树脂仍依赖净进口。中东和非洲地区正崛起为投资热点,这得益于阿布达比国家石油公司(ADNOC)的垂直整合策略,一旦科思创的产能协同效应得以实现,该地区有望成为特种工程树脂的净出口地区。在所有地区,推动工程塑胶市场规模成长的因素是供应链全球化以及下游製造业的转型,而不仅仅是树脂生产基地的扩张。
其他福利:
- Excel格式的市场预测(ME)表
- 分析师支持(3个月)
目录
第一章 引言
- 研究假设和市场定义
- 调查范围
第二章调查方法
第三章执行摘要
第四章 市场情势
- 市场概览
- 市场驱动因素
- 促进交通运输和航太领域的轻量化发展
- 电气化主导和快速需求成长
- 亚太地区製造业转移趋势
- 电动车电池模组外壳采用情况
- 化学品回收供应增加
- 原始设备製造商转向生物基光声/光热疗法
- 市场限制
- 单体价格波动
- 加强包装法规
- 萤石相关氟树脂短缺
- 金属增材製造(AM)替代的风险
- 价值炼和通路分析
- 波特五力模型
- 新进入者的威胁
- 供应商的议价能力
- 买方的议价能力
- 替代品的威胁
- 产业间竞争
- 进出口趋势
- 氟树脂交易
- 聚酰胺(PA)交易
- 聚对苯二甲酸乙二酯(PET)贸易
- 聚甲基丙烯酸甲酯(PMMA)贸易
- 聚甲醛(POM)贸易
- 苯乙烯共聚物(ABS和SAN)的贸易
- 聚碳酸酯(PC)贸易
- 价格趋势
- 氟树脂
- 聚碳酸酯(PC)
- 聚对苯二甲酸乙二醇酯(PET)
- 聚甲醛(POM)
- 聚甲基丙烯酸甲酯(PMMA)
- 苯乙烯共聚物(ABS 和 SAN)
- 聚酰胺(PA)
- 回收利用概述
- 聚酰胺(PA)回收趋势
- 聚碳酸酯(PC)回收趋势
- 聚对苯二甲酸乙二醇酯(PET)回收趋势
- 苯乙烯共聚物(ABS 和 SAN)的回收趋势
- 法律规范
- 授权人概览
- 产品概览
- 终端用户产业趋势
- 航太(航太零件生产收入)
- 汽车(汽车产量)
- 建筑与施工(新建建筑占地面积)
- 电气电子设备(电气电子设备生产收入)
- 包装(塑胶包装用量)
第五章 市场规模及成长预测(数量与以金额为准)
- 依树脂类型
- 氟树脂
- 乙烯-四氟乙烯(ETFE)
- 氟化乙烯丙烯(FEP)
- 聚四氟乙烯(PTFE)
- 聚偏氟乙烯(PVF)
- 聚二氟亚乙烯(PVDF)
- 其他树脂类型
- 液晶聚合物(LCP)
- 聚酰胺(PA)
- 芳香聚酰胺
- 聚酰胺(PA)6
- 聚酰胺(PA)66
- 聚邻苯二甲酰胺
- 聚丁烯对苯二甲酸酯(PBT)
- 聚碳酸酯(PC)
- 聚醚醚酮(PEEK)
- 聚对苯二甲酸乙二醇酯(PET)
- 聚酰亚胺(PI)
- 聚甲基丙烯酸甲酯(PMMA)
- 聚甲醛(POM)
- 苯乙烯共聚物(ABS、SAN)
- 氟树脂
- 按最终用户行业划分
- 航太
- 车
- 建筑/施工
- 电气和电子设备
- 工业和机械
- 包装
- 其他终端用户产业
- 按地区
- 亚太地区
- 中国
- 印度
- 日本
- 韩国
- 澳洲
- 马来西亚
- 亚太其他地区
- 北美洲
- 我们
- 加拿大
- 墨西哥
- 欧洲
- 德国
- 法国
- 英国
- 义大利
- 俄罗斯
- 其他欧洲地区
- 南美洲
- 巴西
- 阿根廷
- 其他南美洲
- 中东和非洲
- 沙乌地阿拉伯
- 阿拉伯聯合大公国
- 南非
- 奈及利亚
- 其他中东和非洲地区
- 亚太地区
第六章 竞争情势
- 市场集中度
- 策略趋势
- 市占率(%)/排名分析
- 公司简介
- Alfa SAB de CV
- Arkema
- Asahi Kasei Corporation
- BASF
- Celanese Corporation
- CHIMEI
- Covestro AG
- Dongyue Group
- Envalior
- DuPont
- Evonik Industries AG
- Far Eastern New Century Co., Ltd.
- Indorama Ventures Public Company Limited.
- Lanxess AG
- LG Chem
- Mitsubishi Chemical Group Corporation
- SABIC
- Syensqo
- Teijin Limited
- Toray Industries Inc.
- Victrex plc
第七章 市场机会与未来展望
第八章:执行长面临的关键策略挑战
The Engineering Plastics Market was valued at 62.25 million tons in 2025 and estimated to grow from 65.38 million tons in 2026 to reach 83.54 million tons by 2031, at a CAGR of 5.03% during the forecast period (2026-2031).
Demand stems from lightweighting programs across the mobility and aerospace sectors, the electrification of vehicles and industrial equipment, and the growing adoption of semiconductor fabrication, all of which reward materials that offer high strength-to-weight ratios and geometric freedom. Sustained capital spending on Asia-Pacific capacity, the emergence of chemical recycling at a commercial scale, and regulatory pushes for fuel economy and carbon reduction further reinforce growth momentum.
Global Engineering Plastics Market Trends and Insights
Lightweighting Push in Mobility and Aerospace
Automotive fuel-economy mandates, such as the US CAFE target of 54.5 mpg by 2025, intensify OEM (original equipment manufacturer) focus on weight reduction, and every 10% mass cut yields 6-8% efficiency gains. Aircraft programs illustrate parallel dynamics: the Boeing 787 achieved 22% fuel savings with 50% composite content, while the Airbus A350 utilizes 53% composites to achieve a similar effect. Carbon-fiber-reinforced thermoplastics gain share because they can be reheated and recycled, unlike thermosets, and automated fiber placement lowers cycle times. Wind-turbine blades now consume larger volumes of carbon fiber than the aerospace industry, with 100-meter blades trimming mass by 38% compared to glass-fiber designs. These successes raise confidence among OEMs evaluating polymer-based structures for wheels, seating, and secondary aircraft structures.
Electrification-Led Demand Spike
High-voltage electric vehicles require enclosures that offer robust flame retardancy and dielectric strength, pushing polyphenylene sulfide, polyether ether ketone, and glass-filled polyamide consumption upward. Robotics lines such as Tesla's Optimus prototype highlight PEEK's longevity under continuous duty, validating higher-end grades for actuators. Semiconductor fabs scaling for AI chips adopt liquid-crystal polymers for fine-pitch connectors that remain dimensionally stable above 260 °C, preserving signal integrity during lead-free reflow. The migration from 400-V to 800-V EV (electric vehicle) architectures amplifies dielectric stress, prompting OEMs to specify insulation with comparative tracking index (CTI) values above 600. Meanwhile, thermal-runaway barriers increasingly incorporate polycarbonate-siloxane blends to prevent heat propagation without resorting to heavy metallic shields.
Monomer Price Volatility
Propylene and ethylene prices track crude swings because Asian crackers rely heavily on naphtha; a USD 10/bbl oil jump can increase propylene costs by USD 90/ton, compressing converters' margins when selling into fixed-price OEM contracts. China's styrene monomer capacity reached 21.51 million tons in H1 2025, accounting for 49% of the global supply and triggering spot price collapses below cash costs for high-cost producers. Tariff escalations between major economies further distort trade flows, forcing rapid output cuts at styrene-based ABS and polycarbonate plants. Volatility particularly stings high-performance resins such as polyimide, whose specialized dianhydride monomers command 4-5X commodity feedstock prices, limiting the ability to pass on surges in tight downstream markets.
Other drivers and restraints analyzed in the detailed report include:
- APAC Manufacturing Migration
- EV Battery Module Housings Adoption
- Packaging Regulations Tightening
For complete list of drivers and restraints, kindly check the Table Of Contents.
Segment Analysis
Polyethylene terephthalate (PET) maintained a commanding 50.05% engineering plastics market share in 2025, driven by ubiquitous demand for beverages and rigid packaging. Yet the segment contends with plateauing single-use volumes and mounting recycled-content targets that require process investments. Polyamide blends are gaining renewed traction as automakers opt for bio-based PA11 to reduce scope 3 emissions without compromising tensile strength. Fluoropolymers, although comprising only a mid-single-digit slice of the engineering plastics market, post the fastest 7.34% CAGR because their unrivaled chemical and thermal resistance support aerospace wire coatings and sub-7 nm chip making.
Polysulfones, PEEK (Polyetheretherketone or Polyether Ether Ketone), and liquid-crystal polymers are suitable for niche applications where melting points exceed 280°C and continuous-use temperatures surpass 240°C. Polycarbonate endures scrutiny for BPA (Bisphenol A) in foodware but retains dominance in glazing and consumer electronics housings due to its impact resilience. Polyoxymethylene offers machining ease for gears and window lifters, while styrene copolymers bridge the gap between commodity ABS (Acrylonitrile Butadiene Styrene) and specialty blends, making them a go-to for appliance frames that require balanced toughness and cost.
The Engineering Plastics Market Report is Segmented by Resin Type (Fluoropolymer, Liquid Crystal Polymer, Polyamide, Polybutylene Terephthalate, Polycarbonate, and More), End-User Industry (Aerospace, Automotive, Building and Construction, and More), and Geography (Asia-Pacific, North America, Europe, South America, and Middle East and Africa). The Market Forecasts are Provided in Terms of Volume (Tons) and Value (USD).
Geography Analysis
The Asia-Pacific region led with a 55.10% engineering plastics market share in 2025 and is expected to expand at a 5.38% CAGR through 2031, driven by the build-out of Chinese and Indian capacities, accelerating EV adoption, and sustained electronics export demand. Chinese styrene production, already 49% of global output, reinforces regional price leadership, while state policies encourage high-value polymer self-sufficiency. India leverages tax credits and import duty relief to draw multinational molders eyeing southern automotive hubs. Japan focuses on ultra-high-purity polymers for semiconductor photomasks, demonstrating the region's spectrum from volume to value.
North America enjoys robust demand from the commercial aerospace sector and an expanding battery-manufacturing corridor that stretches from Michigan to Georgia. Legislative support for advanced recycling, including the US Internal Revenue Code S 45Z clean-fuel credits applicable to chemical recycling outputs, incentivizes innovation in the circular economy. Europe champions sustainability leadership through the Green Deal, spurring R&D in bio-based PA and chemically recycled polycarbonate, although high power costs and PFAS debates weigh on fluoropolymer capacity additions.
South America sees incremental growth tied to automotive localization in Brazil and Argentina, yet remains net-import-reliant for high-performance grades. Middle East & Africa emerge as investment destinations following ADNOC's vertical integration move, which positions the region as a potential net exporter of specialty engineering resins once Covestro capacity synergies materialize. Across all regions, the globalization of supply chains means that engineering plastics market size evolves in lock-step with downstream manufacturing shifts rather than mere resin production footprints.
- Alfa S.A.B. de C.V.
- Arkema
- Asahi Kasei Corporation
- BASF
- Celanese Corporation
- CHIMEI
- Covestro AG
- Dongyue Group
- Envalior
- DuPont
- Evonik Industries AG
- Far Eastern New Century Co., Ltd.
- Indorama Ventures Public Company Limited.
- Lanxess AG
- LG Chem
- Mitsubishi Chemical Group Corporation
- SABIC
- Syensqo
- Teijin Limited
- Toray Industries Inc.
- Victrex plc
Additional Benefits:
- The market estimate (ME) sheet in Excel format
- 3 months of analyst support
TABLE OF CONTENTS
1 Introduction
- 1.1 Study Assumptions and Market Definition
- 1.2 Scope of the Study
2 Research Methodology
3 Executive Summary
4 Market Landscape
- 4.1 Market Overview
- 4.2 Market Drivers
- 4.2.1 Lightweighting Push in Mobility and Aerospace
- 4.2.2 Electrification-led and Demand Spike
- 4.2.3 Asia-Pacific Manufacturing Migration
- 4.2.4 EV Battery Module Housings Adoption
- 4.2.5 Chemical-recycling Supply Boosts
- 4.2.6 OEM switch to bio-based PA/PTT
- 4.3 Market Restraints
- 4.3.1 Monomer Price Volatility
- 4.3.2 Packaging Regulations Tightening
- 4.3.3 Fluorspar-linked Fluoropolymer Shortage
- 4.3.4 Metal AM substitution threat
- 4.4 Value Chain and Distribution Channel Analysis
- 4.5 Porter's Five Forces
- 4.5.1 Threat of New Entrants
- 4.5.2 Bargaining Power of Suppliers
- 4.5.3 Bargaining Power of Buyers
- 4.5.4 Threat of Substitutes
- 4.5.5 Industry Rivalry
- 4.6 Import And Export Trends
- 4.6.1 Fluoropolymer Trade
- 4.6.2 Polyamide (PA) Trade
- 4.6.3 Polyethylene Terephthalate (PET) Trade
- 4.6.4 Polymethyl Methacrylate (PMMA) Trade
- 4.6.5 Polyoxymethylene (POM) Trade
- 4.6.6 Styrene Copolymers (ABS and SAN) Trade
- 4.6.7 Polycarbonate (PC) Trade
- 4.7 Price Trends
- 4.7.1 Fluoropolymer
- 4.7.2 Polycarbonate (PC)
- 4.7.3 Polyethylene Terephthalate (PET)
- 4.7.4 Polyoxymethylene (POM)
- 4.7.5 Polymethyl Methacrylate (PMMA)
- 4.7.6 Styrene Copolymers (ABS and SAN)
- 4.7.7 Polyamide (PA)
- 4.8 Recycling Overview
- 4.8.1 Polyamide (PA) Recycling Trends
- 4.8.2 Polycarbonate (PC) Recycling Trends
- 4.8.3 Polyethylene Terephthalate (PET) Recycling Trends
- 4.8.4 Styrene Copolymers (ABS and SAN) Recycling Trends
- 4.9 Regulatory Framework
- 4.10 Licensors Overview
- 4.11 Production Overview
- 4.12 End-use Sector Trends
- 4.12.1 Aerospace (Aerospace Component Production Revenue)
- 4.12.2 Automotive (Automobile Production)
- 4.12.3 Building and Construction (New Construction Floor Area)
- 4.12.4 Electrical and Electronics (Electrical and Electronics Production Revenue)
- 4.12.5 Packaging(Plastic Packaging Volume)
5 Market Size and Growth Forecasts (Volume and Value)
- 5.1 By Resin Type
- 5.1.1 Fluoropolymer
- 5.1.1.1 Ethylenetetrafluoroethylene (ETFE)
- 5.1.1.2 Fluorinated Ethylene-propylene (FEP)
- 5.1.1.3 Polytetrafluoroethylene (PTFE)
- 5.1.1.4 Polyvinylfluoride (PVF)
- 5.1.1.5 Polyvinylidene Fluoride (PVDF)
- 5.1.1.6 Other Sub Resin Types
- 5.1.2 Liquid Crystal Polymer (LCP)
- 5.1.3 Polyamide (PA)
- 5.1.3.1 Aramid
- 5.1.3.2 Polyamide (PA) 6
- 5.1.3.3 Polyamide (PA) 66
- 5.1.3.4 Polyphthalamide
- 5.1.4 Polybutylene Terephthalate (PBT)
- 5.1.5 Polycarbonate (PC)
- 5.1.6 Polyether Ether Ketone (PEEK)
- 5.1.7 Polyethylene Terephthalate (PET)
- 5.1.8 Polyimide (PI)
- 5.1.9 Polymethyl Methacrylate (PMMA)
- 5.1.10 Polyoxymethylene (POM)
- 5.1.11 Styrene Copolymers (ABS, SAN)
- 5.1.1 Fluoropolymer
- 5.2 By End-User Industry
- 5.2.1 Aerospace
- 5.2.2 Automotive
- 5.2.3 Building and Construction
- 5.2.4 Electrical and Electronics
- 5.2.5 Industrial and Machinery
- 5.2.6 Packaging
- 5.2.7 Other End-user Industries
- 5.3 By Geography
- 5.3.1 Asia-Pacific
- 5.3.1.1 China
- 5.3.1.2 India
- 5.3.1.3 Japan
- 5.3.1.4 South Korea
- 5.3.1.5 Australia
- 5.3.1.6 Malaysia
- 5.3.1.7 Rest of Asia-Pacific
- 5.3.2 North America
- 5.3.2.1 United States
- 5.3.2.2 Canada
- 5.3.2.3 Mexico
- 5.3.3 Europe
- 5.3.3.1 Germany
- 5.3.3.2 France
- 5.3.3.3 United Kingdom
- 5.3.3.4 Italy
- 5.3.3.5 Russia
- 5.3.3.6 Rest of Europe
- 5.3.4 South America
- 5.3.4.1 Brazil
- 5.3.4.2 Argentina
- 5.3.4.3 Rest of South America
- 5.3.5 Middle East and Africa
- 5.3.5.1 Saudi Arabia
- 5.3.5.2 United Arab Emirates
- 5.3.5.3 South Africa
- 5.3.5.4 Nigeria
- 5.3.5.5 Rest of Middle East and Africa
- 5.3.1 Asia-Pacific
6 Competitive Landscape
- 6.1 Market Concentration
- 6.2 Strategic Moves
- 6.3 Market Share (%)**/Ranking Analysis
- 6.4 Company Profiles (includes Global level Overview, Market level overview, Core Segments, Financials as available, Production Capacity, Strategic Information, Market Rank/Share for key companies, Products and Services, and Recent Developments)
- 6.4.1 Alfa S.A.B. de C.V.
- 6.4.2 Arkema
- 6.4.3 Asahi Kasei Corporation
- 6.4.4 BASF
- 6.4.5 Celanese Corporation
- 6.4.6 CHIMEI
- 6.4.7 Covestro AG
- 6.4.8 Dongyue Group
- 6.4.9 Envalior
- 6.4.10 DuPont
- 6.4.11 Evonik Industries AG
- 6.4.12 Far Eastern New Century Co., Ltd.
- 6.4.13 Indorama Ventures Public Company Limited.
- 6.4.14 Lanxess AG
- 6.4.15 LG Chem
- 6.4.16 Mitsubishi Chemical Group Corporation
- 6.4.17 SABIC
- 6.4.18 Syensqo
- 6.4.19 Teijin Limited
- 6.4.20 Toray Industries Inc.
- 6.4.21 Victrex plc
7 Market Opportunities and Future Outlook
- 7.1 White-space and Unmet-need Assessment
- 7.2 Self-Healing Plastics
8 Key Strategic Questions for CEOs
 2026年全球工程塑胶市场报告
 5G专用工程塑胶:按树脂类型、製程、应用和最终用途产业分類的全球预测,2026-2032年PA66工程塑胶市场依製造流程、产品类型、等级及最终用途产业划分-2026-2032年全球预测
 先进工程聚合物市场预测至2032年:按聚合物类型、形态、性能、技术、最终用户和地区分類的全球分析
 日本工程塑胶市场报告(按树脂类型、最终用途产业和地区划分,2026-2034年)
 工程塑胶市场规模、份额和成长分析(按树脂类型、最终用途和地区划分)-2026-2033年产业预测
 改质塑胶市场规模、占有率、预测及趋势分析:依产品类型、改质类型和应用划分 - 全球预测至 2035 年
 工程塑胶市场规模、占有率、成长及全球产业分析:依类型、应用和地区划分的洞察与预测(2024-2032 年)
 PEEK特种工程塑胶:全球市场占有率及排名、总收入及需求预测(2025-2031年)PA66工程塑胶:全球市场份额和排名、总收入和需求预测(2025-2031年)