


 |
市场调查报告书
商品编码
1686230
聚酰亚胺(PI) -市场占有率分析、产业趋势与统计、成长预测(2024-2029)Polyimides (PI) - Market Share Analysis, Industry Trends & Statistics, Growth Forecasts (2024 - 2029) |
||||||
价格
※ 本网页内容可能与最新版本有所差异。详细情况请与我们联繫。
简介目录
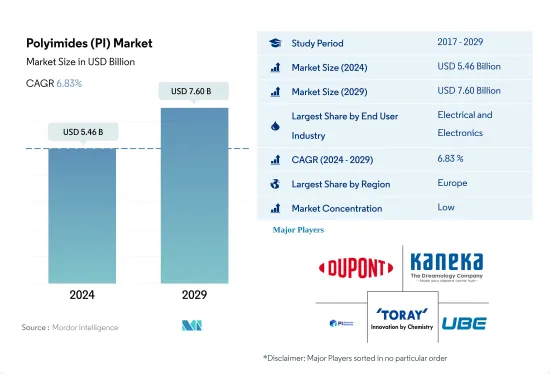
聚酰亚胺 (PI) 市场规模预计在 2024 年为 54.6 亿美元,预计到 2029 年将达到 76 亿美元,预测期内(2024-2029 年)的复合年增长率为 6.83%。
消费性电子产品需求强劲带动市场需求
- 聚酰亚胺是一种高性能塑料,能够承受高温和腐蚀环境。它们具有非粘性和低摩擦特性,适用于各种最终用户行业,包括航太、电子、汽车和通讯。
- 2022 年,电气和电子产业在销售方面占据最大的市场占有率。随着企业开始采用在家工作模式,人们开始建立家庭办公室,消费者开始转向笔记型电脑、行动电话和智慧型装置等家用电子电器,这导致家用电子电器的需求激增,从而增加了聚酰亚胺的消费量。预计到 2023 年,全球消费性电子产品销售额将成长至 11,030 亿美元,2023 年至 2027 年的复合年增长率为 2.17%。
- 航太是第二大领域,也是成长最快的领域,预计在预测期内(2023-2029 年)的复合年增长率以金额为准7.78%。这种成长归因于全球航太零件产量的增加。例如,航太业的生产收入预计将在2022年达到4,660亿美元,而2021年为4,300亿美元。欧洲航太业是聚酰亚胺的最大消费国,其中法国在2022年占欧洲市场占有率的28.83%,成为欧洲最大的聚酰亚胺消费国。法国是多家全球航太零件製造商和飞机製造商的所在地,其中包括达梭航空和空中巴士。聚酰亚胺的需求也受到现有产业的支持。
中国和日本将主导亚太地区PI成长
- 2022 年,亚太地区是聚酰亚胺消费量最大的地区。预计将成为成长第四快的地区(以以金额为准),预测期内的复合年增长率为 7.10%。这一增长是由中国和日本等国家推动的,这两个国家分别占该全部区域消费量的59%和13%。
- 中国电子电气产业是聚酰亚胺的主要消费产业,预计到2022年将占全国聚酰亚胺总消费量的50%。随着企业开始采用在家工作模式、人们开始设立家庭办公室,笔记型电脑、行动电话等消费性电子产品的需求大幅增加,进而带动聚酰亚胺的需求增加。预计这一趋势将持续下去,到 2023 年中国家用电子电器产业的销售额预计将达到 2,576 亿美元。
- 阿联酋是中东地区成长最快的地区之一。预计预测期内(2023-2029 年)其以金额为准复合年增长率为 8.98%。该国的电气和电子产业是成长最快的终端用户。预计电气和电子设备产量将在 2029 年达到 730 亿美元,而 2022 年为 390 亿美元。预计该国电子产品市场规模将从 2023 年的 24.1 亿美元成长到 2027 年的约 33.2 亿美元。
全球聚酰亚胺(PI)市场趋势
电子产业的技术进步可能推动成长
- 电子产品技术创新的快速步伐推动着对更新、更快的电气和电子产品的持续需求。 2022年,全球电气及电子产品销售额预计达到5.807兆美元,其中亚太地区占74%的市场占有率,其次是欧洲,占13%的市场份额。预计预测期内全球电气和电子设备市场复合年增长率将达到 6.61%。
- 2018年,亚太地区经济成长强劲,受中国、韩国、日本、印度和东南亚国协快速工业化的推动。 2020年,受疫情影响,晶片短缺、供应链效率低等因素导致全球电子电气生产放缓,营收与前一年同期比较增仅0.1%。由于疫情期间人们被迫待在室内,对远距工作和家庭娱乐消费性电子产品的需求推动了这一成长。
- 预测期内,对数位化、机器人、虚拟实境、扩增实境、物联网 (IoT) 和 5G 连接等先进技术的需求预计将成长。预计 2027 年全球电气和电子设备产量将成长 5.9%。由于技术进步,预测期内对消费性电子产品的需求预计将上升。例如,预计2027年全球消费性电子产业收益将达到约9,046亿美元,而2023年将达到7,191亿美元。因此,预计技术发展将在预测期内引领对电气和电子产品的需求。
聚酰亚胺(PI)产业概况
聚酰亚胺(PI)市场分散,前五大公司占32.57%的市占率。市场的主要企业有:杜邦公司、钟渊株式会社、PI Advanced Materials、东丽株式会社和宇部兴产株式会社(按字母顺序排列)。
其他福利
- Excel 格式的市场预测 (ME) 表
- 3个月的分析师支持
目录
第一章执行摘要和主要发现
第二章 报告要约
第三章 引言
- 研究假设和市场定义
- 研究范围
- 调查方法
第四章 产业主要趋势
- 最终用户趋势
- 航太
- 车
- 建筑与施工
- 电气和电子
- 包装
- 法律规范
- 阿根廷
- 澳洲
- 巴西
- 加拿大
- 中国
- EU
- 印度
- 日本
- 马来西亚
- 墨西哥
- 奈及利亚
- 俄罗斯
- 沙乌地阿拉伯
- 南非
- 韩国
- 阿拉伯聯合大公国
- 英国
- 美国
- 价值炼和通路分析
第五章市场区隔
- 最终用户产业
- 航太
- 车
- 电气和电子
- 工业/机械
- 其他最终用户产业
- 地区
- 非洲
- 按国家
- 奈及利亚
- 南非
- 其他非洲国家
- 亚太地区
- 按国家
- 澳洲
- 中国
- 印度
- 日本
- 马来西亚
- 韩国
- 其他亚太地区
- 欧洲
- 按国家
- 法国
- 德国
- 义大利
- 俄罗斯
- 英国
- 其他欧洲国家
- 中东
- 按国家
- 沙乌地阿拉伯
- 阿拉伯聯合大公国
- 其他中东地区
- 北美洲
- 按国家
- 加拿大
- 墨西哥
- 美国
- 南美洲
- 按国家
- 阿根廷
- 巴西
- 南美洲其他地区
- 非洲
第六章 竞争格局
- 关键策略趋势
- 市场占有率分析
- 商业状况
- 公司简介.
- China Wanda Group
- DuPont
- Jiaozuo Tianyi Technology Co., Ltd.
- Kaneka Corporation
- Mitsui Chemicals, Inc.
- PI Advanced Materials Co., Ltd.
- SZRH Film Technology Group
- Taimide Tech. Inc.
- Toray Industries, Inc.
- UBE Corporation
第七章:CEO面临的关键策略问题
第 8 章 附录
- 世界概况
- 概述
- 五力分析框架(产业吸引力分析)
- 全球价值链分析
- 市场动态(DRO)
- 资讯来源及延伸阅读
- 图片列表
- 关键见解
- 资料包
- 词彙表
简介目录
Product Code: 50844
The Polyimides (PI) Market size is estimated at 5.46 billion USD in 2024, and is expected to reach 7.60 billion USD by 2029, growing at a CAGR of 6.83% during the forecast period (2024-2029).
Significant demand for consumer electronics to aid market demand
- Polyimides are high-performance plastics that can withstand high temperatures and corrosive environments. Due to their non-adhesive and low friction properties, they are suitable for applications in various end-user industries like aerospace, electronics, automotive, and telecommunications.
- The electrical and electronics segment occupied the largest market share by volume in 2022. A significant shift of consumers toward consumer electronics like laptops, mobile phones, and smart devices as companies began adopting work-from-home models and people began setting up home offices caused a surge in demand for consumer electronics, which increased the consumption of polyimides. Global consumer electronics revenue is projected to grow to USD 1103 billion in 2023 and is expected to grow annually by 2.17% between 2023 and 2027.
- Aerospace is the second-largest segment and is likely to register a CAGR of 7.78% by value during the forecast period (2023-2029), making it the fastest-growing segment as well. This growth can be attributed to the increased production of aerospace components worldwide. For instance, aerospace production revenue reached USD 466 billion in 2022 compared to USD 430 billion in 2021. The European aerospace segment is the largest consumer of polyimides, of which France held 28.83% of the European market share by volume in 2022, making it the largest consumer of polyimides in Europe. France is home to multiple global aerospace components and aircraft manufacturers, such as Dassault Aviation and Airbus. The well-established nature of the industry has also supported the demand for polyimides.
China and Japan to dominate Asia-Pacific growth of PI
- Asia-Pacific was the largest segment in terms of consumption of polyimides in 2022. It is predicted to register a CAGR of 7.10% in terms of value during the forecast period, making it the fourth fastest-growing segment. This growth can be attributed to countries like China and Japan, which accounted for 59% and 13%, respectively, of the region's overall polyimide consumption in 2022.
- China's electrical and electronics industry is the major consumer of polyimides, accounting for 50% of the country's overall polyimide consumption in 2022. Owing to a significant increase in the demand for consumer electronics like laptops and mobiles as companies began adopting work-from-home models and people started setting up home offices, the demand for polyimides increased in the country. This trend is expected to continue in the future as China's consumer electronics segment is projected to generate a revenue of USD 257.6 billion by 2023.
- The United Arab Emirates is the fastest-growing segment in the Middle East, making it one of the fastest growing regions. It is likely to register a CAGR of 8.98% in terms of value during the forecast period [2023-2029]. The country's electrical and electronics segment is the fastest-growing end user. Electrical and electronics production is expected to reach USD 73 billion in 2029 compared to USD 39 billion in 2022. The electronics market in the country is projected to reach a market volume of around USD 3.32 billion in 2027 from USD 2.41 billion in 2023.
Global Polyimides (PI) Market Trends
Technological advancements in electronics industry may foster the growth
- The rapid pace of technological innovation in electronic products is driving the consistent demand for new and fast electrical and electronic products. In 2022, the global revenue of electrical and electronics stood at USD 5,807 billion, with Asia-Pacific holding a 74% market share, followed by Europe with a 13% share. The global electrical and electronics market is expected to record a CAGR of 6.61% during the forecast period.
- In 2018, the Asia-Pacific region witnessed strong economic growth owing to rapid industrialization in China, South Korea, Japan, India, and ASEAN countries. In 2020, due to the pandemic, there was a slowdown in global electrical and electronics production due to the shortage of chips and inefficiencies in the supply chain, which led to a stagnant growth rate of 0.1% in revenue compared to the previous year. This growth was driven by the demand for consumer electronics for remote working and home entertainment as people were forced to remain indoors during the pandemic.
- The demand for advanced technologies, such as digitalization, robotics, virtual reality, augmented reality, IoT (Internet of Things), and 5G connectivity, is expected to grow during the forecast period. Global electrical and electronics production is expected to register a growth rate of 5.9% in 2027. As a result of technological advancements, the demand for consumer electronics is expected to rise during the forecast period. For instance, the global consumer electronics industry is projected to witness a revenue reach of around USD 904.6 billion in 2027, compared to USD 719.1 billion in 2023. As a result, technological development is projected to lead the demand for electrical and electronic products during the forecast period.
Polyimides (PI) Industry Overview
The Polyimides (PI) Market is fragmented, with the top five companies occupying 32.57%. The major players in this market are DuPont, Kaneka Corporation, PI Advanced Materials Co., Ltd., Toray Industries, Inc. and UBE Corporation (sorted alphabetically).
Additional Benefits:
- The market estimate (ME) sheet in Excel format
- 3 months of analyst support
TABLE OF CONTENTS
1 EXECUTIVE SUMMARY & KEY FINDINGS
2 REPORT OFFERS
3 INTRODUCTION
- 3.1 Study Assumptions & Market Definition
- 3.2 Scope of the Study
- 3.3 Research Methodology
4 KEY INDUSTRY TRENDS
- 4.1 End User Trends
- 4.1.1 Aerospace
- 4.1.2 Automotive
- 4.1.3 Building and Construction
- 4.1.4 Electrical and Electronics
- 4.1.5 Packaging
- 4.2 Regulatory Framework
- 4.2.1 Argentina
- 4.2.2 Australia
- 4.2.3 Brazil
- 4.2.4 Canada
- 4.2.5 China
- 4.2.6 EU
- 4.2.7 India
- 4.2.8 Japan
- 4.2.9 Malaysia
- 4.2.10 Mexico
- 4.2.11 Nigeria
- 4.2.12 Russia
- 4.2.13 Saudi Arabia
- 4.2.14 South Africa
- 4.2.15 South Korea
- 4.2.16 United Arab Emirates
- 4.2.17 United Kingdom
- 4.2.18 United States
- 4.3 Value Chain & Distribution Channel Analysis
5 MARKET SEGMENTATION (includes market size in Value in USD and Volume, Forecasts up to 2029 and analysis of growth prospects)
- 5.1 End User Industry
- 5.1.1 Aerospace
- 5.1.2 Automotive
- 5.1.3 Electrical and Electronics
- 5.1.4 Industrial and Machinery
- 5.1.5 Other End-user Industries
- 5.2 Region
- 5.2.1 Africa
- 5.2.1.1 By Country
- 5.2.1.1.1 Nigeria
- 5.2.1.1.2 South Africa
- 5.2.1.1.3 Rest of Africa
- 5.2.2 Asia-Pacific
- 5.2.2.1 By Country
- 5.2.2.1.1 Australia
- 5.2.2.1.2 China
- 5.2.2.1.3 India
- 5.2.2.1.4 Japan
- 5.2.2.1.5 Malaysia
- 5.2.2.1.6 South Korea
- 5.2.2.1.7 Rest of Asia-Pacific
- 5.2.3 Europe
- 5.2.3.1 By Country
- 5.2.3.1.1 France
- 5.2.3.1.2 Germany
- 5.2.3.1.3 Italy
- 5.2.3.1.4 Russia
- 5.2.3.1.5 United Kingdom
- 5.2.3.1.6 Rest of Europe
- 5.2.4 Middle East
- 5.2.4.1 By Country
- 5.2.4.1.1 Saudi Arabia
- 5.2.4.1.2 United Arab Emirates
- 5.2.4.1.3 Rest of Middle East
- 5.2.5 North America
- 5.2.5.1 By Country
- 5.2.5.1.1 Canada
- 5.2.5.1.2 Mexico
- 5.2.5.1.3 United States
- 5.2.6 South America
- 5.2.6.1 By Country
- 5.2.6.1.1 Argentina
- 5.2.6.1.2 Brazil
- 5.2.6.1.3 Rest of South America
- 5.2.1 Africa
6 COMPETITIVE LANDSCAPE
- 6.1 Key Strategic Moves
- 6.2 Market Share Analysis
- 6.3 Company Landscape
- 6.4 Company Profiles (includes Global Level Overview, Market Level Overview, Core Business Segments, Financials, Headcount, Key Information, Market Rank, Market Share, Products and Services, and Analysis of Recent Developments).
- 6.4.1 China Wanda Group
- 6.4.2 DuPont
- 6.4.3 Jiaozuo Tianyi Technology Co., Ltd.
- 6.4.4 Kaneka Corporation
- 6.4.5 Mitsui Chemicals, Inc.
- 6.4.6 PI Advanced Materials Co., Ltd.
- 6.4.7 SZRH Film Technology Group
- 6.4.8 Taimide Tech. Inc.
- 6.4.9 Toray Industries, Inc.
- 6.4.10 UBE Corporation
7 KEY STRATEGIC QUESTIONS FOR ENGINEERING PLASTICS CEOS
8 APPENDIX
- 8.1 Global Overview
- 8.1.1 Overview
- 8.1.2 Porter's Five Forces Framework (Industry Attractiveness Analysis)
- 8.1.3 Global Value Chain Analysis
- 8.1.4 Market Dynamics (DROs)
- 8.2 Sources & References
- 8.3 List of Tables & Figures
- 8.4 Primary Insights
- 8.5 Data Pack
- 8.6 Glossary of Terms
02-2729-4219
+886-2-2729-4219
 热塑性聚酰亚胺市场规模、份额和趋势分析报告:按产品、应用、地区和细分市场预测(2025-2033 年)
 聚酰亚胺清漆市场规模、份额及成长分析(按类型、终端用户产业、应用及地区划分)-产业预测,2025-2032年
 聚酰亚胺清漆:全球市占率及排名、总收入及需求预测(2025-2031年)聚酰亚胺(PI)-全球市占率及排名、总收入及需求预测(2025-2031年)光敏聚酰亚胺(PSPI):全球市场份额和排名、总销售额和需求预测(2025-2031 年)
 2032 年聚酰亚胺市场预测:按类型、应用、最终用户和地区分類的全球分析聚酰亚胺市场规模、份额、趋势分析报告:按类型、应用、地区、细分市场预测,2025-2030年
 聚酰亚胺市场 - 全球产业规模、份额、趋势、机会和预测,按最终用户(航太、汽车、建筑和施工、电气和电子、包装、其他)细分,按地区和竞争,2020 年至 2035 年预测
 聚酰亚胺凡立水的全球市场:依类型、最终用户产业和地区(~2032年)
 全球聚酰亚胺树脂市场(2016-2036)
▼