


 |
市场调查报告书
商品编码
1686538
亚太地区作物保护化学品:市场占有率分析、产业趋势与统计、成长预测(2025-2030 年)Asia Pacific Crop Protection Chemicals - Market Share Analysis, Industry Trends & Statistics, Growth Forecasts (2025 - 2030) |
||||||
价格
※ 本网页内容可能与最新版本有所差异。详细情况请与我们联繫。
简介目录
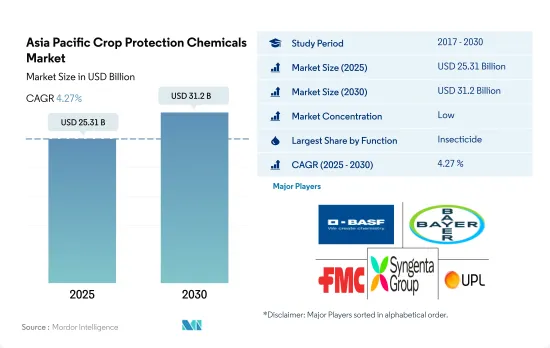
亚太地区作物保护化学品市场规模预计在 2025 年为 253.1 亿美元,预计到 2030 年将达到 312 亿美元,预测期内(2025-2030 年)的复合年增长率为 4.27%。
由于害虫和杂草侵袭不断增加,杀虫剂和除草剂占据亚太市场主导地位
- 亚太地区农业种类繁多,在许多国家的经济中发挥着至关重要的作用。该地区气候类型多样,从热带到温带,以种植水稻、大豆、小麦以及各种水果和蔬菜而闻名。 2022 年,亚太地区占全球作物保护化学品市场以金额为准的 24.7%。
- 由于该地区人口不断增长,对作物的需求不断增加,因此鼓励使用作物保护化学物质来获得更好的产量。同时,技术进步正在改变农业生产方式,新的病虫害防治技术为作物和农民带来巨大的利益。
- 杀虫剂在亚太作物保护化学品市场占有最高份额,为50.8%。水稻是许多地区的主要作物。然而,它易受多种害虫的侵害,从而对作物造成严重损害,并最终影响其产量。
- 2022 年,除草剂以以金额为准占据第二大份额,为 28.5%。杂草对作物、作物和园艺作物的破坏对该地区的农业生产力构成了重大挑战。水果产业对该地区经济成长贡献巨大,因此果树杂草会造成严重的经济损失。反枝苋(红苋菜)和稗草(稗草)是当地果树业中最常见的杂草。
- 人们对粮食安全和各种市场机会的日益关注,促使农民有效率且永续生产粮食,同时尽量减少害虫对作物的影响。这将推动市场的发展,预计预测期内(2023-2029 年)的复合年增长率将达到 4.5%。
由于用于保护作物免受害虫、疾病和杂草侵害的作物保护化学品的消费量不断增加,市场正在成长。
- 2022 年,以以金额为准计算,亚太地区在全球杀虫剂市场占有 24.7% 的市场占有率。该地区的农药产业极为重要且正在不断发展。它在促进多个国家的高效、永续农业实践方面发挥关键作用。过去一段时间,亚太地区杀虫剂市场持续成长,复合年增长率为 5.5%。
- 包括中国和印度在内的亚太国家由于农业景观多样化,且作物易受病虫害侵害,因此作物保护化学品的使用量正在增加。作物集约化种植、单一栽培的盛行也为病虫害的蔓延创造了有利条件。随着粮食安全成为维持大量人口生存的首要任务,人们越来越需要保护作物产量并儘量减少因病虫害造成的损失,从而增加了对作物保护化学品的依赖。
- 此外,透过采用现代技术和扩大耕地面积来扩大农业也促进了市场的成长。该地区的农业用地面积预计将从2019年的6.245亿公顷扩大到2022年的6.622亿公顷。随着农业活动的扩大,对保护作物免受病虫害的有效解决方案的需求也在增加。
- 预计在预测期(2023-2029 年),泰国的以金额为准年增长率为 6.8%,是该地区成长率最快的国家。这一激增的原因是,由于病虫害威胁日益严重以及作物损失不断增加,该国农民预计将增加作物保护化学品的使用。
亚太作物保护化学品市场趋势
害虫增多导致作物保护化学物质的使用增加
- 2022年亚太地区作物保护化学品的平均消费量为每公顷农地2.9公斤。杀菌剂是最常用的化学作物保护化学品,平均消费量达每公顷 10.6 公斤。这显示真菌病原体对农业生产构成重大威胁,因此对杀菌剂的需求日益增加。稻瘟病的病原体已经对 MBI-D 杀菌剂产生了抗药性,增加了对杀菌剂喷洒的需求。
- 继杀菌剂之后的是除草剂,2022 年的施用量将达到每公顷 10.4 公斤。每公顷除草剂使用量的增加是由于多种因素造成的,包括农业人口老化、劳动力短缺和农地扩张。这些因素促使人们从手工除草转向使用除草剂来有效地管理水稻和大豆等重要作物的杂草。此外,杂草对现有除草剂的抵抗力越来越强,使其更难以控制,从而导致除草剂的使用量增加。
- 杀虫剂将成为亚太国家第三大广泛使用的作物保护化学品,2022 年施用量将达到每公顷 8 公斤。全球暖化和气候变迁也透过各种机制增加害虫数量,对农业生产构成各种挑战。例如,人们观察到,随着气温升高,水稻的主要害虫小褐飞蝨(Nilaparvata lugens)在亚洲部分地区的数量增加,分布范围也扩大了。同样,随着农民对杀线虫剂和杀软体动物剂益处的认识不断提高和需求不断增加,其使用也在增加。
Cypermethrin的供应有限和需求导致亚太市场上活性成分的价格上涨。
- Cypermethrin是一种合成拟除虫菊酯杀虫剂,主要用于该地区,可有效防治多种害虫,包括鳞翅目、鞘翅目、双翅目和半翅目。在印度、中国和越南等国家,Cypermethrin主要用于防治各种作物的害虫。其中,中国和越南是Cypermethrin的主要进口国。截至 2022 年,该活性成分的价格已上涨至每吨 21,037.7 美元,自 2017 年以来显着上涨了 21.1%。此次价格上涨是由于甘蔗、棉花、水果和蔬菜等作物对Cypermethrin的需求增加。
- Atrazine是该地区重要且广泛使用的除草剂,被归类为三嗪类氯除草剂。Atrazine用作出苗前和出苗后除草剂,可有效控制大豆、玉米、甘蔗、草坪等作物中的一年生阔叶杂草和禾本科杂草。由于该活性成分广泛应用于多种作物,其价格一直呈现与前一年同期比较成长的趋势。 2022 年的最新价格为每吨 13,817.2 美元,较 2017 年大幅上涨 29.8%。
- 代森锰锌是一种接触性杀菌剂,以其多功能的应用形式而闻名,可有效针对谷物、水果、蔬菜和豆类中的多种真菌疾病。该活性成分目前的价格为每吨 7,776.9 美元,是亚太国家广泛使用的领先杀菌剂活性成分之一。
- 由于原料成本、进口关税和物流成本的上涨,活性成分的价格逐年上涨。
亚太地区作物保护化学品产业概况
亚太地区作物保护化学品市场较为分散,前五大公司占了33.97%的市场。该市场的主要企业是:BASF公司、拜耳公司、FMC 公司、先正达集团和 UPL 有限公司(按字母顺序排列)。
其他福利
- Excel 格式的市场预测 (ME) 表
- 3 个月的分析师支持
目录
第 1 章执行摘要和主要发现
第二章 报告要约
第 3 章 简介
- 研究假设和市场定义
- 研究范围
- 调查方法
第四章 产业主要趋势
- 每公顷作物保护化学品消费量
- 有效成分价格分析
- 法律规范
- 澳洲
- 中国
- 印度
- 印尼
- 日本
- 缅甸
- 巴基斯坦
- 菲律宾
- 泰国
- 越南
- 价值链与通路分析
第五章 市场区隔
- 功能
- 杀菌剂
- 除草剂
- 杀虫剂
- 灭螺剂
- 杀线虫剂
- 使用模式
- 化学喷涂
- 叶面喷布
- 熏蒸
- 种子处理
- 土壤处理
- 作物类型
- 经济作物
- 水果和蔬菜
- 粮食
- 豆类和油籽
- 草坪和观赏植物
- 国家
- 澳洲
- 中国
- 印度
- 印尼
- 日本
- 缅甸
- 巴基斯坦
- 菲律宾
- 泰国
- 越南
- 其他亚太地区
第六章 竞争格局
- 主要策略趋势
- 市场占有率分析
- 业务状况
- 公司简介
- ADAMA Agricultural Solutions Ltd
- BASF SE
- Bayer AG
- Corteva Agriscience
- FMC Corporation
- Jiangsu Yangnong Chemical Co. Ltd
- Rainbow Agro
- Sumitomo Chemical Co. Ltd
- Syngenta Group
- UPL Limited
第七章:执行长的关键策略问题
第 8 章 附录
- 世界概况
- 概述
- 五力分析框架
- 全球价值链分析
- 市场动态(DRO)
- 资讯来源和进一步阅读
- 图片列表
- 关键见解
- 资料包
- 词彙表
简介目录
Product Code: 52421
The Asia Pacific Crop Protection Chemicals Market size is estimated at 25.31 billion USD in 2025, and is expected to reach 31.2 billion USD by 2030, growing at a CAGR of 4.27% during the forecast period (2025-2030).
Dominance of insecticides and herbicides in the Asia-Pacific market due to a rise in pest and weed attacks
- Agriculture in Asia-Pacific is diverse and plays a significant role in the economies of many countries. The region has a wide range of climates, from tropical to temperate, and is known for the cultivation of rice, soybeans, wheat, and various fruits and vegetables. In 2022, Asia-Pacific occupied a share of 24.7% by value of the global crop protection chemicals market.
- The use of pesticides in order to achieve better yields is encouraged by the increasing demand for food crops due to population growth in the region. At the same time, technological advancements have changed the way farming is done, and new technologies in pest control are benefiting crops and farmers a great deal.
- Insecticides occupied the highest share of 50.8% in the Asia-Pacific crop protection chemicals market. Rice is the major crop cultivated across many regional countries. However, it is also susceptible to various pests, which have led to severe damage to the crop and, subsequently, its yield.
- Herbicides occupied the second-largest share of 28.5% by value in 2022. Weed attacks in staple, commercial, and horticultural crops pose a significant challenge to the region's agricultural productivity. As there is a significant contribution by the fruit industry to the region's economic growth, fruit weeds cause substantial economic damage. Amaranthus retroflexus (Redroot pigweed) and Echinochloa crus-galli (Barnyard grass) are the most common weeds in the regional fruit industry.
- Increased concerns for food security and various market developments have facilitated the efficient and sustainable production of food by farmers while minimizing the impact of pests on their crops. This has driven the market, which is anticipated to register a CAGR of 4.5% during the forecast period (2023-2029).
The market is growing due to the rising consumption of pesticides to protect crops from pests, diseases, and weeds
- In 2022, Asia-Pacific held a market share of 24.7% by value of the global insecticide market. The pesticide segment in the region is of great importance and is constantly evolving. It plays a vital role in promoting productive and sustainable agricultural practices in multiple countries. During the historical period, the pesticide market in Asia-Pacific experienced consistent growth, with a CAGR of 5.5%.
- Asia-Pacific countries like China and India, along with other countries, experience increased pesticide usage due to their varied agricultural landscape, making some crops more vulnerable to pests and diseases. The prevalence of intensive cropping practices and monocultures also contributes to the favorable conditions for pests to thrive. With substantial populations to sustain, ensuring food security becomes a top priority, leading to a heightened need to protect crop yields and minimize losses caused by pests, thus resulting in a greater reliance on pesticides.
- The market is also experiencing growth due to the expansion of agriculture, with the adoption of modern practices and the expansion of cultivated land. The region's agricultural land area grew from 624.5 million ha in 2019 to 662.2 million ha in 2022. As agricultural activities expand, the demand for efficient solutions to protect crops from pests is also growing.
- During the forecast period (2023-2029), Thailand is projected to exhibit the fastest growth rate in the region, with a CAGR of 6.8% by value. This rapid growth can be attributed to the anticipated increase in the usage of pesticides by farmers in the country due to the rising threat of pests and increasing crop losses.
Asia Pacific Crop Protection Chemicals Market Trends
Increasing pest proliferation is leading to higher application of pesticides
- The average consumption of crop protection chemicals in Asia-Pacific was 2.9 kg per hectare of agricultural land in 2022. Fungicides were the highest used among all chemical pesticides, with average consumption amounting to 10.6 kg per hectare. This indicates the significant threat posed on agricultural production by fungal pathogens, resulting in a higher need for fungicides. Fungus-causing rice blast in paddy has developed resistance to MBI-D fungicides, leading to a higher need for fungicidal applications.
- Fungicides are followed by herbicides, with a per hectare application rate of 10.4 kg per hectare in 2022. The increase in herbicide usage per hectare can be attributed to various factors, including an aging farming population, labor shortages, and the expansion of agricultural land. These factors have prompted a transition from manual weeding practices to the utilization of herbicides for effective weed management in significant crops like rice and soybeans. Weeds are also becoming very tough to manage as they are developing resistance to existing herbicides, leading to higher dosages of application.
- Insecticides are the third most applied among pesticides in Asia-Pacific countries, with a per hectare application rate of 8 kg in the year 2022. Global warming and climate change are posing various challenges to agricultural production, even by increasing the pest population through various mechanisms. For instance, the brown planthopper (Nilaparvata lugens), a major pest of rice, has been observed to increase in population and expand its distribution in response to rising temperatures in parts of Asia. Similarly, the usage of nematicides and molluscicides has been increasing amid growing awareness among farmers of their benefits, along with the increasing need.
Limited availability and demand for cypermethrin have increased the price of active ingredients in the Asia-Pacific market
- Cypermethrin is the dominant insecticide used in the region, being a synthetic pyrethroid effective against a wide range of insect pests such as Lepidoptera, Coleoptera, Diptera, and Hemiptera. Countries like India, China, and Vietnam primarily rely on cypermethrin for pest control in various crops. Notably, China and Vietnam are the major importers of cypermethrin. As of 2022, the price of the active ingredient had risen to USD 21,037.7 per metric ton, reflecting a notable increase of 21.1% since 2017. This surge in price can be attributed to the growing demand for cypermethrin in crops like sugarcane, cotton, fruits, and vegetables.
- Atrazine holds a prominent position as a widely utilized herbicide in the region, classified as a chlorinated herbicide of the triazine class. It serves as both a pre- and post-emergence herbicide, effectively controlling annual broadleaf weeds and grasses in crops like soybeans, maize, sugarcane, and turf grasses. The active ingredient's price has experienced consistent year-on-year growth due to its extensive application across various crops. As of the latest recording in 2022, the price stood at USD 13,817.2 per metric ton, marking a significant increase of 29.8% since 2017.
- Mancozeb is a contact fungicide known for its versatile application modes, effectively targeting a wide array of fungal diseases in cereal crops, fruits, vegetables, and pulses. The price of the active ingredient currently stands at USD 7,776.9 per metric ton, making it one of the principal fungicide active ingredients extensively utilized in the Asia-Pacific countries.
- The prices of active ingredients are experiencing annual increases due to the rise in raw material costs, import tariffs, and escalating logistics expenses.
Asia Pacific Crop Protection Chemicals Industry Overview
The Asia Pacific Crop Protection Chemicals Market is fragmented, with the top five companies occupying 33.97%. The major players in this market are BASF SE, Bayer AG, FMC Corporation, Syngenta Group and UPL Limited (sorted alphabetically).
Additional Benefits:
- The market estimate (ME) sheet in Excel format
- 3 months of analyst support
TABLE OF CONTENTS
1 EXECUTIVE SUMMARY & KEY FINDINGS
2 REPORT OFFERS
3 INTRODUCTION
- 3.1 Study Assumptions & Market Definition
- 3.2 Scope of the Study
- 3.3 Research Methodology
4 KEY INDUSTRY TRENDS
- 4.1 Consumption Of Pesticide Per Hectare
- 4.2 Pricing Analysis For Active Ingredients
- 4.3 Regulatory Framework
- 4.3.1 Australia
- 4.3.2 China
- 4.3.3 India
- 4.3.4 Indonesia
- 4.3.5 Japan
- 4.3.6 Myanmar
- 4.3.7 Pakistan
- 4.3.8 Philippines
- 4.3.9 Thailand
- 4.3.10 Vietnam
- 4.4 Value Chain & Distribution Channel Analysis
5 MARKET SEGMENTATION (includes market size in Value in USD and Volume, Forecasts up to 2030 and analysis of growth prospects)
- 5.1 Function
- 5.1.1 Fungicide
- 5.1.2 Herbicide
- 5.1.3 Insecticide
- 5.1.4 Molluscicide
- 5.1.5 Nematicide
- 5.2 Application Mode
- 5.2.1 Chemigation
- 5.2.2 Foliar
- 5.2.3 Fumigation
- 5.2.4 Seed Treatment
- 5.2.5 Soil Treatment
- 5.3 Crop Type
- 5.3.1 Commercial Crops
- 5.3.2 Fruits & Vegetables
- 5.3.3 Grains & Cereals
- 5.3.4 Pulses & Oilseeds
- 5.3.5 Turf & Ornamental
- 5.4 Country
- 5.4.1 Australia
- 5.4.2 China
- 5.4.3 India
- 5.4.4 Indonesia
- 5.4.5 Japan
- 5.4.6 Myanmar
- 5.4.7 Pakistan
- 5.4.8 Philippines
- 5.4.9 Thailand
- 5.4.10 Vietnam
- 5.4.11 Rest of Asia-Pacific
6 COMPETITIVE LANDSCAPE
- 6.1 Key Strategic Moves
- 6.2 Market Share Analysis
- 6.3 Company Landscape
- 6.4 Company Profiles (includes Global level Overview, Market level overview, Core Business Segments, Financials, Headcount, Key Information, Market Rank, Market Share, Products and Services, and analysis of Recent Developments)
- 6.4.1 ADAMA Agricultural Solutions Ltd
- 6.4.2 BASF SE
- 6.4.3 Bayer AG
- 6.4.4 Corteva Agriscience
- 6.4.5 FMC Corporation
- 6.4.6 Jiangsu Yangnong Chemical Co. Ltd
- 6.4.7 Rainbow Agro
- 6.4.8 Sumitomo Chemical Co. Ltd
- 6.4.9 Syngenta Group
- 6.4.10 UPL Limited
7 KEY STRATEGIC QUESTIONS FOR CROP PROTECTION CHEMICALS CEOS
8 APPENDIX
- 8.1 Global Overview
- 8.1.1 Overview
- 8.1.2 Porter's Five Forces Framework
- 8.1.3 Global Value Chain Analysis
- 8.1.4 Market Dynamics (DROs)
- 8.2 Sources & References
- 8.3 List of Tables & Figures
- 8.4 Primary Insights
- 8.5 Data Pack
- 8.6 Glossary of Terms
02-2729-4219
+886-2-2729-4219
 越南农作物保护化学品:市场占有率分析、产业趋势与统计、成长预测(2026-2031)非洲作物保护化学品:市场占有率分析、产业趋势与统计、成长预测(2026-2031 年)
 全球作物保护化学品市场规模、份额、趋势和成长分析报告(2026-2034年)
 2026年全球作物保护化学品市场报告
 作物保护化学品市场-全球产业规模、份额、趋势、机会、预测:按类型、原料、应用方法、地区和竞争格局划分,2021-2031年
 农药暴露防护市场依产品、材料、技术、最终用途产业及通路划分,全球预测(2026-2032)化肥和农药市场按产品类型、作物类型、配方、原料、作用方式、施用方法、最终用户和分销管道划分-全球预测(2026-2032 年)呋虫胺技术市场按作物类型、製剂、应用、最终用途产业和分销管道划分,全球预测,2026-2032年烯效唑技术市场依作物类型、形态、应用和分销管道划分,全球预测(2026-2032年)作物保护化学品:市场占有率分析、产业趋势与统计、成长预测(2026-2031 年)
▼