


 |
市场调查报告书
商品编码
1686613
聚醚醚酮(PEEK):市场占有率分析、产业趋势和成长预测(2024-2029)Polyether Ether Ketone (PEEK) - Market Share Analysis, Industry Trends & Statistics, Growth Forecasts (2024 - 2029) |
||||||
价格
※ 本网页内容可能与最新版本有所差异。详细情况请与我们联繫。
简介目录
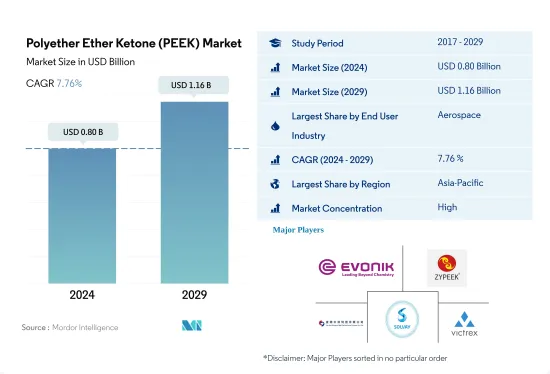
聚醚醚酮 (PEEK) 市场规模预计在 2024 年为 8 亿美元,预计到 2029 年将达到 11.6 亿美元,预测期内(2024-2029 年)的复合年增长率为 7.76%。
电子产业技术创新步伐加快,推动对 PEEK 的需求
- 聚醚醚酮 (PEEK) 因其多种特性(包括抗蠕变性、耐化学性、抗衝击性和耐磨性)而广泛应用于电子、航太和工业机械产业。 2022年全球PEEK市场预计将与前一年同期比较增14.2%。
- 以以金额为准计算,2022 年 PEEK 树脂的最大消费者将是航太工业,这得益于对高性能航太零件的需求不断增长。例如,航太零件生产收入预计在2022年达到约4,670亿美元,较2021年成长8.55%。预计欧洲在2022年对PEEK的需求最高,预计在以金额为准期(2023-2029年)的复合年增长率为7.69%。随着俄乌战争持续发酵,包括德国、法国在内的多个欧洲国家正在加强航太防御。这因素加上 PEEK消费量的增加,增加了军用喷射机和飞机所使用的航太零件的需求。
- 电气和电子市场是 PEEK 成长最快的终端用户市场,预计在预测期(2023-2029 年)的复合年增长率以金额为准9.01%。由于人工智慧和物联网等新兴趋势,预计未来对电子设备的需求将会增加,导致对 PEEK 的需求激增。预计到 2024 年,全球家电市场规模将成长 1.5%。 2022 年,亚太地区占据了最大的市场占有率。预计该地区在预测期内的复合年增长率将达到 8.52%,成为以金额为准成长第二快的地区。
亚太地区将主导PEEK消费
- PEEK 热塑性塑胶用于电线涂层、型材挤压以及生产薄膜、管道、片材和单丝等零件和设备。以收益为准, 2022 年 PEEK 树脂的需求与 2021 年相比增长了 14.21%。亚太地区和欧洲是全球PEEK的主要消费地区。
- 亚太地区是 PEEK 树脂的最大消费地区,预计预测期内复合年增长率为 8.52%,成为以金额为准成长第二快的地区。中国和日本等国家在 PEEK 的使用上处于领先地位,以收益为准,分别占 PEEK 总市场的 59.85% 和 16.82%。这一份额是由中国汽车业推动的,在全球半导体短缺的情况下,政府降低了汽车购置税,导致中国汽车需求激增。 2022年中国汽车产量将达4,600万辆,而前一年为4,400万辆。中国也是成长最快的国家,预计 2023 年至 2029 年期间的以金额为准将达到 8.78%。
- 预计非洲将成为成长最快的地区,预测期内(2023-2029 年)的以金额为准年增长率为 9.64%。南非和奈及利亚分别占该地区 PEEK 总收益的 49.65% 和 8.48%。南非电子产业对家用电子电器的需求正在激增,预测期内其以金额为准年增长率可能达到 10.63%,这可能成为 PEEK 市场的成长要素。
全球聚醚醚酮(PEEK)市场趋势
电子产业的技术进步可能推动成长
- 电子产品技术创新的快速步伐推动着对更新、更快的电气和电子产品的持续需求。 2022年,全球电气及电子产品销售额预计达到5.807兆美元,其中亚太地区占74%的市场占有率,其次是欧洲,占13%的市场份额。预计预测期内全球电气和电子设备市场复合年增长率将达到 6.61%。
- 2018年,亚太地区经济成长强劲,受中国、韩国、日本、印度和东南亚国协快速工业化的推动。 2020年,受疫情影响,晶片短缺、供应链效率低等因素导致全球电子电气生产放缓,营收与前一年同期比较增仅0.1%。由于疫情期间人们被迫待在室内,对远距工作和家庭娱乐消费性电子产品的需求推动了这一成长。
- 预测期内,对数位化、机器人、虚拟实境、扩增实境、物联网 (IoT) 和 5G 连接等先进技术的需求预计将成长。预计 2027 年全球电气和电子设备产量将成长 5.9%。由于技术进步,预测期内对消费性电子产品的需求预计将上升。例如,预计2027年全球消费性电子产业收益将达到约9,046亿美元,而2023年将达到7,191亿美元。因此,预计技术发展将在预测期内引领对电气和电子产品的需求。
聚醚醚酮(PEEK)产业概览
聚醚醚酮(PEEK)市场相当集中,前五大公司占据了80.77%的市场。市场的主要企业有:赢创工业股份公司、吉林省联合聚合物、盘锦中润高性能聚合物、索尔维和威格斯(按字母顺序排列)。
其他福利
- Excel 格式的市场预测 (ME) 表
- 3个月的分析师支持
目录
第一章执行摘要和主要发现
第二章 报告要约
第三章 引言
- 研究假设和市场定义
- 研究范围
- 调查方法
第四章 产业主要趋势
- 最终用户趋势
- 航太
- 车
- 建筑与施工
- 电气和电子
- 包装
- 法律规范
- 阿根廷
- 澳洲
- 巴西
- 加拿大
- 中国
- EU
- 印度
- 日本
- 马来西亚
- 墨西哥
- 奈及利亚
- 俄罗斯
- 沙乌地阿拉伯
- 南非
- 韩国
- 阿拉伯聯合大公国
- 英国
- 美国
- 价值炼和通路分析
第五章市场区隔
- 最终用户产业
- 航太
- 车
- 电气和电子
- 工业/机械
- 其他最终用户产业
- 地区
- 非洲
- 按国家
- 奈及利亚
- 南非
- 其他非洲国家
- 亚太地区
- 按国家
- 澳洲
- 中国
- 印度
- 日本
- 马来西亚
- 韩国
- 其他亚太地区
- 欧洲
- 按国家
- 法国
- 德国
- 义大利
- 俄罗斯
- 英国
- 其他欧洲国家
- 中东
- 按国家
- 沙乌地阿拉伯
- 阿拉伯聯合大公国
- 其他中东地区
- 北美洲
- 按国家
- 加拿大
- 墨西哥
- 美国
- 南美洲
- 按国家
- 阿根廷
- 巴西
- 南美洲其他地区
- 非洲
第六章 竞争格局
- 关键策略趋势
- 市场占有率分析
- 商业状况
- 公司简介.
- BARLOG Plastics GmbH
- Evonik Industries AG
- Jilin Joinature Polymer Co., Ltd.
- Pan Jin Zhongrun High Performance Polymer Co.,Ltd
- Polyplastics-Evonik Corporation
- Shandong Haoran Special Plastic Co., Ltd.
- Solvay
- Victrex
- Zhejiang Pengfulong Technology Co., Ltd.
- Zibo Bainaisi Chemical Co.,Ltd
第七章:CEO面临的关键策略问题
第 8 章 附录
- 世界概况
- 概述
- 五力分析框架(产业吸引力分析)
- 全球价值链分析
- 市场动态(DRO)
- 资讯来源及延伸阅读
- 图片列表
- 关键见解
- 资料包
- 词彙表
简介目录
Product Code: 53220
The Polyether Ether Ketone (PEEK) Market size is estimated at 0.80 billion USD in 2024, and is expected to reach 1.16 billion USD by 2029, growing at a CAGR of 7.76% during the forecast period (2024-2029).
Rapid pace of technological innovation in electronics industry to boost demand for PEEK
- Polyether ether ketone (PEEK) exhibits versatile properties like resistance to creep, chemicals, impact, and abrasion, due to which it is used widely in the electronics, aerospace, and industrial and mechanical equipment industries. The global PEEK market grew by 14.2% in terms of revenue in 2022 compared to the previous year.
- The aerospace industry was the largest consumer of PEEK resins in 2022 in terms of value, which can be attributed to an increase in the demand for high-performance aerospace components. For instance, aerospace component production revenue reached around USD 467 billion in 2022, 8.55% higher than in 2021. Europe recorded the highest demand for PEEK in 2022, and it is expected to record a CAGR of 7.69% in terms of value during the forecast period (2023-2029). Amid the Russia-Ukraine war, several countries in Europe, like Germany and France, have been ramping up their aerospace defense. This factor increased the demand for aerospace components to be used in military jets and planes, along with an increase in the consumption of PEEK.
- The electrical and electronics market is the fastest-growing end-user market for PEEK, and it is expected to witness a CAGR of 9.01% in value during the forecast period (2023-2029). Owing to emerging trends like artificial intelligence and the Internet of Things, the demand for electronic devices is predicted to increase in the future, bringing a surge in demand for PEEK. The global consumer electronics market is expected to show a volume growth of 1.5% by 2024. Asia-Pacific occupied the largest market share by volume in 2022. The region is expected to register a CAGR of 8.52% in terms of value during the forecast period, making it the second fastest-growing region.
Asia-Pacific to dominate PEEK consumption
- PEEK thermoplastics are used in the production of parts and equipment, including wire coating, profile extrusion, film, pipe, sheet, and monofilament. The demand for PEEK resin recorded a growth of 14.21% in terms of revenue in 2022 compared to 2021. Asia-Pacific and Europe are among the major consumers of PEEK globally.
- Asia-Pacific is the largest consumer of PEEK resins, and it is expected to register a CAGR of 8.52% in terms of value during the forecast period, making it the second-fastest-growing sector as well. Countries like China and Japan are at the forefront of the utilization of PEEK, occupying 59.85% and 16.82%, respectively, of the total PEEK market share in terms of revenue. This share can be attributed to China's automotive industry, which is experiencing a surge in demand for vehicles primarily due to the government reducing taxes on vehicle purchases amid a global semiconductor shortage. Vehicle production in China was recorded at 46 million units in 2022 compared to 44 million units in the previous year. China is also the fastest-growing country, and it is likely to experience a CAGR of 8.78% in terms of value from 2023 to 2029.
- Africa is the fastest-growing region, and it is likely to register a CAGR of 9.64% in terms of value during the forecast period (2023-2029). South Africa and Nigeria accounted for 49.65% and 8.48%, respectively, of the overall PEEK revenue generated by the region. South Africa's electronics industry experienced a surge in demand for consumer electronics, and it is likely to witness a CAGR of 10.63% by value during the forecast period, which may serve as a growth factor for the PEEK market.
Global Polyether Ether Ketone (PEEK) Market Trends
Technological advancements in electronics industry may foster the growth
- The rapid pace of technological innovation in electronic products is driving the consistent demand for new and fast electrical and electronic products. In 2022, the global revenue of electrical and electronics stood at USD 5,807 billion, with Asia-Pacific holding a 74% market share, followed by Europe with a 13% share. The global electrical and electronics market is expected to record a CAGR of 6.61% during the forecast period.
- In 2018, the Asia-Pacific region witnessed strong economic growth owing to rapid industrialization in China, South Korea, Japan, India, and ASEAN countries. In 2020, due to the pandemic, there was a slowdown in global electrical and electronics production due to the shortage of chips and inefficiencies in the supply chain, which led to a stagnant growth rate of 0.1% in revenue compared to the previous year. This growth was driven by the demand for consumer electronics for remote working and home entertainment as people were forced to remain indoors during the pandemic.
- The demand for advanced technologies, such as digitalization, robotics, virtual reality, augmented reality, IoT (Internet of Things), and 5G connectivity, is expected to grow during the forecast period. Global electrical and electronics production is expected to register a growth rate of 5.9% in 2027. As a result of technological advancements, the demand for consumer electronics is expected to rise during the forecast period. For instance, the global consumer electronics industry is projected to witness a revenue reach of around USD 904.6 billion in 2027, compared to USD 719.1 billion in 2023. As a result, technological development is projected to lead the demand for electrical and electronic products during the forecast period.
Polyether Ether Ketone (PEEK) Industry Overview
The Polyether Ether Ketone (PEEK) Market is fairly consolidated, with the top five companies occupying 80.77%. The major players in this market are Evonik Industries AG, Jilin Joinature Polymer Co., Ltd., Pan Jin Zhongrun High Performance Polymer Co.,Ltd, Solvay and Victrex (sorted alphabetically).
Additional Benefits:
- The market estimate (ME) sheet in Excel format
- 3 months of analyst support
TABLE OF CONTENTS
1 EXECUTIVE SUMMARY & KEY FINDINGS
2 REPORT OFFERS
3 INTRODUCTION
- 3.1 Study Assumptions & Market Definition
- 3.2 Scope of the Study
- 3.3 Research Methodology
4 KEY INDUSTRY TRENDS
- 4.1 End User Trends
- 4.1.1 Aerospace
- 4.1.2 Automotive
- 4.1.3 Building and Construction
- 4.1.4 Electrical and Electronics
- 4.1.5 Packaging
- 4.2 Regulatory Framework
- 4.2.1 Argentina
- 4.2.2 Australia
- 4.2.3 Brazil
- 4.2.4 Canada
- 4.2.5 China
- 4.2.6 EU
- 4.2.7 India
- 4.2.8 Japan
- 4.2.9 Malaysia
- 4.2.10 Mexico
- 4.2.11 Nigeria
- 4.2.12 Russia
- 4.2.13 Saudi Arabia
- 4.2.14 South Africa
- 4.2.15 South Korea
- 4.2.16 United Arab Emirates
- 4.2.17 United Kingdom
- 4.2.18 United States
- 4.3 Value Chain & Distribution Channel Analysis
5 MARKET SEGMENTATION (includes market size in Value in USD and Volume, Forecasts up to 2029 and analysis of growth prospects)
- 5.1 End User Industry
- 5.1.1 Aerospace
- 5.1.2 Automotive
- 5.1.3 Electrical and Electronics
- 5.1.4 Industrial and Machinery
- 5.1.5 Other End-user Industries
- 5.2 Region
- 5.2.1 Africa
- 5.2.1.1 By Country
- 5.2.1.1.1 Nigeria
- 5.2.1.1.2 South Africa
- 5.2.1.1.3 Rest of Africa
- 5.2.2 Asia-Pacific
- 5.2.2.1 By Country
- 5.2.2.1.1 Australia
- 5.2.2.1.2 China
- 5.2.2.1.3 India
- 5.2.2.1.4 Japan
- 5.2.2.1.5 Malaysia
- 5.2.2.1.6 South Korea
- 5.2.2.1.7 Rest of Asia-Pacific
- 5.2.3 Europe
- 5.2.3.1 By Country
- 5.2.3.1.1 France
- 5.2.3.1.2 Germany
- 5.2.3.1.3 Italy
- 5.2.3.1.4 Russia
- 5.2.3.1.5 United Kingdom
- 5.2.3.1.6 Rest of Europe
- 5.2.4 Middle East
- 5.2.4.1 By Country
- 5.2.4.1.1 Saudi Arabia
- 5.2.4.1.2 United Arab Emirates
- 5.2.4.1.3 Rest of Middle East
- 5.2.5 North America
- 5.2.5.1 By Country
- 5.2.5.1.1 Canada
- 5.2.5.1.2 Mexico
- 5.2.5.1.3 United States
- 5.2.6 South America
- 5.2.6.1 By Country
- 5.2.6.1.1 Argentina
- 5.2.6.1.2 Brazil
- 5.2.6.1.3 Rest of South America
- 5.2.1 Africa
6 COMPETITIVE LANDSCAPE
- 6.1 Key Strategic Moves
- 6.2 Market Share Analysis
- 6.3 Company Landscape
- 6.4 Company Profiles (includes Global Level Overview, Market Level Overview, Core Business Segments, Financials, Headcount, Key Information, Market Rank, Market Share, Products and Services, and Analysis of Recent Developments).
- 6.4.1 BARLOG Plastics GmbH
- 6.4.2 Evonik Industries AG
- 6.4.3 Jilin Joinature Polymer Co., Ltd.
- 6.4.4 Pan Jin Zhongrun High Performance Polymer Co.,Ltd
- 6.4.5 Polyplastics-Evonik Corporation
- 6.4.6 Shandong Haoran Special Plastic Co., Ltd.
- 6.4.7 Solvay
- 6.4.8 Victrex
- 6.4.9 Zhejiang Pengfulong Technology Co., Ltd.
- 6.4.10 Zibo Bainaisi Chemical Co.,Ltd
7 KEY STRATEGIC QUESTIONS FOR ENGINEERING PLASTICS CEOS
8 APPENDIX
- 8.1 Global Overview
- 8.1.1 Overview
- 8.1.2 Porter's Five Forces Framework (Industry Attractiveness Analysis)
- 8.1.3 Global Value Chain Analysis
- 8.1.4 Market Dynamics (DROs)
- 8.2 Sources & References
- 8.3 List of Tables & Figures
- 8.4 Primary Insights
- 8.5 Data Pack
- 8.6 Glossary of Terms
02-2729-4219
+886-2-2729-4219
 聚醚醚酮(PEEK)市场规模、份额及成长分析(按类型、应用、最终用途和地区划分)-2026-2033年产业预测
 聚醚醚酮(PEEK)-全球市场份额和排名、总收入和需求预测(2025-2031年)
 聚醚酮酮(PEKK)长丝市场规模、份额和趋势分析报告:按产品、应用、地区和细分市场预测(2025-2033 年)
 聚醚醚酮 (PEEK) 和 PAEK 树脂市场按产品类型、填料类型、产品形态、最终用途和分销管道划分 - 全球预测 2025-2032 年
 2025年聚醚醚酮(PEEK)植入全球市场报告
 PEEK植入的全球市场聚醚醚酮的全球市场
 聚醚醚酮(PEEK)的供需分析、市场回顾(按应用)、价格数据及2034年预测
 聚醚醚酮 (PEEK) 市场按增强类型、最终用户、加工方法和地区划分 - 预测至 2030 年
 全球 PEEK植入市场(按应用、最终用户和地区划分)
▼