


 |
市场调查报告书
商品编码
1687051
混凝土外加剂:市场占有率分析、产业趋势与统计、成长预测(2025-2030 年)Concrete Admixtures - Market Share Analysis, Industry Trends & Statistics, Growth Forecasts (2025 - 2030) |
||||||
价格
※ 本网页内容可能与最新版本有所差异。详细情况请与我们联繫。
简介目录
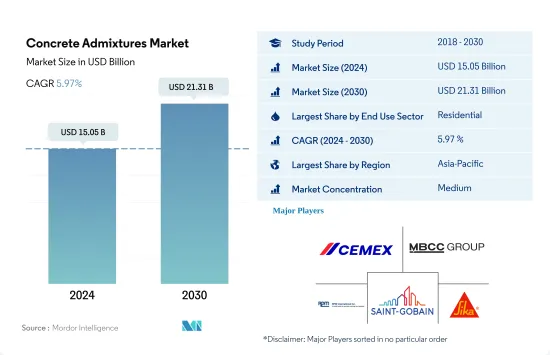
混凝土外加剂市场规模预计在 2024 年为 150.5 亿美元,预计到 2030 年将达到 213.1 亿美元,预测期内(2024-2030 年)的复合年增长率为 5.97%。
住宅需求的增加将推动未来混凝土外加剂的需求
- 2022年全球混凝土外加剂消费量成长约2.31%。预计到 2023 年,这一成长率将进一步增加 5.13%。需求激增来自基础设施和住宅建筑业。
- 住宅领域是全球最大的混凝土外加剂消费领域,2022 年的份额约为 32.2%。快速都市化、政府措施以及国内外投资等因素正在推动住宅需求。预计这将导致未来几年住宅活性化。例如,德国计划在2024年建造至少4000套新住宅。因此,预计到2030年住宅领域对混凝土外加剂的需求将比2023年增加26亿美元。
- 预计住宅领域将成为混凝土外加剂成长最快的消费领域,预测期内复合年增长率最高,为 6.67%。在持续的住宅需求、不断增长的投资和政府支持政策的推动下,到 2030 年,该行业的新增占地面积预计将增加 84 亿平方英尺。例如,印尼政府已设定目标,到 2025 年建造约 100 万套住宅,因为该国的住宅需求预计将达到 3,000 万套。总体而言,预计预测期内全球住宅领域新占地面积的复合年增长率将达到 3.81%,这将进一步推动混凝土外加剂的需求。
亚太地区住宅需求的不断增长可能会推动全球对混凝土外加剂的需求
- 2022年全球混凝土外加剂市场较2021年成长2.31%,其中亚太、欧洲等地区分别达到33%、24.5%的高成长。预计 2023 年全球混凝土外加剂将比 2022 年成长 5.13%。
- 2023年,亚太地区成为全球混凝土外加剂的领导者,占约33.1%的市占率。在该地区,基础设施建设和住宅领域占据混凝土外加剂市场的最大份额。光是基础建设一项,到2022年就将占据15.6亿美元的市场占有率,预计到2023年这一数字将成长7.24%。此外,预计与前一年同期比较增加364.2亿美元。预计 2022 年至 2023 年亚太地区混凝土外加剂市值将成长 5.35%。
- 预计亚太地区将成为混凝土外加剂成长最快的消费地区,预测期内复合年增长率为 6.70%。这一增长是由住宅领域对混凝土外加剂的需求所推动的。预计到 2024 年,该地区的新住宅占地面积将比 2023 年激增 5.24 亿平方英尺。据估计,到 2030 年,印度 40% 以上的人口将居住在都市区,这将需要约 2,500 万套经济适用住宅。因此,该地区的混凝土外加剂市场预计将从 2023 年的 460 亿美元成长到 2030 年的 730 亿美元。
混凝土外加剂市场的全球趋势
亚太地区大型办公大楼计划激增,带动全球专用商业建筑占地面积增加
- 2022年,全球新建商业建筑占地面积市场预计仅小幅成长,与前一年同期比较0.15%。欧洲表现突出,增幅达 12.70%,这得益于欧洲大力推行节能办公大楼以满足 2030 年碳排放目标。随着员工重返办公室,欧洲公司正在重新签订租约,刺激 2022 年新办公大楼建设面积达到 450 万平方英尺。预计这一势头将在 2023 年持续下去,全球成长率预计为 4.26%。
- 新冠疫情造成劳动力和材料短缺,导致商业建筑计划取消和延迟。然而,随着停工缓解和建设活动恢復,2021 年全球新增商业占地面积飙升 11.11%,其中亚太地区以 20.98% 的成长率领先。
- 展望未来,全球新增商业占地面积的复合年增长率将达到4.56%。预计亚太地区的复合年增长率将达到 5.16%,超过其他地区。这一成长背后的驱动力是中国、印度、韩国和日本商业设施建设计划的活性化。尤其北京、上海、香港、台北等中国主要城市的甲级办公室建设正在加速。此外,印度计划于 2023 年至 2025 年间在七大城市开设约 60 家购物中心,总面积约 2,325 万平方英尺。总合到 2030 年,亚太地区的这些措施将比 2022 年增加 15.6 亿平方英尺的新零售占地面积。
预计南美洲的住宅将出现最快的成长,这得益于政府加大对经济适用住宅计画的投资,这将推动全球住宅产业的发展。
- 2022年,全球新建住宅占地面积与2021年相比减少了约2.89亿平方英尺。这是由于土地稀缺、劳动力短缺以及建筑材料价格不可持续的高企造成的住宅危机。这场危机对亚太地区造成了严重影响,2022 年新占地面积与 2021 年相比下降了 5.39%。不过,2023 年的前景更加光明,预计全球新建占地面积将比 2022 年增长 3.31%,这要归功于政府投资,这些投资可以为 2030 年之前 30 亿人建造新的经济适用住宅提供资金。
- 新冠疫情造成经济放缓,导致大量住宅建设计划取消或延后,2020年全球新建占地面积较2019年下降4.79%。随着2021年限制措施的解除,住宅计划被压抑的需求得到释放,2021年全球新建占地面积较2020年增长11.22%,其中欧洲增幅最高,为18.28%,其次是南美洲,2021年较2020年增长17.36%。
- 预测期内,全球住宅新占地面积预计复合年增长率为 3.81%,其中南美洲的复合年增长率最快,为 4.05%。巴西的「Minha Casa Minha Vida」等计画和倡议于 2023 年宣布实施,并进行了一些监管改革,政府计划投资 19.8 亿美元为低收入家庭提供经济适用住宅;智利的 FOGAES 也于 2023 年宣布实施,初始投资为 5000 万美元。
混凝土外加剂产业概况
混凝土外加剂市场适度整合,前五大公司占42.27%的市占率。该市场的主要企业有:CEMEX、SAB de CV、MBCC Group、RPM International Inc.、Saint-Gobain 和 Sika AG(按字母顺序排列)。
其他福利
- Excel 格式的市场预测 (ME) 表
- 3个月的分析师支持
目录
第一章执行摘要和主要发现
第二章 报告要约
第三章 引言
- 研究假设和市场定义
- 研究范围
- 调查方法
第四章 产业主要趋势
- 最终用途趋势
- 商业
- 工业/设施
- 基础设施
- 住宅
- 重大基础设施计划(目前和已宣布)
- 法律规范
- 价值炼和通路分析
第五章市场区隔
- 最终使用区域
- 商业
- 工业/设施
- 基础设施
- 住宅
- 子产品
- 加速器
- 引气剂
- 高效减水剂(塑化剂)
- 缓速器
- 减缩剂
- 黏度调节剂
- 减水剂(塑化剂)
- 其他类型
- 地区
- 亚太地区
- 按国家
- 澳洲
- 中国
- 印度
- 印尼
- 日本
- 马来西亚
- 韩国
- 泰国
- 越南
- 其他亚太地区
- 欧洲
- 按国家
- 法国
- 德国
- 义大利
- 俄罗斯
- 西班牙
- 英国
- 其他欧洲国家
- 中东和非洲
- 按国家
- 沙乌地阿拉伯
- 阿拉伯聯合大公国
- 其他中东和非洲地区
- 北美洲
- 按国家
- 加拿大
- 墨西哥
- 美国
- 南美洲
- 按国家
- 阿根廷
- 巴西
- 南美洲其他地区
- 亚太地区
第六章竞争格局
- 关键策略趋势
- 市场占有率分析
- 商业状况
- 公司简介
- CEMEX, SAB de CV
- Fosroc, Inc.
- Jiangsu Subote New Material Co., Ltd.
- Kao Corporation
- MAPEI SpA
- MBCC Group
- MC-Bauchemie
- RPM International Inc.
- Saint-Gobain
- Sika AG
第七章:CEO面临的关键策略问题
第 8 章 附录
- 世界概况
- 概述
- 五力分析框架(产业吸引力分析)
- 全球价值链分析
- 市场动态(DRO)
- 资讯来源及延伸阅读
- 图片列表
- 关键见解
- 资料包
- 词彙表
简介目录
Product Code: 54293
The Concrete Admixtures Market size is estimated at 15.05 billion USD in 2024, and is expected to reach 21.31 billion USD by 2030, growing at a CAGR of 5.97% during the forecast period (2024-2030).
Rise in demand for housing units to drive the demand for concrete admixtures in the future
- In 2022, the global consumption value of concrete admixtures witnessed a growth of approximately 2.31%. This growth was projected to further increase by 5.13% in 2023. The surge in demand can be attributed to the infrastructure and residential construction sectors.
- The residential sector is the largest consumer of concrete admixtures across the globe, accounting for a share of around 32.2% in 2022. Factors such as rapid urbanization, government initiatives, and both foreign and domestic investments are fueling the demand for housing. This, in turn, is expected to boost residential construction in the coming years. For instance, Germany has plans to construct a minimum of 4,000 new housing units by 2024. Consequently, the demand for concrete admixtures in the residential sector is projected to rise by USD 2.6 billion by 2030 compared to 2023.
- The residential sector is expected to be the fastest-growing consumer of concrete admixtures, recording the highest CAGR of 6.67% during the forecast period. The sector's new floor area is set to expand by 8.4 billion sq. ft by 2030, driven by sustained housing demand, increasing investments, and supportive government policies. For instance, the Government of Indonesia (GOI) set a target of constructing around 1 million housing units by 2025, as the country's housing needs are projected to reach 30 million units. Overall, the global residential sector's new floor area is expected to witness a CAGR of 3.81% during the forecast period, further bolstering the demand for concrete admixtures.
Rise in demand for housing units in the Asia-Pacific region is likely to boost the demand for concrete admixtures globally
- In 2022, the global concrete admixtures market grew by 2.31% compared to 2021, with regions like Asia-Pacific and Europe recording the highest growth of 33% and 24.5%, respectively. Concrete admixtures were estimated to grow by 5.13% globally in 2023 compared to 2022.
- In 2023, the Asia-Pacific region emerged as the global leader in concrete admixtures, accounting for approximately 33.1% of the market. Within the region, the infrastructure and residential construction sectors held the largest shares of the concrete admixtures market. In 2022, infrastructure construction alone accounted for a market share of USD 1.56 billion, and this figure was projected to grow by 7.24% in 2023. Additionally, infrastructure spending in the region was set to rise by USD 36.42 billion in 2023, compared to the previous year. The concrete admixtures market in the Asia-Pacific region was expected to witness a 5.35% growth in value from 2022 to 2023.
- The Asia-Pacific region is expected to be the fastest-growing consumer of concrete admixtures, recording a CAGR of 6.70% during the forecast period. This growth can be attributed to the residential sector's demand for concrete admixtures. The region is projected to witness a surge of 524 million sq. ft in new residential floor area by 2024 compared to 2023. By 2030, it was estimated that over 40% of India's population will reside in urban areas, leading to a demand for approximately 25 million affordable housing units. Consequently, the concrete admixtures market in the region is expected to reach USD 73 billion by 2030, up from USD 46 billion in 2023.
Global Concrete Admixtures Market Trends
Asia-Pacific's surge in large-scale office building projects is set to elevate the global floor area dedicated to commercial construction
- In 2022, the global new floor area for commercial construction witnessed a modest growth of 0.15% from the previous year. Europe stood out with a significant surge of 12.70%, driven by a push for high-energy-efficient office buildings to align with its 2030 carbon emission targets. As employees returned to offices, European companies, resuming lease decisions, spurred the construction of 4.5 million square feet of new office space in 2022. This momentum is poised to persist in 2023, with a projected global growth rate of 4.26%.
- The COVID-19 pandemic caused labor and material shortages, leading to cancellations and delays in commercial construction projects. However, as lockdowns eased and construction activities resumed, the global new floor area for commercial construction surged by 11.11% in 2021, with Asia-Pacific taking the lead with a growth rate of 20.98%.
- Looking ahead, the global new floor area for commercial construction is set to achieve a CAGR of 4.56%. Asia-Pacific is anticipated to outpace other regions, with a projected CAGR of 5.16%. This growth is fueled by a flurry of commercial construction projects in China, India, South Korea, and Japan. Notably, major Chinese cities like Beijing, Shanghai, Hong Kong, and Taipei are gearing up for an uptick in Grade A office space construction. Additionally, India is set to witness the opening of approximately 60 shopping malls, spanning 23.25 million square feet, in its top seven cities between 2023 and 2025. Collectively, these endeavors across Asia-Pacific are expected to add a staggering 1.56 billion square feet to the new floor area for commercial construction by 2030, compared to 2022.
South America's estimated fastest growth in residential constructions due to increasing government investments in schemes for affordable housing to boost the global residential sector
- In 2022, the global new floor area for residential construction declined by around 289 million square feet compared to 2021. This can be attributed to the housing crisis generated due to the shortage of land, labor, and unsustainably high construction materials prices. This crisis severely impacted Asia-Pacific, where the new floor area declined 5.39% in 2022 compared to 2021. However, a more positive outlook is expected in 2023 as the global new floor area is predicted to grow by 3.31% compared to 2022, owing to government investments that can finance the construction of new affordable homes capable of accommodating 3 billion people by 2030.
- The COVID-19 pandemic caused an economic slowdown, due to which many residential construction projects got canceled or delayed, and the global new floor area declined by 4.79% in 2020 compared to 2019. As the restrictions were lifted in 2021 and pent-up demand for housing projects was released, new floor area grew 11.22% compared to 2020, with Europe having the highest growth of 18.28%, followed by South America, which rose 17.36% in 2021 compared to 2020.
- The global new floor area for residential construction is expected to register a CAGR of 3.81% during the forecast period, with South America predicted to develop at the fastest CAGR of 4.05%. Schemes and initiatives like the Minha Casa Minha Vida in Brazil announced in 2023 with a few regulatory changes, for which the government plans an investment of USD 1.98 billion to provide affordable housing units for low-income families, and the FOGAES in Chile also publicized in 2023, with an initial investment of USD 50 million, are aimed at providing mortgage loans to families for affordable housing and will encourage the construction of new residential units.
Concrete Admixtures Industry Overview
The Concrete Admixtures Market is moderately consolidated, with the top five companies occupying 42.27%. The major players in this market are CEMEX, S.A.B. de C.V., MBCC Group, RPM International Inc., Saint-Gobain and Sika AG (sorted alphabetically).
Additional Benefits:
- The market estimate (ME) sheet in Excel format
- 3 months of analyst support
TABLE OF CONTENTS
1 EXECUTIVE SUMMARY & KEY FINDINGS
2 REPORT OFFERS
3 INTRODUCTION
- 3.1 Study Assumptions & Market Definition
- 3.2 Scope of the Study
- 3.3 Research Methodology
4 KEY INDUSTRY TRENDS
- 4.1 End Use Sector Trends
- 4.1.1 Commercial
- 4.1.2 Industrial and Institutional
- 4.1.3 Infrastructure
- 4.1.4 Residential
- 4.2 Major Infrastructure Projects (current And Announced)
- 4.3 Regulatory Framework
- 4.4 Value Chain & Distribution Channel Analysis
5 MARKET SEGMENTATION (includes market size, forecasts up to 2030 and analysis of growth prospects.)
- 5.1 End Use Sector
- 5.1.1 Commercial
- 5.1.2 Industrial and Institutional
- 5.1.3 Infrastructure
- 5.1.4 Residential
- 5.2 Sub Product
- 5.2.1 Accelerator
- 5.2.2 Air Entraining Admixture
- 5.2.3 High Range Water Reducer (Super Plasticizer)
- 5.2.4 Retarder
- 5.2.5 Shrinkage Reducing Admixture
- 5.2.6 Viscosity Modifier
- 5.2.7 Water Reducer (Plasticizer)
- 5.2.8 Other Types
- 5.3 Region
- 5.3.1 Asia-Pacific
- 5.3.1.1 By Country
- 5.3.1.1.1 Australia
- 5.3.1.1.2 China
- 5.3.1.1.3 India
- 5.3.1.1.4 Indonesia
- 5.3.1.1.5 Japan
- 5.3.1.1.6 Malaysia
- 5.3.1.1.7 South Korea
- 5.3.1.1.8 Thailand
- 5.3.1.1.9 Vietnam
- 5.3.1.1.10 Rest of Asia-Pacific
- 5.3.2 Europe
- 5.3.2.1 By Country
- 5.3.2.1.1 France
- 5.3.2.1.2 Germany
- 5.3.2.1.3 Italy
- 5.3.2.1.4 Russia
- 5.3.2.1.5 Spain
- 5.3.2.1.6 United Kingdom
- 5.3.2.1.7 Rest of Europe
- 5.3.3 Middle East and Africa
- 5.3.3.1 By Country
- 5.3.3.1.1 Saudi Arabia
- 5.3.3.1.2 United Arab Emirates
- 5.3.3.1.3 Rest of Middle East and Africa
- 5.3.4 North America
- 5.3.4.1 By Country
- 5.3.4.1.1 Canada
- 5.3.4.1.2 Mexico
- 5.3.4.1.3 United States
- 5.3.5 South America
- 5.3.5.1 By Country
- 5.3.5.1.1 Argentina
- 5.3.5.1.2 Brazil
- 5.3.5.1.3 Rest of South America
- 5.3.1 Asia-Pacific
6 COMPETITIVE LANDSCAPE
- 6.1 Key Strategic Moves
- 6.2 Market Share Analysis
- 6.3 Company Landscape
- 6.4 Company Profiles
- 6.4.1 CEMEX, S.A.B. de C.V.
- 6.4.2 Fosroc, Inc.
- 6.4.3 Jiangsu Subote New Material Co., Ltd.
- 6.4.4 Kao Corporation
- 6.4.5 MAPEI S.p.A.
- 6.4.6 MBCC Group
- 6.4.7 MC-Bauchemie
- 6.4.8 RPM International Inc.
- 6.4.9 Saint-Gobain
- 6.4.10 Sika AG
7 KEY STRATEGIC QUESTIONS FOR CONCRETE, MORTARS AND CONSTRUCTION CHEMICALS CEOS
8 APPENDIX
- 8.1 Global Overview
- 8.1.1 Overview
- 8.1.2 Porter's Five Forces Framework (Industry Attractiveness Analysis)
- 8.1.3 Global Value Chain Analysis
- 8.1.4 Market Dynamics (DROs)
- 8.2 Sources & References
- 8.3 List of Tables & Figures
- 8.4 Primary Insights
- 8.5 Data Pack
- 8.6 Glossary of Terms
02-2729-4219
+886-2-2729-4219
 全球水泥粉煤灰市场:市场规模、占有率、成长率、产业分析、类型、应用及区域分析,未来预测(2026-2034)
 生物基混凝土外加剂市场规模、份额及成长分析(依产品类型、原料、应用及地区划分)-2026-2033年产业预测
 2025年全球减缩剂市场报告
 混凝土外加剂市场:按类型、材料类型、形式、应用和最终用户 - 全球预测 2025-20322025年全球水泥基辅助材料市场报告2025年全球混凝土外加剂市场报告
 全球混凝土化学外加剂市场需求分析(按地区、应用及预测)(至2034年)全球混凝土外加剂市场研究报告-产业分析、规模、份额、成长、趋势及2025年至2033年预测
 全球混凝土增密剂市场全球辅助胶凝材料市场:市场规模(依产品及地区)及未来预测
▼