


 |
市场调查报告书
商品编码
1687088
欧洲资料中心 -市场占有率分析、产业趋势与统计、成长预测(2025-2030)Europe Data Center - Market Share Analysis, Industry Trends & Statistics, Growth Forecasts (2025 - 2030) |
||||||
※ 本网页内容可能与最新版本有所差异。详细情况请与我们联繫。
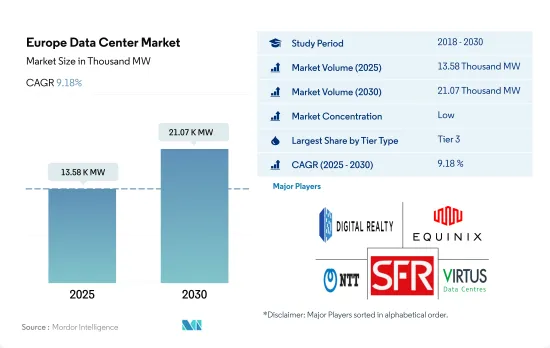
预计 2025 年欧洲资料中心市场规模为 13,580 千瓦,到 2030 年将达到 21,070 千瓦,复合年增长率为 9.18%。
预计主机託管收益将在 2025 年达到 181.083 亿美元,到 2030 年将达到 350.337 亿美元,预测期内(2025-2030 年)的复合年增长率为 14.11%。
2023 年, 层级 3资料中心将占据大部分份额,并预计在整个预测期内占据主导地位。
- 层级 3 细分市场因其特性而具有巨大优势,目前占据欧洲大部分市场份额。这些层级具有高度的冗余度以及多个电源和冷却路径。这些资料中心的运转率约为 99.982%,每年的停机时间为 1.6 小时。边缘和云端连接的日益普及预计将推动这一领域的成长。
- 英国拥有全国最多的层级 3资料中心,其中斯劳和大伦敦占据了最大份额。其他主要地点包括法国、德国和爱尔兰。都柏林是爱尔兰唯一一个拥有超过 98% 的层级 3资料中心设施的地区,其中北都柏林和南都柏林占据了最大份额。预计层级 3 部分将从 2023 年的 7,979.69 兆瓦成长到 2029 年的 12,110.18 兆瓦,复合年增长率为 7.20%。
- 预计在预测期内, 层级 4 部分的最高复合年增长率将达到 15.51%。各个已开发国家都致力于采用层级 4 认证,以获得所有组件完全容错和冗余的好处。这就是为什么开发中地区也采用层级 4 区域的原因。例如,传统 FLAP 市场之外的层级城市市场预计将从最初的低起始点实现最快的容量成长。特别是巴塞隆纳、米兰和罗马等大都市市场,预计未来四年资料中心容量将增加三倍。
- 目前,第 1层级和第 2 层类型的成长率最低,因为超过 70% 的流量在伺服器之间移动。现代应用程式需要更多资料在资料中心内以更快的速度传输,并且对延迟变得更加敏感。
FLAP-D 大都会市场(包括法兰克福、伦敦/斯隆、阿姆斯特丹、巴黎和都柏林)的数位化应用正在推动市场需求
- 最大的资料中心市场由 FLAP-D 大都会市场(包括法兰克福、伦敦/斯洛伐克、阿姆斯特丹、巴黎和都柏林)覆盖。随着数位服务和电力管理的日益普及,这些国家的主机託管设施正在不断扩张。 2022年8月,大伦敦政府宣布计画改变资料中心开发的申请流程,以便透过更好的能源管理法规解决和缓解西伦敦的电力危机。
- 伦敦的土地价格约为每平方英尺150美元。由于伦敦地价高昂,预计该行业将把投资转移到其他地价较低的城市。例如,阿姆斯特丹在 FLAP-D资料中心市场中建造设施的土地成本最低,为每平方英尺 38 美元。西班牙市场有许多第三方资料中心计划正在建设中,其中马德里和巴塞隆纳正在开发设施。
- 在可再生能源方面,在 FLAP-D 市场,可再生能源主要来自太阳能、风能、水能、海洋/波浪能和生质能源。例如,2022年4月,法国政府公布了基于2030年国家投资计画的可再生能源创新计划策略,投资额超过10亿美元。
- FLAP-D资料中心枢纽缺乏土地和熟练劳动力,并受到新兴地区的威胁。预计义大利、波兰、比利时和瑞典等国家未来几年将实现成长。就海底电缆连接而言,瑞典资料中心市场是北欧地区连接最紧密的市场之一。该国正在采用资料中心区域供热的概念。
欧洲资料中心市场趋势
OTT 订阅量、手机游戏和社群媒体的普及推动资料中心市场
- 到 2025 年,智慧型手机预计将占据欧洲近 85% 的连线份额。西欧拥有世界上最大的行动资料消费地区之一,而中欧和东欧则落后于全球平均。 2021年,西欧行动装置的每月流量将达到Terabyte。由于智慧型手机和行动游戏 OTT 订阅量的增加,平均资料量不断上升,进一步推动了对游戏和视讯内容直播的资料处理和储存设施的需求。在丹麦市场,2021 年消费者在影片上的总支出与 2020 年相比成长了 11.8%。 2021 年丹麦视讯市场规模将达到 45.91 亿丹麦克朗(6.078 亿欧元)以上。
- OTT 服务的持续趋势正在推动欧洲国家每部智慧型手机的资料通讯增加。例如,在丹麦,OTT订阅数量在2016年达到210万,预计到2021年将达到570万。瑞士的社群媒体用户数为754万,2021年至2022年间增加了44万,成长率为6.2%。资料消费量的增加、使用智慧型手机的时间的增加以及所有终端用户数位化的提高,导致每部智慧型手机的资料通讯增加。
- 2021 年新冠疫情爆发后,资料消费量显着增加,由于该地区的远距工作文化,更多用户转向智慧型手机。根据报告,透过网际网路交换业者 DE-CIX 交换的资料资料从 2020 年的 32 Exabyte增加到 2021 年的 38 Exabyte以上。这些统计数据表明,该地区每部智慧型手机的资料流量正在大幅增长。
欧洲用户在 App Store 和 Google Play 上的支出增加,无现金交易推动了对资料中心的需求
- 2021年,行动科技和服务将创造欧洲GDP的约4.6%,经济价值达到7,450亿欧元以上。欧洲智慧型手机的平均寿命为3年,年销售量约2.11亿支。
- 在欧洲,2021 年有 4.74 亿人订阅了行动服务。到 2025 年,这一数字预计将增长到 4.8 亿。超过三分之二的区域营运商已经建造5G网络,大多数欧洲国家已经推出5G商用服务。预计2025年欧洲将拥有3.11亿个5G连接,普及率达44%。 2021年,欧洲用户在App Store和Google Play的支出达到183亿美元。透过细分客户在应用程式内收费、订阅和付费应用程式方面的支出,该预测表明年度总收入将比 2020 年增长 22.8%。 2021 年,欧洲支出约占全球行动应用收入的 14%,达到 1,316 亿美元。
- 瑞士的网路普及率从 2016 年的 89% 上升到 2021 年的 96%,而智慧型手机用户数量从 2016 年的 690 万增加到 2021 年的 790 万。如此广泛的应用刺激了数位付款服务的发展,在新冠疫情期间,数位支付服务的使用量增加。瑞士越来越多的人使用无现金付款。只有35%的瑞士公民仍然喜欢用现金付款,这表明越来越多的人选择无现金付款。这些因素支撑了欧洲市场智慧型手机的使用日益增长,从而导致资料和储存容量需求不断增加。
欧洲资料中心产业概况
欧洲资料中心市场较为分散,前五大公司占了28.90%的市场。该市场的主要企业包括 Digital Realty Trust Inc.、Equinix Inc.、NTT Ltd、SOCIETE FRANCAISE DU RADIOTELEPHONE-SFR 和 Virtus Data Centres Properties Ltd (STT GDC)。
其他福利
- Excel 格式的市场预测 (ME) 表
- 3个月的分析师支持
目录
第一章执行摘要和主要发现
第二章 报告要约
第三章 引言
- 研究假设和市场定义
- 研究范围
- 调查方法
第四章 市场展望
- 负载能力
- 占地面积
- 主机代管收入
- 安装的机架数量
- 机架空间利用率
- 海底电缆
第五章 产业主要趋势
- 智慧型手机用户数量
- 每部智慧型手机的资料流量
- 行动资料速度
- 宽频资料速度
- 光纤连接网路
- 法律规范
- 奥地利
- 比利时
- 丹麦
- 法国
- 德国
- 爱尔兰
- 义大利
- 荷兰
- 挪威
- 波兰
- 俄罗斯
- 西班牙
- 瑞典
- 瑞士
- 英国
- 价值炼和通路分析
第六章市场区隔
- 资料中心规模
- 大规模
- 超大规模
- 中等规模
- 超大规模
- 小规模
- 层级类型
- 1层级和2级
- 层级
- 层级
- 吸收量
- 未使用
- 使用
- 按主机託管类型
- 超大规模
- 零售
- 批发的
- 按最终用户
- BFSI
- 云
- 电子商务
- 政府
- 製造业
- 媒体与娱乐
- 电信
- 其他的
- 国家
- 法国
- 德国
- 爱尔兰
- 荷兰
- 挪威
- 西班牙
- 瑞士
- 英国
- 其他欧洲国家
第七章竞争格局
- 市场占有率分析
- 商业状况
- 公司简介.
- CyrusOne Inc.
- Data4
- Digital Realty Trust Inc.
- Equinix Inc.
- Global Switch Holdings Limited
- Leaseweb Global BV
- NTT Ltd
- SOCIETE FRANCAISE DU RADIOTELEPHONE-SFR
- Stack Infrastructure Inc.
- Telehouse(KDDI Corporation)
- Vantage Data Centers LLC
- Virtus Data Centres Properties Ltd(STT GDC)
第八章:CEO面临的关键策略问题
第九章 附录
- 世界概况
- 概述
- 五力分析框架
- 全球价值链分析
- 全球市场规模和DRO
- 资讯来源及延伸阅读
- 图表清单
- 关键见解
- 资料包
- 词彙表
The Europe Data Center Market size is estimated at 13.58 thousand MW in 2025, and is expected to reach 21.07 thousand MW by 2030, growing at a CAGR of 9.18%. Further, the market is expected to generate colocation revenue of USD 18,108.3 Million in 2025 and is projected to reach USD 35,033.7 Million by 2030, growing at a CAGR of 14.11% during the forecast period (2025-2030).
Tier 3 data center accounted for majority share in terms of volume in 2023, and is expected to dominate through out the forecasted period
- The tier 3 segment currently has a majority of share in the European region due to the major advantage of its features. These tiers have a high redundancy level and multiple paths for power and cooling. These data centers have an uptime of around 99.982%, translating into a downtime of 1.6 hours per year. The increasing adoption of edge and cloud connectivity is expected to boost the segment's growth.
- The United Kingdom hosts the maximum number of tier 3 data centers in the country, with Slough and Greater London holding a major share. The other major locations are France, Germany, Ireland, and other countries. Dublin is the only region that hosts more than 98% of the tier 3 data center facilities in Ireland, with North and South Dublin holding a major share. The tier 3 segment is expected to grow from 7,979.69 MW in 2023 to 12,110.18 MW in 2029, with a CAGR of 7.20%.
- The tier 4 segment is expected to record the highest CAGR of 15.51% during the forecast period. Various developed countries are focusing on adopting Tier 4 certifications to get the advantage of complete fault tolerance and redundancy for every component. Thus, even the developing regions are adopting the tier 4 zone. For instance, the tier 2 metro markets, outside the traditional FLAP markets, are set to see the fastest capacity growth from a low initial starting point. In particular, the Barcelona, Milan, and Rome metro markets are expected to triple the amount of data center power over the next four years.
- Tier 1 & 2 types showcase the least majority growth as more than 70% of all traffic today moves from server to server. Modern applications require significantly more data to travel within a data center at faster speeds and are more particular about latency.
Adoption of digitization in FLAP-D metro markets (including Frankfurt, London/Slough, Amsterdam, Paris, and Dublin) increases the market demand
- The largest data center markets are covered by FLAP-D metro markets (including Frankfurt, London/Slough, Amsterdam, Paris, and Dublin). With the increasing adoption of digital services and power management, these countries are expanding their colocation facilities. In August 2022, the Greater London Authority announced plans to change the application process for data center development to tackle and ease the West London power crisis with better electricity management regulations.
- The land price in London is around USD 150 per sq. ft. The higher land cost in London is expected to shift investments to other cities in the industry with lower land prices. For instance, Amsterdam has a lower land price for building facilities in the FLAP-D data center market, which is USD 38 per sq. ft. The Spanish market has many third-party DC projects under construction, with facilities being developed in Madrid and Barcelona.
- In terms of renewable energy, in the FLAP-D market, renewable energy is majorly produced from solar, wind, hydroelectricity, marine and wave energy, and bioenergy. For instance, in April 2022, the French government announced a strategy for renewable energy innovation projects as per its 2030 national investment plan, with an investment of over USD 1 billion.
- As the FLAP-D data center hubs observe a lack of land availability and skilled workforce, they are under threat from emerging regions. Countries like Italy, Poland, Belgium, and Sweden are expected to showcase growth in the future. Sweden's data center market is one of the most connected locations in the Nordic region regarding subsea cable connectivity. The country has adopted the district heating concept for data centers.
Europe Data Center Market Trends
Increasing usage of OTT subscriptions and mobile gaming along with social media penetration increases the data center market
- By 2025, smartphones are expected to account for nearly 85% of connections in Europe. Western Europe is home to some of the world's biggest consumers of mobile data, while Central and Eastern Europe lag behind the global average. In 2021, in Western European, the traffic from mobile devices reached 4,189,615 terabytes per month. The growing average data volume due to rising OTT subscriptions for smartphones and mobile gaming is further driving the demand for data processing and storage facilities for live-streaming games and video content. The Danish market saw an 11.8% growth in total consumer spending on video in 2021 compared to 2020. The Danish video market represented a value of more than DKK 4,591 million (EUR 607.8 million) in 2021.
- The ongoing trend of OTT services is increasing data traffic per smartphone in European countries. For instance, in Denmark, OTT subscriptions reached 2.1 million in 2016 to 5.7 million in 2021. The number of social media users in Switzerland was 7.54 million, increasing by 440,000 between 2021 and 2022, indicating a 6.2% growth. Factors such as increased data consumption, time spent on smartphones, and growth of digitalization across all end users are leading to the rise in data traffic per smartphone.
- A major increase in data consumption was observed in 2021 after the COVID-19 pandemic, with more users switching to smartphones due to the remote working culture in the region. The data exchanged through the internet exchange operator, DE-CIX, reported an increase in data throughput from 32 exabytes in 2020 to more than 38 exabytes in 2021. Such statistics suggest the significant growth of data traffic per smartphone in the region.
Increasing spending by European users on the App Store and Google Play along with cashless transactions increases the Data Center demand
- In 2021, mobile technologies and services generated around 4.6% of the GDP in Europe, a contribution that amounted to more than EUR 745 billion of the economic value. The average lifespan of a smartphone in Europe is three years, with annual sales of almost 211 million units.
- In Europe, 474 million individuals were subscribers to mobile services in 2021. By 2025, this number is projected to increase to 480 million. Over two-thirds of regional operators have built 5G networks, and most European nations have implemented commercial 5G services. There may be 311 million 5G connections in Europe by 2025, representing a 44% adoption rate. The year 2021 witnessed USD 18.3 billion in spending by European users on the App Store and Google Play. Based on customer spending for in-app purchases, subscriptions, and premium apps, this prediction represented a 22.8% rise in yearly gross income from 2020. European spending accounted for approximately 14% of global mobile app revenue in 2021, which reached USD 131.6 billion.
- The internet penetration in Switzerland increased from 89% in 2016 to 96% in 2021, while at the same time, the number of smartphone users increased from 6.9 million in 2016 to 7.9 million in 2021. Owing to such extensive use, digital payment services were promoted, and their application increased due to the COVID-19 pandemic. More people in Switzerland are using cashless transactions. Only 35% of Swiss citizens still prefer cash as a form of payment, indicating that people are increasingly choosing cashless transactions, while the rest favor using a card or an app to pay. Such factors indicate the rising use of smartphones in the European market, resulting in a constant increase in data and necessitating a growing amount of storage space.
Europe Data Center Industry Overview
The Europe Data Center Market is fragmented, with the top five companies occupying 28.90%. The major players in this market are Digital Realty Trust Inc., Equinix Inc., NTT Ltd, SOCIETE FRANCAISE DU RADIOTELEPHONE - SFR and Virtus Data Centres Properties Ltd (STT GDC) (sorted alphabetically).
Additional Benefits:
- The market estimate (ME) sheet in Excel format
- 3 months of analyst support
TABLE OF CONTENTS
1 EXECUTIVE SUMMARY & KEY FINDINGS
2 REPORT OFFERS
3 INTRODUCTION
- 3.1 Study Assumptions & Market Definition
- 3.2 Scope of the Study
- 3.3 Research Methodology
4 MARKET OUTLOOK
- 4.1 It Load Capacity
- 4.2 Raised Floor Space
- 4.3 Colocation Revenue
- 4.4 Installed Racks
- 4.5 Rack Space Utilization
- 4.6 Submarine Cable
5 Key Industry Trends
- 5.1 Smartphone Users
- 5.2 Data Traffic Per Smartphone
- 5.3 Mobile Data Speed
- 5.4 Broadband Data Speed
- 5.5 Fiber Connectivity Network
- 5.6 Regulatory Framework
- 5.6.1 Austria
- 5.6.2 Belgium
- 5.6.3 Denmark
- 5.6.4 France
- 5.6.5 Germany
- 5.6.6 Ireland
- 5.6.7 Italy
- 5.6.8 Netherlands
- 5.6.9 Norway
- 5.6.10 Poland
- 5.6.11 Russia
- 5.6.12 Spain
- 5.6.13 Sweden
- 5.6.14 Switzerland
- 5.6.15 United Kingdom
- 5.7 Value Chain & Distribution Channel Analysis
6 MARKET SEGMENTATION (INCLUDES MARKET SIZE IN VOLUME, FORECASTS UP TO 2030 AND ANALYSIS OF GROWTH PROSPECTS)
- 6.1 Data Center Size
- 6.1.1 Large
- 6.1.2 Massive
- 6.1.3 Medium
- 6.1.4 Mega
- 6.1.5 Small
- 6.2 Tier Type
- 6.2.1 Tier 1 and 2
- 6.2.2 Tier 3
- 6.2.3 Tier 4
- 6.3 Absorption
- 6.3.1 Non-Utilized
- 6.3.2 Utilized
- 6.3.2.1 By Colocation Type
- 6.3.2.1.1 Hyperscale
- 6.3.2.1.2 Retail
- 6.3.2.1.3 Wholesale
- 6.3.2.2 By End User
- 6.3.2.2.1 BFSI
- 6.3.2.2.2 Cloud
- 6.3.2.2.3 E-Commerce
- 6.3.2.2.4 Government
- 6.3.2.2.5 Manufacturing
- 6.3.2.2.6 Media & Entertainment
- 6.3.2.2.7 Telecom
- 6.3.2.2.8 Other End User
- 6.4 Country
- 6.4.1 France
- 6.4.2 Germany
- 6.4.3 Ireland
- 6.4.4 Netherlands
- 6.4.5 Norway
- 6.4.6 Spain
- 6.4.7 Switzerland
- 6.4.8 United Kingdom
- 6.4.9 Rest of Europe
7 COMPETITIVE LANDSCAPE
- 7.1 Market Share Analysis
- 7.2 Company Landscape
- 7.3 Company Profiles (includes Global Level Overview, Market Level Overview, Core Business Segments, Financials, Headcount, Key Information, Market Rank, Market Share, Products and Services, and Analysis of Recent Developments).
- 7.3.1 CyrusOne Inc.
- 7.3.2 Data4
- 7.3.3 Digital Realty Trust Inc.
- 7.3.4 Equinix Inc.
- 7.3.5 Global Switch Holdings Limited
- 7.3.6 Leaseweb Global BV
- 7.3.7 NTT Ltd
- 7.3.8 SOCIETE FRANCAISE DU RADIOTELEPHONE - SFR
- 7.3.9 Stack Infrastructure Inc.
- 7.3.10 Telehouse (KDDI Corporation)
- 7.3.11 Vantage Data Centers LLC
- 7.3.12 Virtus Data Centres Properties Ltd (STT GDC)
- 7.4 LIST OF COMPANIES STUDIED
8 KEY STRATEGIC QUESTIONS FOR DATA CENTER CEOS
9 APPENDIX
- 9.1 Global Overview
- 9.1.1 Overview
- 9.1.2 Porter's Five Forces Framework
- 9.1.3 Global Value Chain Analysis
- 9.1.4 Global Market Size and DROs
- 9.2 Sources & References
- 9.3 List of Tables & Figures
- 9.4 Primary Insights
- 9.5 Data Pack
- 9.6 Glossary of Terms
 资料中心能源概况 - Oracle:自 2019 年以来,能源使用量以 24% 的复合年增长率成长,由于可再生能源的使用,排放保持稳定,但 Stargate 专案可能会大幅增加碳足迹。
 氢动力资料中心市场分析及预测(至2035年):类型、产品类型、服务、技术、组件、应用、部署模式、最终用户、功能、安装模式资料中心市场分析及预测(至2035年):类型、产品类型、服务、技术、组件、应用、部署模式、最终用户、解决方案
 2026年全球资料中心市场报告
 在轨资料中心:趋势与分析太空资料中心:趋势与分析
 2026-2030年全球资料中心维护与支援服务市场小型资料中心市场分析及预测(至2035年):依类型、产品类型、服务、技术、元件、应用、部署类型、最终使用者、模组及功能划分模组化资料中心市场分析及预测(至2035年):按类型、产品类型、服务、技术、组件、应用、形式、部署类型、最终用户和功能划分
 亚太地区资料中心市场占有率分析、产业趋势与统计、成长预测(2026-2031)