


 |
市场调查报告书
商品编码
1687227
除草剂-市场占有率分析、产业趋势与统计、成长预测(2025-2030)Herbicide - Market Share Analysis, Industry Trends & Statistics, Growth Forecasts (2025 - 2030) |
||||||
价格
※ 本网页内容可能与最新版本有所差异。详细情况请与我们联繫。
简介目录
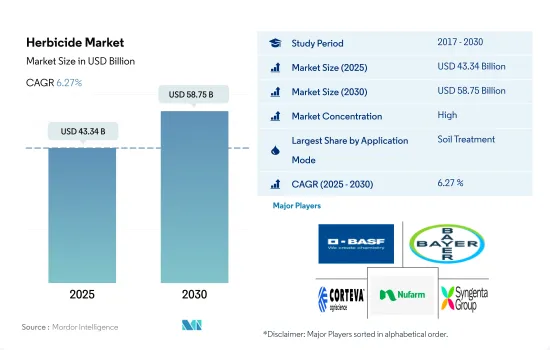
除草剂市场规模预计在 2025 年达到 433.4 亿美元,预计到 2030 年将达到 587.5 亿美元,预测期内(2025-2030 年)的复合年增长率为 6.27%。
土壤施用除草剂占据全球除草剂市场主导地位
- 杂草是造成农业系统产量损失和品质下降的主要原因。杂草与作物争夺光、水和养分等资源。杂草也会作为破坏性植物病原体的宿主,或作为在植物之间传播病原体的昆虫媒介,或两者兼而有之,从而危害作物。使用除草剂是控制杂草最有效的方法,它比其他控制杂草的方法更便宜、更可靠、节省劳力和时间。可以使用几种除草剂施用技术来控制各种大小的草本杂草、树木和灌木。
- 土壤施用在全球除草剂市场中占据主导地位,2022 年占 48.4% 的市场占有率。出苗前除草剂可经由土壤处理施用。儘早抑制杂草将有助于作物在生长季节有一个良好的开始。土壤活性除草剂具有不同的活性成分和施用时间,可以帮助解决棘手的抗性杂草并减缓除草剂抗性的产生。
- 2022 年,叶面喷布占全球除草剂市值的 30.3%。出苗后除草剂也可以透过这种方式施用。为了达到效果,出苗后除草剂必须从叶面转移到目标部位。叶面喷布方法,其次是化学施用方法,占 2022 年全球除草剂市场的 19.6%。
- 在农业领域,使用除草剂可以优化作物生产力并提高整体盈利。预测期内(2023-2029 年),除草剂使用量的复合年增长率预计达到 5.1%。
杂草导致作物损失增加,预计增加除草剂需求
- 杂草是各种种植制度中生产的主要生物限制因素。杂草造成的作物产量损失取决于几个因素,包括杂草出现的时间、杂草密度、杂草类型和作物类型。如果不加以控制,杂草可能会导致 100% 的产量损失。除草剂是全球杂草控制的重要组成部分。
- 2022年,南美洲占全球除草剂市场的35.5%(以金额为准计算)。南美洲除草剂市场正在经历成长,包括阿根廷、巴西、智利和其他南美国家。由于这些国家是主要的农业生产国,拥有大片农田,因此使用除草剂对于控制杂草数量和确保最佳作物产量至关重要。预计南美除草剂市场在预测期内(2023-2029 年)的复合年增长率将达到 5.2%。
- 2022 年北美占全球除草剂市场的 31.6%(以金额为准计算)。北美气候多样,适合全部区域多种作物。北美洲种植谷物、豆类、水果、蔬菜和观赏植物。大多数黄金时段的农民都实行单一栽培,即在广大的土地上种植单一作物作为主要收入来源,导致杂草滋生增加、产量下降。约翰草、稗草、帕尔默苋菜和仙人掌是该地区的主要杂草。
- 预计预测期内(2023-2029 年)全球除草剂市场的复合年增长率将达到 5.1%。农作物损失的增加、保护农作物的需要、对杂草控制的认识的不断提高以及对农产品的需求的不断增加正在推动市场的成长。
全球除草剂市场趋势
杂草适应不同环境和产生抗药性的能力导致了除草剂使用率的增加。
- 过去一段时期,全球每公顷除草剂的平均消费量增加了44.4%,从2017年的1.8公斤/公顷增加到2022年的2.6公斤/公顷。杂草的适应性强、繁殖速度快,导致与作物的竞争加剧,造成产量损失增加,因此与去年同期相比,增加化学除草剂施用量的需求增加。因此,越来越需要增加除草剂的使用来控制杂草并防止农业生产力损失。
- 与杀菌剂和杀虫剂相比,除草剂是最常用的化学农药。在所有地区中,南美洲由于大豆、玉米、甘蔗等作物产量强劲,且商业化种植规模大、种植密度高,2022年每公顷消费量最高,为5.3公斤。集约化耕作方式增加了杂草压力,因此需要使用除草剂来控制杂草数量并有效保护作物产量。紧接着南美洲的是北美洲和欧洲,2022年每公顷平均消费量分别为1.8公斤和1.7公斤。
- 抗除草剂杂草的增加和蔓延已成为全球农民面临的严重问题,导致除草剂的使用增加以及使用多种除草剂来对抗这些抗性杂草族群。例如,长芒苋和普通水麻对Glyphosate有抗性,马尾草和大豚草对多种除草剂有抗性,而藜草对乙酰乳酸合成酶抑制除草剂有抗性。
- 由于杂草适应不同环境和产生抗药性等因素,对除草剂喷洒的需求正在迅速增加。
2,4-D和Glyphosate是世界广泛用于选择性控制阔叶杂草的除草剂。
- 甲草胺是一种三嗪类除草剂。价格为每吨16,600美元。它被广泛用于控制农作物中的多种杂草。甲草胺特异性针对叶绿体中的光系统 II (PSII) 蛋白质复合物,抑制植物在光合作用过程中将光能转化为化学能的能力。这会导致有毒化合物的积聚,最终杀死目标杂草。
- Atrazine是一种除草剂,广泛用于控制玉米和水稻作物中的阔叶杂草和禾本科杂草,如稗草、苋菜属和苋菜。 2022年,该除草剂的价值为13,500美元。印度是世界上最大的莠Atrazine技术进口国,而中国是最大的出口国。
- Paraquat是一种广泛使用的除草剂,属于Bipyridylium化合物家族。由于Paraquat起效快且无选择性,它通常被用作种植前或出苗前除草剂,以在作物出苗前控制杂草。它对棉花、玉米、大豆和甘蔗等多种作物都有效。 2022 年Paraquat的价格为 7,000 美元。
- 二甲戊灵是一种Dinitroanilines除草剂。广泛用于防治农作物中的多种一年生杂草和阔叶杂草。 2022 年的价格为每吨 3,300 美元。二甲戊灵可抑制杂草早期生长,减少杂草生长早期与作物的竞争。
- 2,4-D和Glyphosate是世界广泛用于选择性控制阔叶杂草的除草剂。 2022 年的价格分别为 2,300 美元和 1,100 美元。
除草剂行业概况
除草剂市场格局较为集中,前五大公司占69.12%的市占率。市场的主要企业包括BASF公司、拜耳公司、科迪华农业科技、纽发姆有限公司、先正达集团等。
其他福利
- Excel 格式的市场预测 (ME) 表
- 3个月的分析师支持
目录
第一章执行摘要和主要发现
第二章 报告要约
第三章 引言
- 研究假设和市场定义
- 研究范围
- 调查方法
第四章 产业主要趋势
- 每公顷农药消费量
- 活性成分价格分析
- 法律规范
- 阿根廷
- 澳洲
- 巴西
- 加拿大
- 智利
- 中国
- 法国
- 德国
- 印度
- 印尼
- 义大利
- 日本
- 墨西哥
- 缅甸
- 荷兰
- 巴基斯坦
- 菲律宾
- 俄罗斯
- 南非
- 西班牙
- 泰国
- 乌克兰
- 英国
- 美国
- 越南
- 价值炼和通路分析
第五章市场区隔
- 应用模式
- 化学灌溉
- 叶面喷布
- 熏蒸
- 土壤处理
- 作物类型
- 经济作物
- 水果和蔬菜
- 粮食
- 豆类和油籽
- 草坪和观赏植物
- 地区
- 非洲
- 按国家
- 南非
- 其他非洲国家
- 亚太地区
- 按国家
- 澳洲
- 中国
- 印度
- 印尼
- 日本
- 缅甸
- 巴基斯坦
- 菲律宾
- 泰国
- 越南
- 其他亚太地区
- 欧洲
- 按国家
- 法国
- 德国
- 义大利
- 荷兰
- 俄罗斯
- 西班牙
- 乌克兰
- 英国
- 其他欧洲国家
- 北美洲
- 按国家
- 加拿大
- 墨西哥
- 美国
- 北美其他地区
- 南美洲
- 按国家
- 阿根廷
- 巴西
- 智利
- 其他南美国家
- 非洲
第六章竞争格局
- 关键策略趋势
- 市场占有率分析
- 商业状况
- 公司简介
- ADAMA Agricultural Solutions Ltd
- BASF SE
- Bayer AG
- Corteva Agriscience
- FMC Corporation
- Jiangsu Yangnong Chemical Co. Ltd
- Nufarm Ltd
- Sumitomo Chemical Co. Ltd
- Syngenta Group
- UPL Limited
第七章:CEO面临的关键策略问题
第 8 章 附录
- 世界概况
- 概述
- 五力分析框架
- 全球价值链分析
- 市场动态(DRO)
- 资讯来源及延伸阅读
- 图片列表
- 关键见解
- 资料包
- 词彙表
简介目录
Product Code: 56812
The Herbicide Market size is estimated at 43.34 billion USD in 2025, and is expected to reach 58.75 billion USD by 2030, growing at a CAGR of 6.27% during the forecast period (2025-2030).
Soil application dominates the global herbicide market
- Weeds are a major contributor to yield loss and reduced quality in an agricultural system. They compete with the crop for resources like light, water, and nutrients. Weeds can also harm crop plants by acting as reservoirs for destructive plant pathogens, the insect vectors that move these pathogens from plant to plant, or both. The use of herbicides is the most effective weed management tool, as it is cheaper, more reliable, and more labor- and time-saving than other weed control measures. Several herbicide application techniques can be used to control herbaceous weeds, trees, and bushes of various sizes.
- Soil application dominated the global herbicide market, accounting for a market share of 48.4% in 2022. Pre-emergence herbicides can be applied through soil treatment. By reducing weed pressures early on, crops can get off to a strong start during the cropping season. With different active ingredients and application timings, soil-active herbicides can help tackle troublesome resistant weeds and slow down the development of herbicide resistance.
- Foliar application accounted for 30.3% of the global herbicide market value in 2022. Post-emergence herbicides can be applied through this method. A post-emergence herbicide must move from the leaf surface and reach the target site to be effective. Following the foliar method, chemigation accounted for 19.6% of the global herbicide market in 2022.
- In the agricultural sector, herbicide usage optimizes crop productivity and enhances overall profitability. The usage of herbicides is expected to register a CAGR of 5.1% during the forecast period (2023-2029).
Rising crop losses due to the weeds are expected to boost the demand for herbicides
- Weeds are a major biotic constraint to production in different cropping systems. Yield losses in crops due to weeds depend on several factors, such as weed emergence time, weed density, type of weeds, and crop types. Weeds can result in 100% yield loss if left uncontrolled. Herbicides are an integral part of weed control globally.
- In 2022, South America accounted for a market share of 35.5%, by value, of the global herbicide market. The herbicide market in South America is experiencing growth in various countries, including Argentina, Brazil, Chile, and the rest of South American countries. As these countries are major agricultural producers with vast expanses of farmland, the use of herbicides is crucial to manage weed populations and ensure optimal crop yields. The South American herbicide market is projected to record a CAGR of 5.2% during the forecast period (2023-2029).
- North America accounted for 31.6%, by value, of the global herbicide market in 2022. North America's diverse climate allows for the cultivation of a wide range of crop types across the region. North Americans cultivate grains, legumes, fruits, vegetables, and ornamental plants. Primetime farmers mostly practice monoculture, i.e., cultivating a single crop for their primary income in a very large area, leading to an increase in weed infestation and reduced yields. Johnsongrass, barnyard grass, Palmer amaranth, and prickly sid are major weeds found in the region.
- The global herbicide market is projected to register a CAGR of 5.1% during the forecast period (2023-2029). The rising crop losses, the need to protect crops, increasing awareness of weed control, and rising demand for agriculture products are driving the market's growth.
Global Herbicide Market Trends
The high ability of weeds to adapt to different environments and develop resistance is leading to higher herbicide application rates
- The global average per-hectare consumption of herbicides increased by 44.4% during the historical period, from 1.8 kg/ha in 2017 to 2.6 kg/ha in 2022. The need for increased application of chemical herbicides is growing Y-o-Y as the adaptability and rapid reproduction of weeds make them highly competitive with crops, leading to higher yield losses. Hence, there is a growing need for more herbicide applications to control weeds and prevent reduced agricultural productivity.
- Herbicides are the most applied chemical pesticides compared to fungicides and insecticides. Among all the regions, South America had the highest per-hectare consumption in 2022, accounting for 5.3 kg, attributed to its extensive production of crops such as soybeans, corn, and sugarcane, which often involves large-scale commercial farming and high-density planting. Intensive agricultural practices contribute to higher weed pressure, necessitating herbicides to manage weed populations and protect crop yields effectively. South America was followed by North America and Europe, with an average per hectare consumption of 1.8 kg and 1.7 kg, respectively, in 2022.
- The rising prevalence and spread of herbicide-resistant weeds have become a growing issue for farmers across the globe, leading to the escalated usage of herbicides or the application of multiple herbicides to combat these resistant weed populations. For instance, palmer amaranth and common water hemp are resistant to glyphosate, horseweed and giant ragweed are resistant to multiple herbicides, and kochia is resistant to acetolactate synthase-inhibiting herbicides.
- The need for herbicide application is increasing drastically due to factors like the high ability of weeds to adapt to different environments and develop resistance.
2,4-D and glyphosate are widely used herbicides globally for selective control of broadleaf weeds
- Metribuzin is a herbicide belonging to the chemical class of triazines. It was priced at USD 16.6 thousand per metric ton. It is widely used to control various weed species in crops. Metribuzin specifically targets the photosystem II (PSII) protein complex in chloroplasts, disrupting the plants' ability to convert light energy into chemical energy during photosynthesis. This leads to the accumulation of toxic by-products and, ultimately, the death of the targeted weeds.
- Atrazine is an herbicide widely used to control broadleaf and grassy weeds like Echinochloa, Elusine spp., and Amaranthus viridis in maize and rice crops. The herbicide was valued at USD 13.5 thousand in 2022. India is the largest importer of atrazine technical worldwide, while China is the largest exporter.
- Paraquat is a widely used herbicide belonging to the chemical class of bipyridylium compounds. Due to its rapid action and non-selective nature, paraquat is commonly used as a pre-plant or pre-emergence herbicide to control weeds before crops emerge. It is effective in a wide range of crops, including cotton, corn, soybeans, and sugarcane. Paraquat was priced at USD 7.0 thousand in 2022.
- Pendimethalin is a herbicide belonging to the chemical class of dinitroanilines. It is widely used to control various annual grasses and broadleaf weeds in agricultural crops. It was priced at USD 3.3 thousand per metric ton in 2022. By disrupting early weed development, pendimethalin helps reduce weed competition with crops during their early growth stages.
- 2,4-D and glyphosate are widely used herbicides globally for selective control of broadleaf weeds. They were priced at USD 2.3 thousand and USD 1.1 thousand, respectively, in 2022.
Herbicide Industry Overview
The Herbicide Market is fairly consolidated, with the top five companies occupying 69.12%. The major players in this market are BASF SE, Bayer AG, Corteva Agriscience, Nufarm Ltd and Syngenta Group (sorted alphabetically).
Additional Benefits:
- The market estimate (ME) sheet in Excel format
- 3 months of analyst support
TABLE OF CONTENTS
1 EXECUTIVE SUMMARY & KEY FINDINGS
2 REPORT OFFERS
3 INTRODUCTION
- 3.1 Study Assumptions & Market Definition
- 3.2 Scope of the Study
- 3.3 Research Methodology
4 KEY INDUSTRY TRENDS
- 4.1 Consumption Of Pesticide Per Hectare
- 4.2 Pricing Analysis For Active Ingredients
- 4.3 Regulatory Framework
- 4.3.1 Argentina
- 4.3.2 Australia
- 4.3.3 Brazil
- 4.3.4 Canada
- 4.3.5 Chile
- 4.3.6 China
- 4.3.7 France
- 4.3.8 Germany
- 4.3.9 India
- 4.3.10 Indonesia
- 4.3.11 Italy
- 4.3.12 Japan
- 4.3.13 Mexico
- 4.3.14 Myanmar
- 4.3.15 Netherlands
- 4.3.16 Pakistan
- 4.3.17 Philippines
- 4.3.18 Russia
- 4.3.19 South Africa
- 4.3.20 Spain
- 4.3.21 Thailand
- 4.3.22 Ukraine
- 4.3.23 United Kingdom
- 4.3.24 United States
- 4.3.25 Vietnam
- 4.4 Value Chain & Distribution Channel Analysis
5 MARKET SEGMENTATION (includes market size in Value in USD and Volume, Forecasts up to 2030 and analysis of growth prospects)
- 5.1 Application Mode
- 5.1.1 Chemigation
- 5.1.2 Foliar
- 5.1.3 Fumigation
- 5.1.4 Soil Treatment
- 5.2 Crop Type
- 5.2.1 Commercial Crops
- 5.2.2 Fruits & Vegetables
- 5.2.3 Grains & Cereals
- 5.2.4 Pulses & Oilseeds
- 5.2.5 Turf & Ornamental
- 5.3 Region
- 5.3.1 Africa
- 5.3.1.1 By Country
- 5.3.1.1.1 South Africa
- 5.3.1.1.2 Rest of Africa
- 5.3.2 Asia-Pacific
- 5.3.2.1 By Country
- 5.3.2.1.1 Australia
- 5.3.2.1.2 China
- 5.3.2.1.3 India
- 5.3.2.1.4 Indonesia
- 5.3.2.1.5 Japan
- 5.3.2.1.6 Myanmar
- 5.3.2.1.7 Pakistan
- 5.3.2.1.8 Philippines
- 5.3.2.1.9 Thailand
- 5.3.2.1.10 Vietnam
- 5.3.2.1.11 Rest of Asia-Pacific
- 5.3.3 Europe
- 5.3.3.1 By Country
- 5.3.3.1.1 France
- 5.3.3.1.2 Germany
- 5.3.3.1.3 Italy
- 5.3.3.1.4 Netherlands
- 5.3.3.1.5 Russia
- 5.3.3.1.6 Spain
- 5.3.3.1.7 Ukraine
- 5.3.3.1.8 United Kingdom
- 5.3.3.1.9 Rest of Europe
- 5.3.4 North America
- 5.3.4.1 By Country
- 5.3.4.1.1 Canada
- 5.3.4.1.2 Mexico
- 5.3.4.1.3 United States
- 5.3.4.1.4 Rest of North America
- 5.3.5 South America
- 5.3.5.1 By Country
- 5.3.5.1.1 Argentina
- 5.3.5.1.2 Brazil
- 5.3.5.1.3 Chile
- 5.3.5.1.4 Rest of South America
- 5.3.1 Africa
6 COMPETITIVE LANDSCAPE
- 6.1 Key Strategic Moves
- 6.2 Market Share Analysis
- 6.3 Company Landscape
- 6.4 Company Profiles (includes Global level Overview, Market level overview, Core Business Segments, Financials, Headcount, Key Information, Market Rank, Market Share, Products and Services, and analysis of Recent Developments)
- 6.4.1 ADAMA Agricultural Solutions Ltd
- 6.4.2 BASF SE
- 6.4.3 Bayer AG
- 6.4.4 Corteva Agriscience
- 6.4.5 FMC Corporation
- 6.4.6 Jiangsu Yangnong Chemical Co. Ltd
- 6.4.7 Nufarm Ltd
- 6.4.8 Sumitomo Chemical Co. Ltd
- 6.4.9 Syngenta Group
- 6.4.10 UPL Limited
7 KEY STRATEGIC QUESTIONS FOR CROP PROTECTION CHEMICALS CEOS
8 APPENDIX
- 8.1 Global Overview
- 8.1.1 Overview
- 8.1.2 Porter's Five Forces Framework
- 8.1.3 Global Value Chain Analysis
- 8.1.4 Market Dynamics (DROs)
- 8.2 Sources & References
- 8.3 List of Tables & Figures
- 8.4 Primary Insights
- 8.5 Data Pack
- 8.6 Glossary of Terms
02-2729-4219
+886-2-2729-4219
 2025年全球土壤活性除草剂市场报告2025年全球除草剂安全剂市场报告
 麦草畏除草剂市场规模、份额、成长分析(依物理形态、施用时间、作物类型、剂型、地区)- 产业预测,2025 年至 2032 年
 2032 年Paraquat市场预测:按产品类型、作物类型、应用、最终用户和地区进行的全球分析2032 年除草剂市场预测:按产品类型、应用、最终用户和地区进行的全球分析
 2025 年至 2033 年除草剂市场规模、份额、趋势及预测(按类型、作用方式、应用和地区)2025年全球智慧除草市场报告
 全球除草剂安全剂市场:市场规模、份额、趋势分析(按产品类型、应用阶段和地区)、细分市场预测(2025-2030 年)2025年除草剂全球市场报告2025年全球不织布除草布市场报告
▼