


 |
市场调查报告书
商品编码
1687251
石油与天然气资本支出展望 -市场占有率分析、产业趋势与统计、成长预测(2025-2030 年)Oil and Gas CAPEX Outlook - Market Share Analysis, Industry Trends & Statistics, Growth Forecasts (2025 - 2030) |
||||||
价格
※ 本网页内容可能与最新版本有所差异。详细情况请与我们联繫。
简介目录
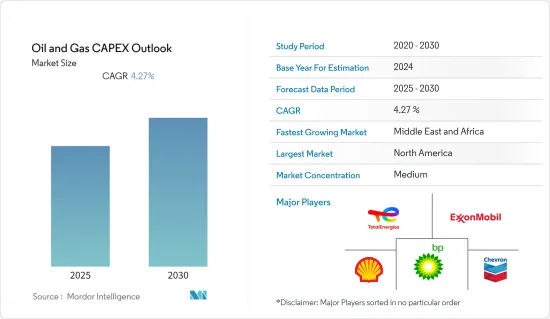
预计预测期内石油和天然气资本支出市场复合年增长率将达到 4.27%。
2020年市场受到了新冠疫情的影响,目前市场已恢復到疫情前的水准。
关键亮点
- 从中期来看,由于能源需求的快速增长、陆上蕴藏量的枯竭以及各国政府努力探勘海上资源,对海上石油和天然气活动的投资不断增加,预计将在未来几年推动石油和天然气资本支出市场的成长。
- 另一方面,预计原油和天然气价格的波动以及全球经济成长放缓将在预测期内抑製石油和天然气资本投资。
- 北海、墨西哥湾以及塞内加尔和毛里求斯等新兴国家正在进行一些近海、深水和超深水勘探,为增加资本支出提供了充足的机会。
- 得益于全球一体化大型石油公司、国家石油公司的营运以及新的投资,预测期内北美的资本支出增幅最高。
石油和天然气资本支出市场趋势
上游产业主导市场
- 随着新冠疫情封锁措施放鬆,对石油和天然气的需求增加,上游石油和天然气产业的投资开始復苏。需求成长推动油价在2022年回升。例如,2020年原油价格约为每桶41.96美元,但2022年可能达到每桶110美元以上,引发石油和天然气产业投资激增。
- 预计石油和天然气资本支出市场将经历强劲增长,原因是计划成本降低和投资组合优化趋势带来更高的盈利、利润率较低的油田的剥离以及专注于投资利润率更高的增长机会等因素。
- 上游是最大的产业,可能是资本支出最高的产业。目前,世界各地的国有企业都优先发展国内石油和天然气计划,以提高能源安全并减少对外国能源来源的依赖。
- 根据国际能源总署(IEA)的数据,预计2022年全球对石油、天然气和低碳燃料的投资将达到约1.73兆美元,与前一年同期比较成长6.7%以上。
- 多家石油天然气巨头已宣布2023年后资本支出将高于平均水准。例如,2022年12月,雪佛龙公司宣布其2023年有机资本支出预算为:合併子公司140亿美元(CAPEX),股权关联公司30亿美元(关联CAPEX)。
- 雪佛龙公司预计 2023 年上游资本和勘探支出预算约为 115 亿美元。上游资本支出包括二迭纪盆地开发活动的 40 多亿美元和其他页岩和緻密资产的约 20 亿美元。超过20%的上游资本支出将用于墨西哥湾计划。
- 印度石油天然气公司(ONGC)计划在未来三年(2022-25 财年)内投入约 38 亿美元的资本支出,扩大其勘探活动。就勘探支出而言,这相当于过去三个财年(2019 财年-2022 财年)支出 25 亿美元的 150%。
- 因此,为了满足全球日益增长的原油和天然气需求,需要在探勘和生产活动方面投入更多资金,从而推动石油和天然气产业的资本支出。
北美占据市场主导地位
- 北美是石油和天然气行业资本投资最大的市场之一,其中美国处于领先地位,其次是加拿大和墨西哥。美国是美国最大的原油和天然气生产国,预计未来几年将满足全球约60%的石油需求。
- 美国一直处于领先地位,预计在预测期内将继续主导该地区的石油和天然气资本支出市场。预测期内,该国的石油和天然气计划将占北美总投资的约70%。在该国所有上游计划中,预计将超过 80% 为新厂计画,而预测期内扩建计划预计将占剩余的 20%。
- 根据美国能源资讯署(EIA)的数据,2021年该国原油产量将达到1,124万桶/日。 2019年原油产量大幅下降。同年,原油产量达到了1,225万桶/日的历史最高水准。美国生产的原油比世界上任何其他国家都多。
- 截至 2022 年 2 月,该国正在规划或宣布的石化工厂资本支出计画约为 600 亿美元。预计这些计划将在预测期内推动美国下游产业的固定资产资本支出市场。
- 此外,2021年至2023年间,加拿大大型石油和天然气营运商Enbridge预计将在该国投资总计160亿美元。 Tervita 也宣布 2021 年的资本支出约为 6,000 万美元,而 2020 年为 3,300 万美元。因此,预计预测期内资本支出将进一步增加。
- 因此,随着大量石油和天然气计划的建设、提案和计划,预计石油和天然气资本支出市场在预测期内将显着增长。
石油和天然气资本支出产业概览
全球石油和天然气资本支出市场适度细分。主要参与企业(不分先后顺序)包括英国石油公司、埃克森美孚、道达尔能源公司、雪佛龙公司和壳牌公司。
其他福利
- Excel 格式的市场预测 (ME) 表
- 3个月的分析师支持
目录
第一章 引言
- 研究范围
- 市场定义
- 调查前提
第二章调查方法
第三章执行摘要
第四章 市场概述
- 介绍
- 至2028年的市场规模及需求预测(单位:美元)
- 2028年石油产量与消费量预测
- 2028年天然气产量与消费量预测
- 截至 2028 年的历史和预测管道装置容量(公里)
- 緻密油、油砂和深水原油产量的历史和预测(以千桶/天为基准,至 2030 年)
- 近期趋势和发展
- 政府法规和政策
- 市场动态
- 驱动程式
- 天然气需求不断增长以及天然气基础设施的发展
- 海上石油和天然气探勘活动增加
- 限制因素
- 采用更清洁的替代燃料
- 油价波动剧烈
- 驱动程式
- 供应链分析
- 波特五力分析
- 供应商的议价能力
- 消费者议价能力
- 新进入者的威胁
- 替代品的威胁
- 竞争对手之间的竞争
第五章市场区隔
- 部门
- 上游
- 中游
- 下游
- 地点
- 陆上
- 海上
- 地区
- 北美洲
- 美国
- 加拿大
- 墨西哥
- 欧洲
- 德国
- 英国
- 俄罗斯
- 挪威
- 荷兰
- 其他欧洲国家
- 亚太地区
- 中国
- 印度
- 马来西亚
- 印尼
- 东南亚国协
- 其他亚太地区
- 南美洲
- 巴西
- 委内瑞拉
- 阿根廷
- 哥伦比亚
- 南美洲其他地区
- 中东和非洲
- 沙乌地阿拉伯
- 阿拉伯聯合大公国
- 埃及
- 奈及利亚
- 其他中东和非洲地区
- 北美洲
第六章竞争格局
- 併购、合资、合作与协议
- 主要企业策略
- 公司简介
- BP plc
- Shell plc
- Chevron Corporation
- Total Energies SE
- Exxon Mobil Corporation
- Oil and Natural Gas Corporation(ONGC)
- China National Petroleum Corporation(CNPC)
- Cairn Oil & Gas, Vertical of Vedanta Limited
- Petroleo Brasileiro SA
- Equinor ASA
第七章 市场机会与未来趋势
- 新兴市场尚未开发的石油和天然气潜力
简介目录
Product Code: 57110
The Oil and Gas CAPEX Market is expected to register a CAGR of 4.27% during the forecast period.
The market was impacted by COVID-19 in 2020. Presently the market has now reached pre-pandemic levels.
Key Highlights
- Over the medium term, the rising investments in offshore oil & gas activities owing to the surging energy demand, depleting onshore reserves, and efforts from governments across nations to explore their offshore resources are expected to drive the growth of the oil & gas capex market in the coming years.
- On the other hand, volatile crude oil and natural gas prices, coupled with slow economic growth at a global level, are expected to restrain the oil and gas CAPEX during the forecast period.
- Nevertheless, several offshore, deep, and ultra-deepwater explorations in the North Sea, Gulf of Mexico, and developing countries such as Senegal and Mauritiana, provide ample opportunity for increased capital expenditure.
- North America has recorded the highest gains in CAPEX, owing to operations of globally integrated majors, along with national oil companies and new investments during the forecast period.
CAPEX Oil and Gas Market Trends
Upstream Sector to Dominate the Market
- Investment in the upstream oil & gas industry had started recovering after the rise in oil & gas demand amid the opening of the COVID-19 lockdowns. An increase in demand recovered crude oil prices in 2022. For instance, in 2020, crude oil prices were about USD 41.96 per barrel, and in 2022 the prices reached more than USD 110 per barrel, which resulted in a surge in investment in the oil & gas industry.
- The oil and gas CAPEX market is expected to witness significant growth owing to factors, including strong profitability due to a trend toward reducing project costs and optimizing portfolios, which has led to divesting of low-margin fields, as well as a greater emphasis on investments in higher-margin growth opportunities.
- The upstream sector is likely to be the largest segment and the one with the highest CAPEX, as several state-owned companies worldwide are prioritizing domestic oil and gas projects to increase energy security and reduce their dependence upon foreign energy sources.
- According to Internation Energy Agency (IEA), The global oil & gas, low carbon fuel investments reached around USD 1.73 trillion in 2022, representing an increase of more than 6.7% compared to the previous year's value.
- Several oil and gas majors have announced more than average increases in capital expenditures for 2023 and beyond. For instance, in December 2022, Chevron Corporation announced 2023 organic capital expenditure budgets of USD 14 billion for its consolidated subsidiaries (CAPEX) and USD 3 billion for its equity affiliates (affiliate CAPEX).
- Chevron Corporation has planned an upstream capital and exploratory expenditure budget of approximately USD 11.5 billion for 2023. The upstream capex includes more than USD 4 billion for development activities in the Permian Basin and approximately USD 2 billion for other shale and tight assets. More than 20% of the upstream capex is dedicated to Gulf of Mexico projects.
- Over the next three fiscal years, during FY 2022-25, Oil and Natural Gas Corporation (ONGC) planned to increase its exploration activity with capital expenditures of approximately USD 3.8 billion. In terms of exploration expenditures, this represents 150 percent of the USD 2.5 billion spent during the previous three fiscal years (FY 2019-22).
- Hence, to meet the strong global demand for crude oil and natural gas, more investment is required for exploration and production activities, which promulgates the CAPEX in the oil and gas industry.
North America to Dominate the Market
- North America is one of the largest markets in terms of capital expenditure in the oil and gas industry, with the United States being the leader, followed by Canada and Mexico. The United States is a major crude oil and natural gas producer in the world, and the country is expected to cover around 60% of the world's oil demand in the coming years.
- The United States has always been at the forefront in the past and is also expected to dominate the region's oil and gas CAPEX market in the forecast period. The country oil and gas projects accounts for approximately 70% of the total investments in North America during the forecast period. Of the total number of upstream projects in the country, more than 80% are estimated to be the new build while the expansion projects are expected to account for the remaining 20% during the forecast period.
- According to United States Energy Information Administration (EIA), crude oil production in the country record 11.24 million mbpd in 2021. The crude oil production declined significantly in 2019. In the same year, oil production reached the highest point in history with 12.25 million mbpd. The United States produces more oil than any other country in the world.
- As of February 2022, the country has approximately USD 60 billion of CAPEX plans for petrochemical plants that are either under planned or announced stages. The projects are likely to propel the CAPEX market for fixed assets in the downstream sector of the United States during the forecast period.
- Furthermore, in between 2021-2023, a major Canadian oil and gas operator, Enbridge, is expected to invest a total of USD 16 billion in the country. Another company Tervita announced a capital investment of around USD 60 million in 2021 compared to 33 million in 2020. Therefore, the CAPEX is further expected to increase during the forecast period.
- Therefore, with a decent number of several oil & gas projects under construction, proposal, and planning stages, the oil and gas CAPEX market is expected to witness significant growth during the forecast period.
CAPEX Oil and Gas Industry Overview
The global oil and gas CAPEX market is moderately fragmented. Some of the key players (in no particular order) include BP PLC, Exxon Mobil Corporation, TotalEnergies SE, Chevron Corporation, and Shell PLC.
Additional Benefits:
- The market estimate (ME) sheet in Excel format
- 3 months of analyst support
TABLE OF CONTENTS
1 INTRODUCTION
- 1.1 Scope of the Study
- 1.2 Market Definition
- 1.3 Study Assumptions
2 RESEARCH METHODOLOGY
3 EXECUTIVE SUMMARY
4 MARKET OVERVIEW
- 4.1 Introduction
- 4.2 Market Size and Demand Forecast in USD, till 2028
- 4.3 Crude Oil Production and Consumption Forecast, till 2028
- 4.4 Natural Gas Production and Consumption Forecast, till 2028
- 4.5 Installed Pipeline Historic Capacity and Forecast in Kilometers, till 2028
- 4.6 Historic and Production Forecast of Tight Oil, Oil Sands, and Crude from Deepwater in kb/d, until 2030
- 4.7 Recent Trends and Developments
- 4.8 Government Policies and Regulations
- 4.9 Market Dynamics
- 4.9.1 Drivers
- 4.9.1.1 Increasing Demand for Natural Gas and Developing Gas Infrastructure
- 4.9.1.2 Increasing Offshore Oil & Gas Exploration Activities
- 4.9.2 Restraints
- 4.9.2.1 Adoption of Cleaner Alternatives
- 4.9.2.2 High Volatility of Crude Oil Prices
- 4.9.1 Drivers
- 4.10 Supply Chain Analysis
- 4.11 Porter's Five Forces Analysis
- 4.11.1 Bargaining Power of Suppliers
- 4.11.2 Bargaining Power of Consumers
- 4.11.3 Threat of New Entrants
- 4.11.4 Threat of Substitutes Products and Services
- 4.11.5 Intensity of Competitive Rivalry
5 MARKET SEGMENTATION
- 5.1 Sector
- 5.1.1 Upstream
- 5.1.2 Midstream
- 5.1.3 Downstream
- 5.2 Location
- 5.2.1 Onshore
- 5.2.2 Offshore
- 5.3 Geography
- 5.3.1 North America
- 5.3.1.1 United States
- 5.3.1.2 Canada
- 5.3.1.3 Mexico
- 5.3.2 Europe
- 5.3.2.1 Germany
- 5.3.2.2 United Kingdom
- 5.3.2.3 Russia
- 5.3.2.4 Norway
- 5.3.2.5 Netherlands
- 5.3.2.6 Rest of Europe
- 5.3.3 Asia-Pacific
- 5.3.3.1 China
- 5.3.3.2 India
- 5.3.3.3 Malaysia
- 5.3.3.4 Indonesia
- 5.3.3.5 ASEAN Countries
- 5.3.3.6 Rest of Asia-Pacific
- 5.3.4 South America
- 5.3.4.1 Brazil
- 5.3.4.2 Venezuela
- 5.3.4.3 Argentina
- 5.3.4.4 Colombia
- 5.3.4.5 Rest of South America
- 5.3.5 Middle-East and Africa
- 5.3.5.1 Saudi Arabia
- 5.3.5.2 United Arab Emirates (UAE)
- 5.3.5.3 Egypt
- 5.3.5.4 Nigeria
- 5.3.5.5 Rest of Middle East and Africa
- 5.3.1 North America
6 COMPETITIVE LANDSCAPE
- 6.1 Mergers and Acquisitions, Joint Ventures, Collaborations, and Agreements
- 6.2 Strategies Adopted by Leading Players
- 6.3 Company Profiles
- 6.3.1 BP plc
- 6.3.2 Shell plc
- 6.3.3 Chevron Corporation
- 6.3.4 Total Energies SE
- 6.3.5 Exxon Mobil Corporation
- 6.3.6 Oil and Natural Gas Corporation (ONGC)
- 6.3.7 China National Petroleum Corporation (CNPC)
- 6.3.8 Cairn Oil & Gas, Vertical of Vedanta Limited
- 6.3.9 Petroleo Brasileiro SA
- 6.3.10 Equinor ASA
7 MARKET OPPORTUNITIES AND FUTURE TRENDS
- 7.1 Untapped Oil and Gas Potential in Emerging Markets
02-2729-4219
+886-2-2729-4219
 2025年全球石油和天然气中游设备市场报告
 石油和天然气工程服务市场按服务类型、计划类型、合约类型、所用技术、应用和最终用户划分——2025-2030 年全球预测
 全球减压气油市场全球石油和天然气渔业市场全球上游油气市场2025年全球真空柴油市场报告2025年全球石油和天然气基础设施市场报告2025年全球石油和天然气测量仪器市场报告
 生产测试市场规模、份额及成长分析(按测试类型、测试方法、应用、服务类型和地区)- 产业预测,2025 年至 2032 年
 2021-2031 年石油和天然气渔业市场规模及预测、全球和区域份额、趋势和成长机会分析报告涵盖范围:按产品、应用和地理划分
▼