


 |
市场调查报告书
商品编码
1687406
频谱仪(OSA) -市场占有率分析、产业趋势与统计、成长预测(2025-2030)Optical Spectrum Analyzer (OSA) - Market Share Analysis, Industry Trends & Statistics, Growth Forecasts (2025 - 2030) |
||||||
※ 本网页内容可能与最新版本有所差异。详细情况请与我们联繫。
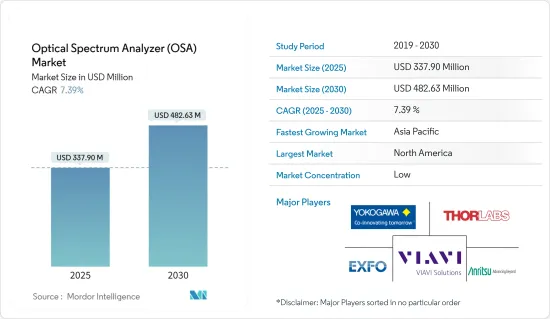
频谱仪市场规模预计在 2025 年为 3.379 亿美元,预计到 2030 年将达到 4.8263 亿美元,预测期内(2025-2030 年)的复合年增长率为 7.39%。
频谱仪是支援多种通讯应用研发和安装工作的关键零件,包括雷射模式分析、超高解析度光谱测量以及通讯设备和系统测试。
主要亮点
- 最近的趋势包括使用光学技术对高性能产品进行广泛的研究和开发,例如为资料通讯而开发的半导体雷射器,这导致对评估和分析这些产品频谱的高性能频谱仪的需求增加。
- 此外,商业和住宅网路用户的大量增加迫使营运商满足频宽。这导致营运商对频谱相关测试设备进行了大量投资。
- 对互联环境的需求不断增长,尤其是製造业的需求,已经开始推动对更快、更可靠的通讯网路的需求。
- 5G和云端通讯服务的引入预计将大幅增加资料流量和资料生成。为了实现快速扩展和部署更快光学模组所需的准时交付,需要增加模组产量并减少检查时间。
- 对更快、更可靠的通讯网路的需求是由研发支出的增加、技术进步以及对联网领域日益增长的需求所推动的,尤其是在製造业。
- 这些行动版本的製造程序扩大了可用的频谱仪的范围,特别是对于测试和安装现场。通讯业和製造业对频谱仪(OSA)的需求正在快速成长。
频谱仪(OSA)市场趋势
预计通讯将占最大份额
- 在通讯业中,频谱分析仪对于确定确保可靠网路所需的讯号频谱和强度至关重要。频谱仪用于持续监测所需的输出讯号,帮助通讯供应商动态调变讯号强度。
- OSA对于通讯设备製造商来说也非常重要。该行业对 OSA 的需求相当高,因为大多数电讯设备的製造程序都包括波长特性测试,以确保产品符合市场进入条件。
- OSA 在通讯的主要应用之一是使用密集分波多工(DWDM) 透过光纤提供高资料频宽。大多数通讯设备的製造程序都包括波长特性测试,以确保产品符合市场准入要求,而该领域对 OSA 的需求相当高。
- 快速发展的通讯网路和5G等新频谱也为先进通讯设备创造了巨大的需求机会,从而推动了通讯製造商对OSA的需求增加。
- 在这个市场中,各种公司都为通讯应用提供 OSA。例如,横河测试测量公司提供AQ6360频谱仪。它是一款经济高效的频谱仪,非常适合雷射器、光收发器和光放大器等通讯设备的工业生产。
预计北美仍将是强劲市场
- 北美是世界上最大的频谱仪市场之一。促进自动化和互联製造环境的倡议4.0 计划的快速采用是该地区对频谱仪需求的主要驱动力之一。
- 由于美国市场上有几家重要的製造商,且受到新兴经济体的推动,美国市场对频谱仪的需求可能会成长。
- 随着 5G 在该地区的进展,所有主要服务供应商都在致力于推出支援该技术的新设备。从加拿大业者已经在600MHz 5G频谱竞标中投资35亿美元就可以看出这一点。
- 例如,加拿大最大的无线通讯业者将在 2021 年投资近 90 亿美元用于新的 5G 频谱,消费者的期望很高。罗杰斯已投资33亿加币用于5G频谱,涵盖加拿大99.4%的人口,成为加拿大5G频谱最大的单一投资者。贝尔在竞标中投资了 21 亿加元,而 TELUS 投资了 19.5 亿加元。 Videotron 已投资约 8.3 亿美元,其中超过一半来自安大略省、曼尼托巴省、亚伯达和不列颠哥伦比亚省。
- 爱立信预测,到2023年,网路流量将至少成长8倍。在这种情况下,5G网路每GB的成本可能比目前的4G网路便宜10倍。这些优势预计将鼓励该地区增加对通讯领域的投资,为频谱仪市场创造新的机会。
- 2021年5月,加拿大EXFO宣布推出5GPro最佳频谱分析仪(OSA)。它是唯一模组化、以现场为中心的射频 (RF) 测试解决方案。 EXFO 解决方案提供 4G/LTE 和 5G NR 环境的准确可视性,透过单一、可现场升级的解决方案分析 FR1(6GHz 以下)和 FR2(毫米波)频宽。
频谱仪(OSA)产业概览
频谱领域的竞争非常激烈,主要企业包括横河电机、Exfo Inc.、VIAVI、安立和 Thorlabs。我们在研发方面的大量投资以及不断创新产品的能力使我们在市场上具有竞争优势。策略联盟和併购帮助这些参与者在市场上站稳了脚步。
- 2021 年 9 月-横河马达(日本)宣布推出一款新型频谱仪,供开发下一代光纤通讯组件的研究人员使用。横河马达的AQ6380 OSA具有无与伦比的光学性能,使科学家和工程师能够开发和提高下一代通讯网路的速度、频宽和品质。
- 2021 年 6 月 - 布里斯托仪器宣布推出可将其 438 系列多波长计转变为高解析度频谱仪的软体。高精度、高达 10 Hz 的测量速率以及从 1000 至 1680 nm 的宽工作范围使 Model 438 成为当今最精确、最有效和用途最广泛的 WDM 波长测试仪。
其他福利:
- Excel 格式的市场预测 (ME) 表
- 3个月的分析师支持
目录
第一章 引言
- 研究假设和市场定义
- 研究范围
第二章调查方法
- 研究框架
- 二次调查
- 初步调查
- 资料三角测量与洞察生成
第三章执行摘要
第四章 市场洞察
- 市场概览
- 产业吸引力-波特五力分析
- 新进入者的威胁
- 买家的议价能力
- 供应商的议价能力
- 替代品的威胁
- 竞争对手之间的竞争强度
- 价值链分析
- COVID-19 市场影响评估
第五章市场动态
- 市场驱动因素
- 5G(毫米波)技术的发展
- 市场挑战/限制
- 频谱仪产品更新换代
第六章市场区隔
- 按类型
- 可携式的
- 手持式
- 桌上型
- 按最终用户产业
- 通讯
- 卫生保健
- 消费性电子产品
- 其他最终用户产业
- 按地区
- 北美洲
- 欧洲
- 亚太地区
- 拉丁美洲
- 中东和非洲
第七章竞争格局
- 公司简介
- Yokogawa Test & Measurement Corporation
- Thorlabs Inc.
- VIAVI Solutions Inc.
- Exfo Inc.
- Anritsu Corporation
- Quantifi Photonics Limited
- Apex Technologies
- Aragon Photonics Brillouin
- II-VI Incorporated
- Luna Innovations
- ID Photonics GmbH
第八章投资分析
第九章:未来趋势
The Optical Spectrum Analyzer Market size is estimated at USD 337.90 million in 2025, and is expected to reach USD 482.63 million by 2030, at a CAGR of 7.39% during the forecast period (2025-2030).
Optical spectrum analyzers are the key components enabling the research and development and installation operations in several communication applications such as laser modes analysis, very high-resolution spectroscopic measurements, telecommunication devices, system tests, and others.
Key Highlights
- In recent years, research and development of highly proficient high-performance products using optical technologies, such as a semiconductor laser developed for data communication, has become more widespread, and the growing demand has developed for high-performance optical spectrum analyzers to evaluate and analyze their optical spectrum.
- Additionally, the significant increase in internet users, both commercially as well as residentially, forced the operators to meet the growing demand for bandwidth. This further aided the operators in investing heavily in testing equipment related to the optical spectrum.
- The increasing demand for connected environments, especially in the manufacturing sector, has started driving the demand for faster and more reliable communication networks.
- The introduction of 5G and cloud communications services is expected to increase the data traffic volumes and data generation massively. In order to allow in-time delivery required for the rapid expansion and adoption of faster rate optical modules, increased module production and shorter inspection times are required.
- The demand for faster and more reliable communication networks has grown because of increased spending on research and development, technical advancements, and the growing need for networked areas, particularly in the manufacturing sector.
- The manufacturing procedure for these mobile versions has expanded the variety of optical spectrum analyzers available in the field, particularly for testing and installation. The telecommunications and manufacturing industries significantly demand optical spectrum analyzers (OSA).
Optical Spectrum Analyzer (OSA) Market Trends
Telecommunications is Expected to Hold the Largest Share
- In the telecom industry, spectrum analyzers are essential for determining the required signal spectrum and strength to ensure a reliable network. Optical spectrum analyzers are used to monitor the required output signals continuously, which helps telecom providers to modulate the intensity of their signals dynamically.
- Also, OSA's are of great importance to the telecom equipment manufacturers. As most telecom equipment fabrication procedure includes a wavelength characterization test to qualify a product for market entry, the demand for OSAs from this sector is considerably high.
- One of the major applications of the OSAs in telecommunications is where dense wavelength division multiplexing (DWDM) is used to provide high data bandwidth over fiber optics. Most telecommunication equipment fabrication procedures include a wavelength characterization test in qualifying a product for market entry; the demand for OSAs from this sector is considerably high.
- Rapidly evolving communication networks and a new spectrum like 5G are also creating significant demand opportunities for advanced telecommunication equipment, contributing to increased demand for OSAs from telecom manufacturers.
- Various companies operating in the market are providing OSA for telecommunication applications. For instance, Yokogawa Test & Measurement Corporation provides the AQ6360 optical spectrum analyzer. It is a cost-effective optical spectrum analyzer ideal for industrial manufacturing of telecom devices, such as lasers, optical transceivers, and optical amplifiers.
North-America is Expected to Maintain a Strong Hold over the Market
- North America is one of the largest markets for optical spectrum analyzers globally. The rapid adoption of Industry 4.0 initiatives encouraging automation and a connected manufacturing environment is one of the primary drivers creating the demand for optical spectrum analyzers in the region.
- Owing to several vital manufacturers and backed by the developed economy, the demand for optical spectrum analyzers is likely to grow in the US market.
- Due to the advancement of 5G in the region, all the major service providers are moving toward launching new devices that support the technology, thus, creating a potential demand for the OSAs in the market. It is evident because Canadian operators already spent USD 3.5 billion in a 5G spectrum auction for the 600 MHz band, a vital frequency that penetrates buildings and works well in rural areas.
- For instance, in 2021, Canada's largest wireless companies spent almost USD 9 billion on a new 5G spectrum 2021, and consumer expectations are high. Rogers invested CAD 3.3 billion in the 5G spectrum, covering 99.4% of the Canadian population, making it the largest single investor in the 5G spectrum in the country. Bell spent USD 2.1 billion in the auction and TELUS USD 1.95 billion. Videotron spent nearly USD 830 million, with more than half of Ontario, Manitoba, Alberta, and British Columbia investments.
- Ericsson predicts that by 2023, the network traffic will increase by at least eight times. In such a scenario, the current 5G networks will enable ten times lower cost per gigabyte than the current 4G networks. Such benefits are expected to increase investments in the region's telecom sector, creating new opportunities for the optical spectrum analyzer market.
- In May 2021, EXFO, Canada, introduced the 5GPro optimum spectrum analyzer (OSA), the only modular, field-focused radio frequency (RF) testing solution. EXFO solution will provide accurate visibility into 4G/LTE and 5G NR environments to analyze FR1(sub-6 GHz) and FR2 (mmWave) bands using a single, field-upgradeable solution.
Optical Spectrum Analyzer (OSA) Industry Overview
The competitive rivalry among the players in the optical spectrum analysis is high owing to the presence of some key players, such as Yokogawa, Exfo Inc., VIAVI, Anritsu, Thorlabs, and many more. Their ability to continuously innovate the products by investing a considerable amount in research and development has allowed them to gain a competitive advantage over others in the market. Strategic alliances and mergers and acquisitions have enabled such players to gain a strong foothold in the market.
- September 2021 - Yokogawa, Japan, has launched a new optical spectrum analyzer for researchers developing the next generation of optical communication components. The Yokogawa AQ6380 OSA offers unequaled optical performance to allow scientists and engineers to develop and improve the next generation of communication networks' speed, bandwidth, and quality.
- June 2021 - Bristol Instruments announced offering software that converts 438 Series Multi-Wavelength Meter into a high-resolution optical spectrum analyzer. The model 438 offered the most accurate, effective, and adaptable WDM wavelength testing currently available, owing to features like high precision, measurement rate up to 10 Hz, and a wide operational range of 1000 to 1680 nm.
Additional Benefits:
- The market estimate (ME) sheet in Excel format
- 3 months of analyst support
TABLE OF CONTENTS
1 INTRODUCTION
- 1.1 Study Assumptions and Market Definition
- 1.2 Scope of the Study
2 RESEARCH METHODOLOGY
- 2.1 Research Framework
- 2.2 Secondary Research
- 2.3 Primary Research
- 2.4 Data Triangulation & Insight Generation
3 EXECUTIVE SUMMARY
4 MARKET INSIGHTS
- 4.1 Market Overview
- 4.2 Industry Attractiveness - Porter's Five Forces Analysis
- 4.2.1 Threat of New Entrants
- 4.2.2 Bargaining Power of Buyers
- 4.2.3 Bargaining Power of Suppliers
- 4.2.4 Threat of Substitute Products
- 4.2.5 Intensity of Competitive Rivalry
- 4.3 Value Chain Analysis
- 4.4 Assessment of Impact of COVID-19 on The Market
5 MARKET DYNAMICS
- 5.1 Market Drivers
- 5.1.1 Growth of 5G (Millimeter Wave) Technology
- 5.2 Market Challenges/Restraints
- 5.2.1 Replacement of Optical Spectrum Analyzer Products with Advanced Products
6 MARKET SEGMENTATION
- 6.1 By Type
- 6.1.1 Portable
- 6.1.2 Handheld
- 6.1.3 Benchtop
- 6.2 By End-user Industry
- 6.2.1 Telecommunication
- 6.2.2 Healthcare
- 6.2.3 Consumer Electronics
- 6.2.4 Other End-user Industry
- 6.3 By Geography
- 6.3.1 North America
- 6.3.2 Europe
- 6.3.3 Asia-Pacific
- 6.3.4 Latin America
- 6.3.5 Middle-East and Africa
7 COMPETITIVE LANDSCAPE
- 7.1 Company Profiles
- 7.1.1 Yokogawa Test & Measurement Corporation
- 7.1.2 Thorlabs Inc.
- 7.1.3 VIAVI Solutions Inc.
- 7.1.4 Exfo Inc.
- 7.1.5 Anritsu Corporation
- 7.1.6 Quantifi Photonics Limited
- 7.1.7 Apex Technologies
- 7.1.8 Aragon Photonics Brillouin
- 7.1.9 II-VI Incorporated
- 7.1.10 Luna Innovations
- 7.1.11 ID Photonics GmbH
8 INVESTMENT ANALYSIS
9 FUTURE TRENDS
 全球频谱分析仪市场:产业分析、规模、份额、成长、趋势与预测(2025-2032)
 2025 年至 2033 年频谱分析仪市场报告(按分析仪类型、产品、频率范围、设计类型、技术类型、最终用途行业和地区划分)
 全球频谱分析仪市场规模、份额、趋势分析报告:2024 年至 2031 年按分析仪类型、产品类型、频宽、应用和地区分類的展望和预测
 2025年频谱分析仪全球市场报告
 频谱分析仪市场:2025-2030 年预测可携式频谱分析仪市场:未来预测(2025-2030)远端频谱分析仪市场:未来预测(2025-2030)
 频谱仪市场按类型、最终用途产业和地区划分
 频谱分析仪市场规模、份额、成长分析,按产品、按类型、按频率范围、按地区 - 产业预测,2024-2031 年
 频谱仪市场:按类型、最终用户划分 - 2025-2030 年全球预测