


 |
市场调查报告书
商品编码
1687702
美国有机肥料:市场占有率分析、行业趋势和成长预测(2025-2030)United States Organic Fertilizer - Market Share Analysis, Industry Trends & Statistics, Growth Forecasts (2025 - 2030) |
||||||
※ 本网页内容可能与最新版本有所差异。详细情况请与我们联繫。
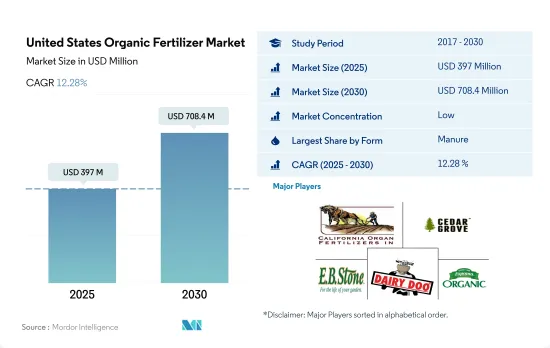
预计 2025 年美国有机肥料市场规模为 3.97 亿美元,到 2030 年将达到 7.084 亿美元,预测期内(2025-2030 年)的复合年增长率为 12.28%。
- 化肥是美国消费量最大的有机肥料,2022年占比最大,为46.7%。堆肥由分解的植物或动物物质,或粪便等植物或动物废弃物製成,一般富含有机质。由动物或植物废弃物製成的堆肥、农田堆肥和绿肥通常用于农业。
- 堆肥施用是有机农场和非有机农场的常见做法。众所周知,堆肥可以增加土壤中的有机质和碳含量,并增强作物对养分的吸收,进而提高粮食产量。
- 其他有机肥料包括鱼粪、蝙蝠粪、鱼乳剂、蚯蚓堆肥和糖蜜,这些肥料在 2021 年占 11.9%,是第二大消费量有机肥料。其他有机肥虽然营养丰富,但由于价格昂贵,使用量不如粪肥,在一定程度上阻碍了市场的发展。但随着农民经济状况的改善,需求可能会增加。
- 对餐食肥料的需求主要来自经过认证的有机生产商和正在转变为有机的农场。美国是世界上最大的牛肉生产国,2020 年约占 20.4%。这显示该国生产餐厨垃圾肥的空间很大,这使得有机农民更容易取得和使用这种肥料。
- 2022年美国油饼市场价值为210万美元,同年消费量为6,316.6吨。油饼含有丰富的有机养分,其中氮含量为2.0~8.0%,磷含量为0~2.0%,钾含量为0~2.0%。
美国有机肥料市场趋势
由于国家法规,有机种植面积,特别是连作作物的面积正在增加。
- 2021年,美国有机农业面积为62.3万公顷。过去二十年来,美国的有机农业取得了显着成长,这主要归功于具体法律法规的实施。 2021年加州有机农场和牧场数量为3061个,是美国获得认证的有机农场最多的州。宾州有超过 1,125 个经过认证的有机农场。 2019 年,有近 15,548,000 个经过认证的有机农场运作作物,有 7,139,000 个农场经营牧场和草场。包括苗圃和温室在内的作物销售额达到近 58 亿美元。
- 该国的有机农业以种植作物为主。 2021年,其占有机农地总面积的约71.8%。粮食生产是该国农业的主导产业。主要谷物有玉米、小麦、稻米、小米等。有机产品的消费在美国消费者中越来越流行,他们越来越多地选择有机食品,因为它们具有多种健康益处。
- 有机园艺作物的总种植面积正在增加,从 2017 年的 112,900 公顷增加到 2021 年的 156,100 公顷。就 2021 年国内产量而言,前五的水果和蔬菜是苹果(31.1%)、草莓(9.5%)、橘子(6.9%)、罗马生菜(6.7%)和马铃薯(6.2%)。在贸易方面,进口量最大的产品是香蕉(53.1%)、酪梨(7.7%)、芒果(5.8%)、蓝莓(5.0%)和南瓜(4.3%),出口量最大的产品是苹果(80.0%)、梨子(14.4%)、樱桃(4.0%)、洋葱干(1.5%)。
对有机农产品的需求不断增加,尤其是在水果和蔬菜领域,人均有机食品支出也在增加
- 美国是世界最大的有机产品消费国。根据《营养日誌杂誌》(NBJ,2021)通报,2020 年,中国有机食品总销售额达 516 亿美元。美国是北美地区人均有机产品支出最高的国家,2021年为186.7美元。
- 自有机食品零售业诞生以来,有机新鲜水果和蔬菜一直是主导的有机食品类别。 2020年,这些有机产品的零售额达到200亿美元,显示对有机农产品的需求不断成长。过去二十年来,对有机新鲜水果和蔬菜的需求稳定成长。有机食品销售的成长是由于消费者意识的增强,尤其是高所得族群。需求量最大的有机食品类别包括鸡蛋、乳製品、水果和蔬菜等主食。
- 不同人群和地区的人们对有机食品的偏好各不相同。 18-29 岁的年轻人比 65 岁以上的老年人更有可能想要有机产品(超过 50%)。收入和地区也起着一定的作用,42% 的收入低于 30,000 美元的人想要有机产品,而 49% 的收入超过 75,000 美元的人想要有机产品。
- 美国的人均有机产品支出正在增加,预计 2017 年至 2021 年的复合年增长率为 5.2%。对有机产品的需求不断增长,为美国有机生产商创造了机会,使其能够进入国内和国际高价值市场。有机产品的价格溢价是低收入消费者消费有机食品的主要限制因素之一。
美国有机肥产业概况
美国有机肥市场分散,前五大公司占21.10%的市占率。市场的主要企业有:California Organic Fertilizers Inc.、Cedar Grove Composting Inc.、EB Stone & Sons Inc.、Morgan Composting Inc. 和 The Espoma Company(按字母顺序排列)。
其他福利
- Excel 格式的市场预测 (ME) 表
- 3个月的分析师支持
目录
第一章执行摘要和主要发现
第二章 报告要约
第三章 引言
- 研究假设和市场定义
- 研究范围
- 调查方法
第四章 产业主要趋势
- 有机种植区
- 有机产品人均支出
- 法律规范
- 美国
- 价值炼和通路分析
第五章市场区隔
- 形式
- 肥料
- 餐食基肥料
- 油饼
- 其他有机肥料
- 作物类型
- 经济作物
- 园艺作物
- 田间作物
第六章竞争格局
- 重大策略倡议
- 市场占有率分析
- 商业状况
- 公司简介.
- Atlas Organics Inc.
- California Organic Fertilizers Inc.
- Cascade Agronomics LLC
- Cedar Grove Composting Inc.
- EB Stone & Sons Inc.
- Morgan Composting Inc.
- Sustane Natural Fertilizer Inc.
- The Espoma Company
- The Rich Lawn Company LLC
- Walts Organic Fertilizers Co.
第七章:CEO面临的关键策略问题
第 8 章 附录
- 世界概况
- 概述
- 五力分析框架
- 全球价值链分析
- 市场动态(DRO)
- 资讯来源及延伸阅读
- 图片列表
- 关键见解
- 资料包
- 词彙表
The United States Organic Fertilizer Market size is estimated at 397 million USD in 2025, and is expected to reach 708.4 million USD by 2030, growing at a CAGR of 12.28% during the forecast period (2025-2030).
- Manures are the most consumed organic fertilizer in the United States, accounting for a maximum share of 46.7% in 2022. Manures can be of plant or animal origin or a decomposed form of plant or animal waste like excreta, which is generally rich in organic matter. Animal or plant waste compost manure, farmyard manure, and green manure are the common types used in agriculture.
- The application of manure fertilizers is generally observed in organic and non-organic farms. It is known to increase organic matter and carbon content in the soil, which would increase the nutrient uptake of the crop and, thus, the grain yield.
- The other organic fertilizers include fish guano, bat guano, fish emulsion, vermicompost, and molasses and are the second most consumed organic fertilizers, accounting for a share of 11.9% in 2021. Despite the rich nutrient properties, other organic fertilizers are less commonly used than manures due to their higher prices, which is slightly hindering the market. However, the demand may increase with the increasing affordability of farmers.
- The demand for meal-based fertilizers majorly comes from certified organic growers and farms under organic conversion. The United States is the largest producer of beef in the world, which accounted for around 20.4% in 2020. This indicates the higher scope for meal-based fertilizer production in the country, leading to easy availability and accessibility for organic farmers.
- The United States oilcake market was valued at USD 2.1 million in 2022, with a volume consumption of 6,316.6 metric tons in the same year. Oilcake is a rich source of organic nutrients containing 2.0-8.0% nitrogen, 0-2.0% phosphorous, and 0-2.0% potassium content.
United States Organic Fertilizer Market Trends
Increase in organic area, particularly in row crops, due to country's laws and regulations
- In 2021, the area under organic agricultural farming in the United States was 623 thousand hectares. Organic agriculture in the United States has increased significantly in the previous 20 years, mostly due to the introduction of particular laws and regulations. The number of organic farms and ranches in California was 3,061 in 2021, the largest number of certified organic farms in the United States. There were over 1,125 certified organic farms in Pennsylvania. Nearly 15,548 thousand certified organic farms in operation used cropland in 2019, while 7,139 thousand farms operated pastureland and rangeland. The sales value of crops, including those from nurseries and greenhouses, amounted to nearly USD 5.8 billion.
- Row crops dominated organic farming in the nation. In 2021, they accounted for about 71.8% of all organic cropland. The production of cereal crops predominates the country's agricultural sector. The main cereals include maize, wheat, rice, and millet. The consumption of organic products has become popular among US consumers who increasingly choose to eat organic foods because of their various health benefits.
- There is an increasing trend in the overall organic horticultural crop cultivation area, from 112.9 thousand hectares in 2017 to 156.1 thousand hectares in 2021. Regarding domestic production in 2021, the top five fruits and vegetables were apples (31.1%), strawberries (9.5%), oranges (6.9%), romaine lettuce (6.7%), and potatoes (6.2%). In the case of trade, the most imported produce was bananas (53.1%), avocados (7.7%), mangoes (5.8%), blueberries (5.0%), and squashes (4.3%), while the most exported were apples (80.0%), pears (14.4%), cherries (4.0%), dried onions (1.5%), and potatoes (0.2%).
Growing demand for organic produce especially in the fruits and vegetables sector, rise in per capita spending on organic food
- The United States is one of the largest organic product consumers in the world. In 2020, the total sales of organic food products in the country accounted for USD 51.6 billion, according to the Nutrition Business Journal (NBJ, 2021). The United States had the largest per capita spending on organic products in the North American region, worth USD 186.7 in 2021.
- Organic fresh fruits and vegetables have been the leading categories of organic food since the establishment of the organic food retail industry. In 2020, retail sales for these organic products were valued at USD 20.0 billion, showing a growing demand for organic produce. The demand for organic fresh fruits and vegetables has steadily risen over the past two decades. Organic food sales are rising due to growing consumer awareness, especially among high-income consumers. The most in-demand organic categories include basic foods like eggs, dairy, fruits, and vegetables.
- Organic food preferences vary by demographic and region. Younger people aged between 18 and 29 are more likely to seek organic products (over 50%) compared to older people aged 65 and above. Income and region also play a role, with 42% of those with under USD 30,000 income and 49% of those with over USD 75.0 thousand seeking organic products.
- The per capita spending on organic products is increasing in the country, recording a projected CAGR of 5.2% between 2017 and 2021. The growing demand for organic products is creating opportunities for US organic producers to tap into high-value markets both domestically and abroad. The price premium associated with organic products is one of the major limiting factors for organic food consumption for low-income consumers.
United States Organic Fertilizer Industry Overview
The United States Organic Fertilizer Market is fragmented, with the top five companies occupying 21.10%. The major players in this market are California Organic Fertilizers Inc., Cedar Grove Composting Inc., EB Stone & Sons Inc., Morgan Composting Inc. and The Espoma Company (sorted alphabetically).
Additional Benefits:
- The market estimate (ME) sheet in Excel format
- 3 months of analyst support
TABLE OF CONTENTS
1 EXECUTIVE SUMMARY & KEY FINDINGS
2 REPORT OFFERS
3 INTRODUCTION
- 3.1 Study Assumptions & Market Definition
- 3.2 Scope of the Study
- 3.3 Research Methodology
4 KEY INDUSTRY TRENDS
- 4.1 Area Under Organic Cultivation
- 4.2 Per Capita Spending On Organic Products
- 4.3 Regulatory Framework
- 4.3.1 United States
- 4.4 Value Chain & Distribution Channel Analysis
5 MARKET SEGMENTATION (includes market size in Value in USD and Volume, Forecasts up to 2030 and analysis of growth prospects)
- 5.1 Form
- 5.1.1 Manure
- 5.1.2 Meal Based Fertilizers
- 5.1.3 Oilcakes
- 5.1.4 Other Organic Fertilizer
- 5.2 Crop Type
- 5.2.1 Cash Crops
- 5.2.2 Horticultural Crops
- 5.2.3 Row Crops
6 COMPETITIVE LANDSCAPE
- 6.1 Key Strategic Moves
- 6.2 Market Share Analysis
- 6.3 Company Landscape
- 6.4 Company Profiles (includes Global Level Overview, Market Level Overview, Core Business Segments, Financials, Headcount, Key Information, Market Rank, Market Share, Products and Services, and Analysis of Recent Developments).
- 6.4.1 Atlas Organics Inc.
- 6.4.2 California Organic Fertilizers Inc.
- 6.4.3 Cascade Agronomics LLC
- 6.4.4 Cedar Grove Composting Inc.
- 6.4.5 EB Stone & Sons Inc.
- 6.4.6 Morgan Composting Inc.
- 6.4.7 Sustane Natural Fertilizer Inc.
- 6.4.8 The Espoma Company
- 6.4.9 The Rich Lawn Company LLC
- 6.4.10 Walts Organic Fertilizers Co.
7 KEY STRATEGIC QUESTIONS FOR AGRICULTURAL BIOLOGICALS CEOS
8 APPENDIX
- 8.1 Global Overview
- 8.1.1 Overview
- 8.1.2 Porter's Five Forces Framework
- 8.1.3 Global Value Chain Analysis
- 8.1.4 Market Dynamics (DROs)
- 8.2 Sources & References
- 8.3 List of Tables & Figures
- 8.4 Primary Insights
- 8.5 Data Pack
- 8.6 Glossary of Terms
 富磷有机肥市场:依作物类型、形态、应用通路-2026-2032年全球预测
 全球有机农药市场规模、份额、趋势和成长分析报告(2026-2034年)
 全球有机农药市场,2025-2029年
 全球有机肥料市场,2026-2030年
 有机肥料:市场占有率分析、产业趋势与统计、成长预测(2026-2031)全球有机肥料市场:市场规模、份额、成长率、产业分析、按类型、应用和地区划分的分析、未来预测(2026-2034)
 有机肥料市场规模、份额和成长分析(按来源、作物类型、形态、应用方法和地区划分)-2026-2033年产业预测
 有机农药市场规模、份额和成长分析(按产品类型、品种、剂型、应用和地区划分)-2026-2033年产业预测
 全球有机肥市场:预测(至2032年)-按来源、形态、营养成分、作物类型、施用方法、最终用户和地区进行分析有机肥料市场(按最终用户、销售管道、配方、产品形式、供应来源和应用划分)—2025-2032 年全球预测