


 |
市场调查报告书
商品编码
1687789
合成石墨:市场占有率分析、行业趋势和统计数据、成长预测(2025-2030 年)Synthetic Graphite - Market Share Analysis, Industry Trends & Statistics, Growth Forecasts (2025 - 2030) |
||||||
※ 本网页内容可能与最新版本有所差异。详细情况请与我们联繫。
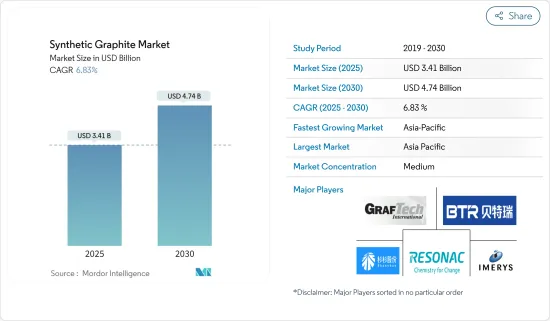
合成石墨市场规模预计在 2025 年达到 34.1 亿美元,预计到 2030 年将达到 47.4 亿美元,预测期内(2025-2030 年)的复合年增长率为 6.83%。
合成石墨市场因 COVID-19 而遭遇挫折。全球停工和严格的政府限制已迫使大面积製造工厂关闭。然而,预计市场将在 2021 年復苏,并在未来几年经历显着成长。
主要亮点
- 短期内,电动车需求的增加以及钢铁生产中电弧炉製程的使用日益增多是推动研究市场需求的关键因素。
- 然而,严格的环境法规和高昂的石墨生产成本预计将阻碍市场成长。
- 然而,石墨烯和生物石墨作为永续电池材料来源的日益普及预计将为该市场创造新的商机。
- 预计亚太地区将主导全球市场,其中中国和印度的需求将占据大部分市场份额。
合成石墨市场趋势
冶金领域占据市场主导地位
- 石墨在冶金学中有广泛的应用,包括电极、耐火材料、砖块和整体坩埚。
- 在电弧炉(EAF)製程中,人造石墨作为阳极来生产钢、铁合金和铝。
- 冶金应用利用合成石墨电极作为能源来源。这些应用包括熔化废钢、精製陶瓷材料和生产碳化钙等化学品,所有这些都需要高温、清洁能源来源。
- 全球粗钢和铝产量的增加将促进人造石墨的冶金应用。然而,金属产量的波动可能会为市场需求带来不确定性。
- 根据电流能力,合成石墨电极有多种等级:超高高功率(UHP)、高功率(HP)和常规功率(RP)。
- 根据世界钢铁协会(Worldsteel)的资料,预计2024年9月全球粗钢产量将从2024年8月的1.446亿吨下降至1.436亿吨。这些数据凸显了钢铁业面临的挑战,但同时,也受新兴国家基础建设计划推动,钢铁需求復苏即将到来。
- 此外,中国、美国等国家钢铁产能的扩张,也进一步拉动了全球钢铁产量。
- 采用电弧炉製程生产的钢材的需求正在大幅成长。电弧炉较低的产能强度和增强的弹性,加上转炉製程对环境的影响,预计将推动电弧炉在粗钢生产中的应用,尤其是在已开发国家。
- 中国是世界上最大的钢铁生产国,正在调整其钢铁生产策略以符合其脱碳目标。从2022年底到2024年,中国宣布运作约16座新的电弧炉,同时逐步淘汰老化的粗钢产能。透过此次推广,目标是到2025年将电弧炉炼钢比例提高到15-20%。
- 全球第四大粗钢生产美国公布,2024 年 9 月美国粗钢产量为 670 万吨,较 2023 年同期小幅成长 1.2%。但根据世界钢铁协会的数据,全年产量为 60.3 吨,下降 1.6%。
- 德国呈现正向趋势,预估2024年9月产量年增4.3%,达300万吨。根据世界钢铁协会的资料,德国全年产量达2,840万吨,显着增加4%。
- 2024 年 9 月产量为 2.8 吨,较 2023 年同期成长 9.9%。世界钢铁协会报告称,巴西全年产量增加 4.4%,达到 2,520 万吨。
- 钢铁用于许多不同的领域,包括建筑、铁路、汽车製造以及资本财和消费品的生产。过去十年,开发中国家工业化进程加快,大大刺激了钢铁需求。
- 鑑于这一发展轨迹,全球钢铁业的预期成长将推动对冶金应用的需求,并进一步推动所研究市场的扩张。
亚太地区占市场主导地位
- 亚太地区将引领人造石墨市场,并将成为预测期内成长最快的地区。这一成长主要得益于不断增长的需求,尤其是中国、印度、韩国、日本和东南亚国家对冶金、零件、电池和核能等各种应用的需求。
- 中国是世界领先的钢铁生产国,供应国内和国际市场。根据世界钢铁协会的资料,儘管中国仍保持最大生产国地位,但 2024 年 9 月产量下降 6.1%,至总合。全年数据显示,中国产量为 768.5 吨,较 2023 年下降 3.6%。
- 中国在全球合成石墨生产和消费领域仍占据主导地位。锂离子电池的整个製造链集中在中国,中国是锂离子电池最大、成长最快的市场,推动了人造石墨市场的扩张。
- 2023年中国锂离子电池产业维持上升趋势,总产量较去年与前一年同期比较成长25%。据工业和资讯化部称,产量超过 940 吉瓦时(GWh)。该产业的产值超过 1.4 兆元(1,970 亿美元),到 2023 年将具有巨大的产出。其中,储能电池新增装置容量185GWh,累计超过435GWh。
- 印度拥有几家着名的石墨电极製造商,这些製造商正在提高生产能力以满足不断增长的需求。这一趋势正在推动人造石墨市场的成长。例如,2023年11月,HEG有限公司将其在中央邦的石墨电极产能从每年8万吨扩大到每年10万吨。此次扩建耗资 1,200 亿印度卢比(143,741,000 美元),使 HEG 成为西半球第三大石墨电极公司。
- 此外,根据美国能源资讯署和核能总署(IAEA)的资料,过去十年,中国增加了超过34吉瓦(GW)的核能发电能力。截至2024年8月,中国营运56座核子反应炉,总合容量为54.3吉瓦。目前还有 27 座核子反应炉正在兴建中,这一成长势必会扩大对核能应用的需求并进一步推动市场扩张。
- 由于这些动态,预计预测期内亚太地区对人造石墨的需求将快速增长。
合成石墨产业概况
合成石墨市场部分整合。主要公司(排名不分先后)包括Resonac Holdings Corporation、GrafTech International、BTR New Material Group、宁波杉杉和Imerys。
其他福利:
- Excel 格式的市场预测 (ME) 表
- 3个月的分析师支持
目录
第一章 引言
- 调查前提条件
- 研究范围
第二章调查方法
第三章执行摘要
第四章 市场动态
- 驱动程式
- 电动车需求不断成长
- 扩大电弧炉製程在钢铁生产的应用
- 其他驱动因素
- 限制因素
- 严格的环境法规
- 石墨生产成本上升
- 其他阻碍因素
- 产业价值链分析
- 波特五力分析
- 供应商的议价能力
- 买家的议价能力
- 新进入者的威胁
- 替代品的威胁
- 竞争程度
第五章市场区隔
- 类型
- 石墨负极
- 石墨块(细碳)
- 其他类型(例如石墨电极)
- 应用
- 冶金
- 部分
- 电池
- 核能
- 其他用途
- 地区
- 亚太地区
- 中国
- 印度
- 日本
- 韩国
- 马来西亚
- 泰国
- 印尼
- 越南
- 其他亚太地区
- 北美洲
- 美国
- 加拿大
- 墨西哥
- 欧洲
- 德国
- 英国
- 法国
- 义大利
- 西班牙
- 北欧国家
- 土耳其
- 俄罗斯
- 其他欧洲国家
- 南美洲
- 巴西
- 阿根廷
- 哥伦比亚
- 南美洲其他地区
- 中东和非洲
- 沙乌地阿拉伯
- 卡达
- 阿拉伯聯合大公国
- 奈及利亚
- 埃及
- 南非
- 其他中东和非洲地区
- 亚太地区
第六章竞争格局
- 併购、合资、合作与协议
- 市场占有率(%)**/排名分析
- 主要企业策略
- 公司简介
- Asbury Carbons
- BTR New Materials Group Co. Ltd
- GrafTech International
- Graphit Kropfmhl GmbH
- Graphite India Limited
- Graphite One
- Imerys
- Jiangxi Zichen Technology Co. Ltd
- Mersen Property
- Mitsubishi Chemical Corporation
- Nippon Carbon Co. Ltd
- NOVONIX Limited
- Resonac Holdings Corporation
- Shamokin Carbons
- Shanghai Shanshan Technology Co. Ltd
- Shenzhen Sinuo Industrial Development Co. Ltd
- Tokai Cobex GmbH
第七章 市场机会与未来趋势
- 石墨烯日益普及
- 生物石墨作为永续电池材料来源
- 其他机会
The Synthetic Graphite Market size is estimated at USD 3.41 billion in 2025, and is expected to reach USD 4.74 billion by 2030, at a CAGR of 6.83% during the forecast period (2025-2030).
The synthetic graphite market faced setbacks due to COVID-19. Global lockdowns and stringent government regulations led to widespread shutdowns of production hubs. However, the market rebounded in 2021 and is projected to see significant growth in the upcoming years.
Key Highlights
- Over the short term, increasing demand for electric vehicles and growing utilization of electric arc furnace processes for steel production are the major factors driving the demand for the market studied.
- However, strict environmental regulations and the high cost of production of graphite are expected to hinder the market's growth.
- Nevertheless, the growing popularity of graphene and bio-graphite as a sustainable resource for battery material is expected to create new opportunities for the market studied.
- Asia-Pacific region is expected to dominate the market across the world, with the majority of demand coming from China and India.
Synthetic Graphite Market Trends
Metallurgy Segment to Dominate the Market
- Graphite finds diverse applications in metallurgy, including uses in electrodes, refractories, bricks, and monolithic crucibles.
- In the electric arc furnace (EAF) method, synthetic graphite serves as an anode for producing steel, ferroalloys, and aluminum.
- Metallurgical applications utilize synthetic graphite electrodes as energy sources. These applications range from melting scrap iron and refining ceramic materials to manufacturing chemicals like calcium carbide, all of which demand high-temperature and clean energy sources.
- Global increases in crude steel and aluminum production are set to boost synthetic graphite's metallurgical applications. Yet, fluctuations in metal production may introduce uncertainties in market demand.
- Based on electric current capability, synthetic graphite electrodes come in various grades: ultra-high power (UHP), high power (HP), and regular power (RP).
- According to data from the World Steel Association (worldsteel), global crude steel production fell to 143.6 million tonnes (Mt) in September 2024, down from 144.6 million tonnes (Mt) in August 2024. While these figures underscore challenges in the industry, a rebound in steel demand is on the horizon, driven by infrastructure projects in emerging economies.
- Moreover, bolstered steel production capacities in nations like China and the United States, among others have further fueled global steel output.
- The demand for steel produced via the EAF process is growing significantly. EAFs' lower capacity intensity and enhanced resilience, along with the environmental impact of the BOF method, are anticipated to drive the adoption of EAFs in crude steel production, particularly in developed nations.
- China, the world's largest steel producer, is aligning its steelmaking strategy with decarbonization goals. Between late 2022 and 2024, China announced the commissioning of around 16 new EAFs, coinciding with the phasing out of outdated crude steelmaking facilities. This push aims to raise the proportion of EAF-based steel output to 15-20% by 2025.
- The United States, ranked as the fourth-largest producer of crude steel globally, reported a production of 6.7 Mt in September 2024, witnessing a modest increase of 1.2% as compared to the same period of 2023. However, the year-to-date production figures were at 60.3 Mt, indicating a decline of 1.6%, as per the World Steel Association.
- Germany showcased a positive trend, producing an estimated 3 Mt in September 2024, which is a 4.3% increase as compared to the samer peroiod of the previous year. Year-to-date, Germany's production reached 28.4 Mt, marking a notable 4% rise, according to data from the World Steel Association.
- Brazil led the pack with the highest growth, producing 2.8 Mt in September 2024, an impressive increase of 9.9% as compared to the same period of 2023. Year-to-date, Brazil's production stood at 25.2 Mt, up by 4.4%, as reported by the World Steel Association.
- Steel finds applications in diverse sectors, including construction, railroads, automotive manufacturing, and both capital and consumer goods production. Over the past decade, rising industrialization in developing nations has significantly spurred the demand for steel.
- Given this trajectory, the anticipated growth in the global steel sector is poised to elevate demand in metallurgical applications, further propelling the studied market's expansion.
Asia-Pacific Region to Dominate the Market
- Asia-Pacific is set to spearhead the synthetic graphite market, emerging as the region with the swiftest growth during the forecast period. This upswing is largely driven by surging demands across diverse applications, such as metallurgy, components, batteries, and nuclear energy, especially in countries like China, India, South Korea, Japan, and several Southeast Asian nations.
- China stands as the globe's leading producer of iron and steel, with its output serving both domestic and international markets. As per the data from the World Steel Association, while China retained its title as the largest producer, it saw a 6.1% dip in output for September 2024, totaling 77.1 million tonnes (Mt). Year-to-date figures show China's production at 768.5 Mt, reflecting a 3.6% drop from 2023.
- China remains the dominant force in both the production and consumption of synthetic graphite on a global scale. The entire lithium-ion battery manufacturing chain is heavily centered in China, which stands out as the largest and fastest-growing market for these batteries, consequently driving the expansion of the synthetic graphite market.
- In 2023, China's lithium-ion battery sector maintained its upward trajectory, witnessing a 25% year-on-year increase in total output. According to the Ministry of Industry and Information Technology, the output surpassed 940 gigawatt-hours (GWh). Valued at over CNY 1.4 trillion (USD 197 billion), the sector's output in 2023 was significant. Notably, batteries designated for power storage accounted for 185 GWh, with an installed capacity exceeding 435 GWh.
- India is home to several prominent graphite electrode manufacturers, all of whom are ramping up their capacities to cater to the burgeoning demand. This trend is bolstering the growth of the synthetic graphite market. For instance, HEG Limited, in November 2023, augmented its graphite electrode capacity in Madhya Pradesh from 80 kilotons per annum to 100 kilotons per annum. This expansion, costing INR 1,200 crore (USD 143.741 million), catapulted HEG to the position of the third-largest graphite electrode company in the Western hemisphere.
- Furthermore, data from the U.S. Energy Information Administration and the International Atomic Energy Agency reveals that over the last decade, China has added more than 34 gigawatts (GW) of nuclear power capacity. As of August 2024, the nation operates 56 nuclear reactors with a combined net capacity of 54.3 GW. With an additional 27 reactors currently under construction, this growth is poised to amplify the demand for nuclear applications, further propelling the market's expansion.
- Given these dynamics, the Asia-Pacific region is poised for a surge in synthetic graphite demand during the forecast period.
Synthetic Graphite Industry Overview
The synthetic graphite market is partially consolidated in nature. The major players (not in any particular order) include Resonac Holdings Corporation, GrafTech International, BTR New Material Group Co. Ltd, Ningbo Shanshan Co., Ltd., and Imerys, among others.
Additional Benefits:
- The market estimate (ME) sheet in Excel format
- 3 months of analyst support
TABLE OF CONTENTS
1 INTRODUCTION
- 1.1 Study Assumptions
- 1.2 Scope of the Study
2 RESEARCH METHODOLOGY
3 EXECUTIVE SUMMARY
4 MARKET DYNAMICS
- 4.1 Drivers
- 4.1.1 Increasing Demand for Electric Vehicles
- 4.1.2 Growing Utilization of Electric ARC Furnace Process for Steel Production
- 4.1.3 Other Drivers
- 4.2 Restraints
- 4.2.1 Strict Environmental Regulations
- 4.2.2 High Cost of Production of Graphite
- 4.2.3 Other Restraints
- 4.3 Industry Value Chain Analysis
- 4.4 Porter's Five Forces Analysis
- 4.4.1 Bargaining Power of Suppliers
- 4.4.2 Bargaining Power of Buyers
- 4.4.3 Threat of New Entrants
- 4.4.4 Threat of Substitute Products and Services
- 4.4.5 Degree of Competition
5 MARKET SEGMENTATION (Market Size in Value)
- 5.1 Type
- 5.1.1 Graphite Anode
- 5.1.2 Graphite Block (Fine Carbon)
- 5.1.3 Other Types (Graphite Electrode, etc.)
- 5.2 Application
- 5.2.1 Metallurgy
- 5.2.2 Parts and Components
- 5.2.3 Batteries
- 5.2.4 Nuclear
- 5.2.5 Other Applications
- 5.3 Geography
- 5.3.1 Asia-Pacific
- 5.3.1.1 China
- 5.3.1.2 India
- 5.3.1.3 Japan
- 5.3.1.4 South Korea
- 5.3.1.5 Malaysia
- 5.3.1.6 Thailand
- 5.3.1.7 Indonesia
- 5.3.1.8 Vietnam
- 5.3.1.9 Rest of Asia-Pacific
- 5.3.2 North America
- 5.3.2.1 United States
- 5.3.2.2 Canada
- 5.3.2.3 Mexico
- 5.3.3 Europe
- 5.3.3.1 Germany
- 5.3.3.2 United Kingdom
- 5.3.3.3 France
- 5.3.3.4 Italy
- 5.3.3.5 Spain
- 5.3.3.6 NORDIC Countries
- 5.3.3.7 Turkey
- 5.3.3.8 Russia
- 5.3.3.9 Rest of Europe
- 5.3.4 South America
- 5.3.4.1 Brazil
- 5.3.4.2 Argentina
- 5.3.4.3 Colombia
- 5.3.4.4 Rest of South America
- 5.3.5 Middle East and Africa
- 5.3.5.1 Saudi Arabia
- 5.3.5.2 Qatar
- 5.3.5.3 United Arab Emirates
- 5.3.5.4 Nigeria
- 5.3.5.5 Egypt
- 5.3.5.6 South Africa
- 5.3.5.7 Rest of Middle-East and Africa
- 5.3.1 Asia-Pacific
6 COMPETITIVE LANDSCAPE
- 6.1 Mergers and Acquisitions, Joint Ventures, Collaborations, and Agreements
- 6.2 Market Share(%)**/Ranking Analysis
- 6.3 Strategies Adopted by Major Players
- 6.4 Company Profiles
- 6.4.1 Asbury Carbons
- 6.4.2 BTR New Materials Group Co. Ltd
- 6.4.3 GrafTech International
- 6.4.4 Graphit Kropfmhl GmbH
- 6.4.5 Graphite India Limited
- 6.4.6 Graphite One
- 6.4.7 Imerys
- 6.4.8 Jiangxi Zichen Technology Co. Ltd
- 6.4.9 Mersen Property
- 6.4.10 Mitsubishi Chemical Corporation
- 6.4.11 Nippon Carbon Co. Ltd
- 6.4.12 NOVONIX Limited
- 6.4.13 Resonac Holdings Corporation
- 6.4.14 Shamokin Carbons
- 6.4.15 Shanghai Shanshan Technology Co. Ltd
- 6.4.16 Shenzhen Sinuo Industrial Development Co. Ltd
- 6.4.17 Tokai Cobex GmbH
7 MARKET OPPORTUNITIES AND FUTURE TRENDS
- 7.1 Growing Popularity of Graphene
- 7.2 Bio-graphite as a Sustainable Resource for Battery Material
- 7.3 Other Opportunities
 2025年全球合成石墨材料市场报告
 合成石墨市场规模、份额、趋势分析报告:按产品、应用、地区、细分市场预测,2025-2030 年
 人造石墨市场,规模,占有率,趋势,产业分析报告:各产品,各用途,各地区,2025年~2034年的市场预测
 合成石墨市场规模、份额、成长分析(按产品、应用、等级、最终用户、地区)- 2025-2032 年产业预测
 2025-2029年全球合成石墨市场
 全球合成石墨市场规模(按产品类型、最终用户产业、应用、区域范围和预测)全球合成石墨市场研究报告 - 产业分析、规模、份额、成长、趋势和预测 2025 年至 2033 年全球合成石墨市场:预测(2025-2030)全球合成石墨市场
 人造石墨的全球市场:洞察与预测(~2030年)