


 |
市场调查报告书
商品编码
1687869
捕碳封存:市场占有率分析、行业趋势和统计、成长预测(2025-2030 年)Carbon Capture And Storage - Market Share Analysis, Industry Trends & Statistics, Growth Forecasts (2025 - 2030) |
||||||
价格
※ 本网页内容可能与最新版本有所差异。详细情况请与我们联繫。
简介目录
2025 年捕碳封存市场规模预估为 27.6 亿美元,预计到 2030 年将达到 53.7 亿美元,预测期内(2025-2030 年)的复合年增长率为 14.21%。
主要亮点
- 推动捕碳封存市场的主要因素是提高采收率(EOR)对二氧化碳注入技术的需求增加,以及政府对温室气体排放的严格监管。
- 另一方面,引入CCS技术的巨额成本和增加页岩投资预计将阻碍市场成长。
- 人们对生质能源捕碳封存(BECCS)的兴趣日益浓厚,这可能是未来的一个机会。
- 北美可能会主导市场,并预计在预测期内保持其主导地位,这主要是由于美国和加拿大的技术采用率不断提高。
捕碳封存市场趋势
石油和天然气领域占市场主导地位
- 储存在陆地或海上深层地质构造中的二氧化碳将被利用,并利用石油和天然气行业开发的 CCS 技术来提高石油采收率。
- 二氧化碳在石油工业中被广泛用于提高采收率(EOR)。当二氧化碳注入油田时,它会与原油混合併膨胀,从而降低原油的黏度并维持或增加油藏内的压力。这些过程的结合使得更多的石油流入生产井。
- 在其他情况下,二氧化碳不溶于油。在这种情况下,注入二氧化碳会增加储存的压力,使石油被冲向生产井。
- 二氧化碳在美国德克萨斯州的提高采收率作业中已有30多年的历史。提高石油采收率(EOR)占石油总产量的20%以上,有些油田的采收率接近70%。
- 此外,作为永续的一部分,石油和天然气产业正在向碳捕获和封存技术发展。
- 根据国际能源总署(IEA)的数据,到2022年,全球石油和天然气能源相关的二氧化碳排放将增加2.5%至2.68亿吨,达到11.2亿吨以上。
- 能源燃烧、洩漏和排放产生的甲烷占另外 10%,主要来自陆上石油和天然气作业以及蒸气生产。儘管天然气价格上涨使得甲烷减量技术更具成本效益,但到 2022 年,甲烷排放仍将增加到约 1.35 亿吨甲烷和约 40 亿吨二氧化碳当量。
- 因此,印度公共石油和天然气公司正积极采用碳捕获、利用和储存(CCUS) 等排放策略,以实现印度到 2070 年实现净零排放的目标。
北美可能主导市场
- 北美在全球捕碳封存市场占据主导地位。由于二氧化碳在 EOR 中的使用不断增加,对干净科技的需求不断增加,从而推动了美国和加拿大等国家的 CCS 市场的发展。
- 化学品生产、氢气生产、肥料生产、天然气加工和发电是美国捕获和注入二氧化碳的产业之一。这些设施将捕获并注入二氧化碳,储存在地质构造中,或用于提高老化油田的石油产量。
- 根据美国预算办公室的数据,截至 2023 年,美国将运作大约 15 个 CCS 设施投入运营,主要位于加工天然气或生产燃料乙醇或肥料氨的工厂。
- 这15座设施每年将可捕获约2,200万吨二氧化碳,相当于美国年度二氧化碳排放总量的约0.4%。此外,美国有 121 个 CCS 设施正在建设或开发中,总合为每年捕获 1.34 亿吨二氧化碳。
- 根据国际能源总署的数据,在2023年运作中的2,200万吨/年的CCS产能中,天然气加工/液化天然气将占总量的约60%,即1,310万吨/年,其次是燃料转换,约占18%,即390万吨/年。
- 美国政府在《基础建设投资与就业法案》(IIJA)下已拨款121亿美元用于碳管理技术,其中25.4亿美元将用于2022年至2025年的捕碳封存(CCS)示范计划。
- 加拿大拥有丰富的煤炭、石油和天然气蕴藏量,因此加拿大领先的清洁能源研究和技术组织CanmetENERGY正在探索如何将目前占加拿大能源供应很大一部分的石化燃料燃烧技术对环境的影响降至最低。一种选择是捕碳封存(CCS)。
- 根据《联合国气候变迁纲要公约》,加拿大同意在 2030 年将排放在 2005 年的基础上减少 30%,即每年减少约 2 亿吨二氧化碳。加拿大的四个主要 CCS计划(两个运作,两个正在开发中)的总合高达 640 万吨/年,相当于实现 2030 年目标所需减排量的 3%。
捕碳封存产业概况
捕碳封存市场本质上是一体化的。市场上主要企业(不分先后顺序)包括西方石油公司、埃克森美孚公司、达科他气化公司、壳牌公司和液化空气集团。
其他福利:
- Excel 格式的市场预测 (ME) 表
- 3 个月的分析师支持
目录
第 1 章 简介
- 调查前提条件
- 研究范围
第二章调查方法
第三章执行摘要
第四章 市场动态
- 市场驱动因素
- 提高采收率(EOR) 对二氧化碳注入技术的需求不断增长
- 政府对温室气体排放制定严格的标准
- 市场限制
- 引入CCS技术成本庞大
- 增加对页岩层的投资
- 产业价值链分析
- 波特五力分析
- 供应商的议价能力
- 消费者议价能力
- 新进入者的威胁
- 替代品的威胁
- 竞争程度
第五章 市场区隔
- 依技术分类
- 燃烧前捕获
- 富氧燃料回收
- 燃烧后回收
- 按最终用户产业
- 石油和天然气
- 煤炭和生质能发电厂
- 钢
- 化学
- 水泥
- 按地区
- 亚太地区
- 中国
- 印度
- 日本
- 澳洲
- 其他亚太地区
- 北美洲
- 美国
- 加拿大
- 墨西哥
- 欧洲
- 德国
- 英国
- 法国
- 挪威
- 荷兰
- 其他欧洲国家
- 世界其他地区
- 亚太地区
第六章 竞争格局
- 合併、收购、合资、合作和协议
- 市场排名分析
- 主要企业策略
- 公司简介
- Air Liquide
- Aker Solutions
- Baker Hughes Company
- Dakota Gasification Company
- Exxon Mobil Corporation
- Fluor Corporation
- General Electric
- Halliburton
- Honeywell International Inc.
- Japan CCS Co. Ltd
- JX Nippon Oil & Gas Exploration Corporation
- Linde PLC
- Mitsubishi Heavy Industries Ltd
- Occidental Petroleum Corporation
- Shell PLC
- Siemens Energy
- SLB
第七章 市场机会与未来趋势
- 生质能源捕碳封存(BECCS)日益受到关注
简介目录
Product Code: 66575
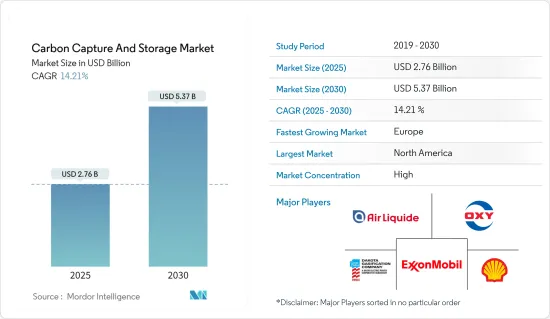
The Carbon Capture And Storage Market size is estimated at USD 2.76 billion in 2025, and is expected to reach USD 5.37 billion by 2030, at a CAGR of 14.21% during the forecast period (2025-2030).
Key Highlights
- The major factors driving the carbon capture and storage market are the emerging demand for CO2 injection techniques for enhanced oil recovery (EOR) and strict government norms toward GHG emissions.
- On the flip side, huge CCS technology implementation costs and increases in shale investments are expected to hinder the market's growth.
- Augmenting prominence for bioenergy carbon capture and storage (BECCS) is likely to be an opportunity in the future.
- North America is likely to dominate the market, and it is expected to remain in a dominant position over the forecast period, owing to the increasing implementation of technology, mainly in the United States and Canada.
Carbon Capture And Storage Market Trends
Oil and Gas Segment to Dominate the Market
- Carbon dioxide stored in deep, onshore, or offshore geological formations uses CCS technologies for enhanced oil recovery that have been developed in the oil and gas industry.
- Carbon dioxide is extensively used in the oil industry for enhanced oil recovery (EOR) from mature oilfields. When carbon dioxide is inserted into an oilfield, it can mix with the crude oil, triggering it to swell and drop its viscosity, helping to maintain or raise the pressure in the reservoir. The combination of these processes permits more crude oil to flow to the production wells.
- In other circumstances, the carbon dioxide is not soluble in the oil. Here, the injection of carbon dioxide raises the pressure in the reservoir, helping to sweep the oil toward the production well.
- For more than three decades in Texas (United States), carbon dioxide has been used in enhanced oil recovery projects. EOR constitutes over 20% of total oil production, and some fields achieve recoveries of nearly 70%.
- Moreover, as part of sustainable development, the oil and gas industry is moving toward carbon capturing and storage technologies.
- According to the International Energy Agency (IEA), global energy-related CO2 emissions from oil and gas grew by 2.5% or 268 million tons (Mt) in 2022, reaching over 11.2 gigatons (Gt).
- Methane from energy combustion, leaks, and venting represented another 10%, mostly from onshore oil and gas operations and steam coal production. Methane emissions rose to nearly 135 Mt CH4 or around 4 Gt CO2-eq in 2022 despite high natural gas prices that increased the cost-effectiveness of methane abatement technologies.
- Therefore, public sector oil and gas companies in India are actively embracing emission-reduction strategies such as Carbon Capture, Utilization, and Storage (CCUS) as India targets net zero by 2070.
North America is Likely to Dominate the Market
- North America dominates the global carbon capture and storage market. The growing demand for clean technology, accompanied by the growing use of CO2 in EOR practices, is likely to drive the CCS market in countries like the United States and Canada.
- Chemical production, hydrogen production, fertilizer production, natural gas processing, and power generation are among the industries in the United States where CO2 is captured and injected. These facilities capture and inject CO2 to store it underground in geologic formations or to use it to boost oil production from aging oil fields, a process known as enhanced oil recovery (EOR).
- According to the Congressional Budget Office of the federal government of the United States, as of 2023, the country has about 15 operating CCS facilities, with the majority of these located at plants that process natural gas or produce ethanol for fuel or ammonia for fertilizer.
- These 15 facilities can capture about 22 million metric tons of CO2 per year, which is about 0.4% of the total annual CO2 emissions in the United States. Furthermore, the country has about 121 under-construction or being-developed CCS facilities with a combined capacity of 134 million tons of CO2 per year.
- According to IEA, in 2023, out of the operational 22 million metric tons of CO2 per year capacity of CCS, natural gas processing/LNG accounted for the largest share of about 60% of the total capacity and was valued at 13.1 million metric tons of CO2 per year, followed by fuel transformation with a share of about 18% and capacity of 3.9 million metric tons of CO2 per year.
- Under the Infrastructure Investments and Jobs Act (IIJA), the US government allocated USD 12.1 billion for carbon management technologies, of which USD 2.54 billion is appropriated for carbon capture and storage (CCS) demonstration projects from 2022 to 2025.
- As Canada has a rich supply of coal, oil reserves, and natural gas, CanmetENERGY, Canada's leading research and technology organization in the field of clean energy, is finding ways to minimize the environmental impact of fossil fuel combustion technologies, which currently comprise a substantial portion of the Canadian energy supply. One of the options is carbon capture and storage (CCS).
- Canada has agreed to reduce emissions by 30% below 2005 levels by 2030, or approximately 200 million tonnes of carbon dioxide per year, under the UN Framework Convention on Climate Change. The combined capacity of the four major CCS projects in Canada (two operational and two in development) will be up to 6.4 Mtpa, representing 3% of the reduction needed to meet the 2030 target.
Carbon Capture And Storage Industry Overview
The carbon capture and storage market is consolidated in nature. The major players in the market (not in a particular order) include Occidental Petroleum Corporation, Exxon Mobil Corporation, Dakota Gasification Company, Shell PLC, and Air Liquide, among others.
Additional Benefits:
- The market estimate (ME) sheet in Excel format
- 3 months of analyst support
TABLE OF CONTENTS
1 INTRODUCTION
- 1.1 Study Assumptions
- 1.2 Scope of the Study
2 RESEARCH METHODOLOGY
3 EXECUTIVE SUMMARY
4 MARKET DYNAMICS
- 4.1 Market Drivers
- 4.1.1 Emerging Demand for CO2 Injection Technique for Enhanced Oil Recovery (EOR)
- 4.1.2 Strict Government Norms Toward GHG Emissions
- 4.2 Market Restraints
- 4.2.1 Huge CCS Technology Implementation Costs
- 4.2.2 Growth in Shale Investments
- 4.3 Industry Value Chain Analysis
- 4.4 Porter's Five Forces Analysis
- 4.4.1 Bargaining Power of Suppliers
- 4.4.2 Bargaining Power of Consumers
- 4.4.3 Threat of New Entrants
- 4.4.4 Threat of Substitute Products and Services
- 4.4.5 Degree of Competition
5 MARKET SEGMENTATION (Market Size in Value)
- 5.1 By Technology
- 5.1.1 Pre-combustion Capture
- 5.1.2 Oxy-fuel Combustion Capture
- 5.1.3 Post-combustion Capture
- 5.2 By End-user Industry
- 5.2.1 Oil and Gas
- 5.2.2 Coal and Biomass Power Plant
- 5.2.3 Iron and Steel
- 5.2.4 Chemical
- 5.2.5 Cement
- 5.3 By Geography
- 5.3.1 Asia-Pacific
- 5.3.1.1 China
- 5.3.1.2 India
- 5.3.1.3 Japan
- 5.3.1.4 Australia
- 5.3.1.5 Rest of Asia-Pacific
- 5.3.2 North America
- 5.3.2.1 United States
- 5.3.2.2 Canada
- 5.3.2.3 Mexico
- 5.3.3 Europe
- 5.3.3.1 Germany
- 5.3.3.2 United Kingdom
- 5.3.3.3 France
- 5.3.3.4 Norway
- 5.3.3.5 Netherlands
- 5.3.3.6 Rest of Europe
- 5.3.4 Rest of the World
- 5.3.1 Asia-Pacific
6 COMPETITIVE LANDSCAPE
- 6.1 Mergers, Acquisitions, Joint Ventures, Collaborations, and Agreements
- 6.2 Market Ranking Analysis
- 6.3 Strategies Adopted by Leading Players
- 6.4 Company Profiles
- 6.4.1 Air Liquide
- 6.4.2 Aker Solutions
- 6.4.3 Baker Hughes Company
- 6.4.4 Dakota Gasification Company
- 6.4.5 Exxon Mobil Corporation
- 6.4.6 Fluor Corporation
- 6.4.7 General Electric
- 6.4.8 Halliburton
- 6.4.9 Honeywell International Inc.
- 6.4.10 Japan CCS Co. Ltd
- 6.4.11 JX Nippon Oil & Gas Exploration Corporation
- 6.4.12 Linde PLC
- 6.4.13 Mitsubishi Heavy Industries Ltd
- 6.4.14 Occidental Petroleum Corporation
- 6.4.15 Shell PLC
- 6.4.16 Siemens Energy
- 6.4.17 SLB
7 MARKET OPPORTUNITIES AND FUTURE TRENDS
- 7.1 Augmenting Prominence for Bioenergy Carbon Capture and Storage (BECCS)
02-2729-4219
+886-2-2729-4219
 CCUS吸收的全球市场(~2035年):各吸收类型,各吸收阶段类型,各部署类型,各用途类型,各终端用户,各地区,产业趋势,预测
 CCUS吸收市场分析及2034年预测:类型、产品、服务、技术、组件、应用、流程、最终用户、能力、解决方案
 碳捕获与封存市场(按应用、捕获技术、来源产业和储存选项)—全球预测 2025-2032
 2025年碳捕获、利用与储存全球市场报告
 碳捕获、利用和储存市场(按服务、技术、最终用途产业和地区划分)-预测至2030年CCUS吸收市场预测至2032年:按吸收机制、二氧化碳排放源、部署阶段、经济层级、环境影响、技术类型、应用、最终用户和地区进行的全球分析碳捕获、利用和储存(CCUS) 市场预测(至 2032 年):按服务、储存类型、用途、技术、最终用户和地区进行的全球分析
 碳回收·利用·储存(CCUS)的全球市场(2026年~2046年)捕碳封存市场(按服务、技术、最终用途产业及储存类型)-2025-2030 年全球预测全球发电捕碳封存市场
▼