


 |
市场调查报告书
商品编码
1689898
活性漂白土:市场占有率分析、产业趋势与统计、成长预测(2025-2030 年)Activated Bleaching Earth - Market Share Analysis, Industry Trends & Statistics, Growth Forecasts (2025 - 2030) |
||||||
※ 本网页内容可能与最新版本有所差异。详细情况请与我们联繫。
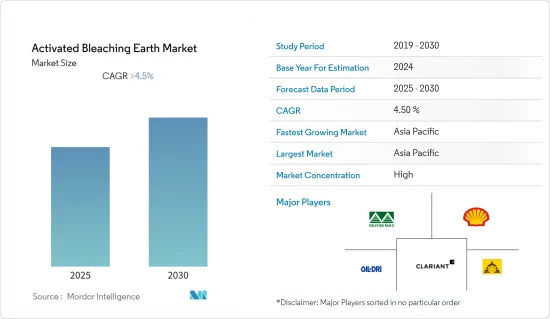
预计预测期内活性漂白土市场将以超过 4.5% 的复合年增长率成长。
COVID-19 对活性漂白土市场产生了负面影响。全球封锁和严格的政府规定导致大多数生产基地关闭,造成了毁灭性的打击。儘管如此,自 2021 年以来业务一直在復苏,预计未来几年将大幅成长。
主要亮点
- 市场成长的主要因素是食用油脂需求的增加。
- 然而,替代产品和技术的存在阻碍了市场成长。
- 预计未来几年生物柴油产量的增加将为市场参与者提供丰厚的成长机会。
- 亚太地区占据全球市场主导地位,其中中国、印度和日本等国家占最大的消费量。
活性漂白土市场趋势
食用油脂需求不断成长
- 活性漂白土用于精製食用油、废弃烹饪油(UCO)、污泥油、酸性油和其他废油,以生产生质柴油和可再生柴油。广泛用于食用油脂的精製、脱色、漂白。
- 活性漂白土比天然漂白土具有更高的吸附杂质的能力。
- 它用于精製各种食用油脂,包括大豆油、棉籽油、棕榈油、菜籽油、葵花籽油、红花油、芥花籽油、菜籽油、橄榄油和芝麻油。
- 2022/23年度全球棕榈油产量预计将达到7,722万吨,高于2021/22年度的7,383万吨。
- 2022/23年度全球豆油产量预估为6,149.4万吨,较2021/22年度的5,925.9万吨成长3.0%。
- 全球整体菜籽油产量从2021/22年度的2,907万吨增加到2022/23年度的3,180万吨。
- 2022/23年度全球葵花油产量将达2,036万吨,高于2021/22年度的1,984万吨。
- 2022/23年度全球棉籽油产量将达502万吨,高于2021/22年度的497万吨。
- 然而,由于包括欧洲和南美洲主要生产国在内的多个国家的干旱加剧,橄榄油产量有所下降。 2022/23年度全球橄榄油产量将为282万吨,低于2021/22年度的327万吨。
- 因此,食用油脂产量的增加和活性漂白土需求的激增预计将为全球市场创造成长机会。
亚太地区占市场主导地位
- 预计亚太地区将占据活性漂白土市场的最大份额。中国是亚太地区植物油消费量和产量最大的国家。虽然产量很高,消费量超过产量,导致进口量大于出口量。
- 根据国际油脂协会预测,2021-22年度中国食用油产量将为2800万吨,较上年的2815万吨减少15万吨。产量下降是由于油籽进口量减少和食用植物油产量下降。
- 根据中国政府报告,2022年7月中国棕榈油和大豆油进口量分别下降30万吨和17万吨,而上年度量分别为370万吨和63万吨。
- 据印度植物油生产者协会(IVPA)称,本财年(2022年10月至2023年9月),印度进口了约1,437万吨植物油。这较上年的1407万吨进口量大幅增加。
- 根据国际能源总署(IEA)的数据,石油仍然是韩国能源供应总量中最重要的能源来源。韩国精製工业十分发达,除石化原料外,大多数产品都能自给自足。
- 此外,根据加拿大农业和农业食品部 (AAFC) 的报告,2021 年加拿大食用油零售总额为 4.787 亿美元。预计到2026年,食用油销售额将达到5,223亿美元。同时,预计到2026年,食用油消费量将达到近100万吨。
- 根据内务部统计,2021年3月至2023年1月期间,植物油零售价格上涨了67%,远超过大多数其他主食的价格涨幅。
- 此外,2023年7月国内大豆进口额从2023年6月的1.9005亿美元增加至2.1398亿美元。大豆油出口额为1700万美元,进口额为243万美元,导致贸易逆差。
- 因此,由于上述原因,预计亚太地区将在预测期内占据市场主导地位。
活性漂白土产业概况
活性漂白土市场本质上是分散的。市场的主要企业(不分先后顺序)包括科莱恩、春金集团、壳牌、美国石油钻探公司和 Ashapura Perfoclay Limited。
其他福利
- Excel 格式的市场预测 (ME) 表
- 3个月的分析师支持
目录
第一章 引言
- 调查前提条件
- 研究范围
第二章调查方法
第三章执行摘要
第四章 市场动态
- 驱动程式
- 食用油需求不断增加
- 限制因素
- 存在替代产品和技术
- 产业价值链分析
- 波特五力分析
- 供应商的议价能力
- 消费者议价能力
- 新进入者的威胁
- 替代品的威胁
- 竞争程度
第五章市场区隔
- 按应用
- 食用油脂
- 矿物油和润滑剂
- 其他(化学品、生质柴油等)
- 按地区
- 亚太地区
- 中国
- 印度
- 日本
- 韩国
- 其他亚太地区
- 北美洲
- 美国
- 加拿大
- 墨西哥
- 欧洲
- 德国
- 英国
- 义大利
- 法国
- 其他欧洲国家
- 南美洲
- 巴西
- 阿根廷
- 南美洲其他地区
- 中东和非洲
- 沙乌地阿拉伯
- 南非
- 其他中东和非洲地区
- 亚太地区
第六章 竞争格局
- 併购、合资、合作与协议
- 市场排名分析
- 主要企业策略
- 公司简介
- Ashapura Perfoclay Limited(APL)
- Clariant
- Global Bleach Chem Pvt. Ltd
- Hrp Industries
- Indian Clay And Mineral Co.
- Musim Mas Holdings Pte Ltd
- Oil-dri Corporation of America
- Phoenix Chemicals(Pvt.)Ltd
- Refoil Earth Pvt. Ltd
- Shell Plc(ecooils Limited)
- Taiko Group of Companies(Taiko Bleaching Earth Sdn. Bhd.)
- The W Clay Industries Sdn Bhd
第七章 市场机会与未来趋势
- 提高生质柴油产量
The Activated Bleaching Earth Market is expected to register a CAGR of greater than 4.5% during the forecast period.
COVID-19 had a negative impact on the activated bleaching earth sector. Global lockdowns and severe rules enforced by governments resulted in a catastrophic setback as most production hubs were shut down. Nonetheless, the business has been recovering since 2021 and is expected to rise significantly in the coming years.
Key Highlights
- The major factor driving the market growth is the growing demand for edible oils.
- However, the presence of alternative products and technologies is hindering the market growth.
- Increasing production of bio-diesel is expected to provide lucrative growth opportunities to the market players in the coming years.
- The Asia-Pacific region dominates the global market, with the largest consumption from countries such as China, India, and Japan.
Activated Bleaching Earth Market Trends
Increasing Demand for Edible Oil & Fats
- Activated bleaching earth is used to purify edible oils, used cooking oil (UCO), sludge oils, acid oils, and other waste oils that are utilized in the manufacture of biodiesel and renewable diesel. It is widely used in the refining, decolorizing, and bleaching of edible oil and fats.
- Activated bleaching earths have a higher ability to absorb impurities in comparison to natural bleaching earths.
- It is used for the purification of various edible oils and fats, including soya bean oil, cotton seed oil, palm oil, rapeseed oil, sunflower oil, safflower oil, rice bran oil, corn oil, canola oil, olive oil, and sesame oil.
- In 2022/23, the global production volume of palm oil stood at 77.22 million metric tons, up from 73.83 million metric tons in 2021/22.
- In 2022/23, the global production volume of soybean oil increased by 3.0% to 61,494 thousand metric tons, up from 59,259 thousand metric tons in 2021/22.
- The global production of rapeseed oil across the world increased to 31.8 million metric tons in 2022/23, up from 29.07 million metric tons in 2021/22.
- In 2022/23, the global production of sunflower seed oil stood at 20.36 million metric tons, up from 19.84 million metric tons in 2021/22.
- The global production of cottonseed oil stood at 5.02 million metric tons in 2022/23, up from 4.97 million metric tons in 2021/22.
- However, the world witnessed a decline in the production of olive oil owing to the rising drought conditions in several countries, including major producers in Europe and South America. In 2022/23, the global production of olive oil stood at 2.82 million metric tons, which is lower in comparison to 3.27 million metric tons in 2021/22
- Thus, the increase in production and surge in demand for activated bleaching earth in edible fats and oils are expected to provide growth opportunities in the global market.
Asia-Pacific Region to Dominate the Market
- The Asia-Pacific region is expected to account for the largest share of the activated bleaching earth market. China holds the largest share of vegetable oil consumption and production in Asia-Pacific. Though the production volume is high, consumption exceeds production, resulting in higher import volumes when compared to export volumes.
- According to Oils & Fats International, during the crop year 2021-22, China produced 28 million tonnes of edible oil, a 150,000 tonnes decrease from the previous year's volume of 28.15 million tonnes. The decrease in the production volume is due to the drop in the oilseed imports, leading to a downgrade in edible vegetable oil production.
- As per the reports by the Government of China, in July 2022, the palm oil and soyabean oil imports to the country declined by 300,000 tonnes and 170,000 tonnes as compared to their previous year's volume of 3.7 million tonnes and 630,000 tonnes, respectively.
- According to the Indian Vegetable Oil Producers' Association (IVPA), during the current oil year (October 2022-September 2023), India imported around 14.37 million tonnes of vegetable oil, as compared to 14.07 million tonnes imported in the previous year.
- According to the International Energy Agency (IEA), oil continues to be the most important energy source in South Korea in terms of total energy supply. South Korea has a very important refining industry and is self-sufficient in most products other than petrochemical feedstocks.
- Furthermore, according to a report by Agriculture and Agri-Food Canada (AAFC), the total retail sales of cooking oils in the country were valued at USD 478.7 million in 2021. The sales of cooking oil are projected to reach USD 522.3 billion by the year 2026. While edible oil consumption is expected to reach nearly one million metric tons by 2026.
- According to the Ministry of Internal Affairs and Communications, the retail price for vegetable oil grew by 67% from March 2021 to January 2023, far above the price increase for most other staple foods.
- Additionally, the import value of soybeans in the country reached USD 213.98 million in July 2023 from USD 190.05 million in June 2023. The soybean oil exports in the country accounted for USD 0.17 million, whereas imports accounted for USD 2.43 million, resulting in a negative trade balance.
- Hence, due to the above-mentioned reasons, Asia-Pacific is anticipated to dominate the market during the forecast period.
Activated Bleaching Earth Industry Overview
The activated bleaching earth market is fragmented in nature. Some of the major players in the market (not in any particular order) include Clariant, Musim Mas, Shell, Oil-Dri Corporation of America, and Ashapura Perfoclay Limited, among other companies.
Additional Benefits:
- The market estimate (ME) sheet in Excel format
- 3 months of analyst support
TABLE OF CONTENTS
1 INTRODUCTION
- 1.1 Study Assumptions
- 1.2 Scope of the Study
2 RESEARCH METHODOLOGY
3 EXECUTIVE SUMMARY
4 MARKET DYNAMICS
- 4.1 Drivers
- 4.1.1 Growing Demand for Edible Oils
- 4.2 Restraints
- 4.2.1 Presence of Alternative Products and Technologies
- 4.3 Industry Value Chain Analysis
- 4.4 Porter's Five Forces Analysis
- 4.4.1 Bargaining Power of Suppliers
- 4.4.2 Bargaining Power of Consumers
- 4.4.3 Threat of New Entrants
- 4.4.4 Threat of Substitute Products and Services
- 4.4.5 Degree of Competition
5 MARKET SEGMENTATION (Market Size in Value)
- 5.1 Application
- 5.1.1 Edible Oil and Fats
- 5.1.2 Mineral Oil and Lubricants
- 5.1.3 Other Applications (Chemical, Biodiesel, etc.)
- 5.2 Geography
- 5.2.1 Asia-Pacific
- 5.2.1.1 China
- 5.2.1.2 India
- 5.2.1.3 Japan
- 5.2.1.4 South Korea
- 5.2.1.5 Rest of Asia-Pacific
- 5.2.2 North America
- 5.2.2.1 United States
- 5.2.2.2 Canada
- 5.2.2.3 Mexico
- 5.2.3 Europe
- 5.2.3.1 Germany
- 5.2.3.2 United Kingdom
- 5.2.3.3 Italy
- 5.2.3.4 France
- 5.2.3.5 Rest of Europe
- 5.2.4 South America
- 5.2.4.1 Brazil
- 5.2.4.2 Argentina
- 5.2.4.3 Rest of South America
- 5.2.5 Middle East and Africa
- 5.2.5.1 Saudi Arabia
- 5.2.5.2 South Africa
- 5.2.5.3 Rest of Middle East and Africa
- 5.2.1 Asia-Pacific
6 COMPETITIVE LANDSCAPE
- 6.1 Mergers and Acquisitions, Joint Ventures, Collaborations, and Agreements
- 6.2 Market Ranking Analysis
- 6.3 Strategies Adopted by Leading Players
- 6.4 Company Profiles
- 6.4.1 Ashapura Perfoclay Limited (APL)
- 6.4.2 Clariant
- 6.4.3 Global Bleach Chem Pvt. Ltd
- 6.4.4 Hrp Industries
- 6.4.5 Indian Clay And Mineral Co.
- 6.4.6 Musim Mas Holdings Pte Ltd
- 6.4.7 Oil-dri Corporation of America
- 6.4.8 Phoenix Chemicals (Pvt.) Ltd
- 6.4.9 Refoil Earth Pvt. Ltd
- 6.4.10 Shell Plc (ecooils Limited)
- 6.4.11 Taiko Group of Companies (Taiko Bleaching Earth Sdn. Bhd.)
- 6.4.12 The W Clay Industries Sdn Bhd
7 MARKET OPPORTUNITIES AND FUTURE TRENDS
- 7.1 Increasing Production of Bio-diesel
 漂白黏土市场规模、份额、成长及全球产业分析:按类型、应用和地区划分,并预测至2026-2034年
 漂白黏土市场:依原料、类型、活化製程、应用和最终用途划分-2026-2032年全球预测
 2026年全球活性漂白土市场报告2026年全球漂白土市场报告
 活性漂白土市场规模、份额及成长分析(按类型、技术、应用和地区划分)-产业预测,2026-2033年
 全球活性漂白土市场
 漂白土市场报告(按类型、应用、最终用户和地区)2025-2033全球活性漂白土市场规模(按应用、地区、范围和预测)
 活性白土市场规模、份额、趋势分析报告:按应用、地区、细分市场预测,2025-2030 年