


 |
市场调查报告书
商品编码
1689956
二氧化硅 -市场占有率分析、产业趋势与统计、成长预测(2025-2030 年)Silica - Market Share Analysis, Industry Trends & Statistics, Growth Forecasts (2025 - 2030) |
||||||
※ 本网页内容可能与最新版本有所差异。详细情况请与我们联繫。
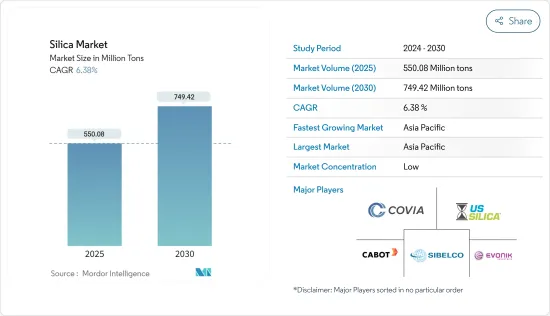
预计 2025 年二氧化硅市场规模为 5.5008 亿吨,到 2030 年将达到 7.4942 亿吨,预测期内(2025-2030 年)的复合年增长率为 6.38%。
建设产业是二氧化硅的主要消费者,该行业在新冠疫情期间受到供应链中断、停工和其他挑战的负面影响。然而,随着疫情后一些建设活动的恢復,对二氧化硅的需求开始成长,使建设产业的二氧化硅市场恢復平衡。预计未来几年优质混凝土使用量的增加也将推动市场的发展。二氧化硅在电子设备中的使用也是推动市场发展的主要因素。
主要亮点
- 各类终端用户对沉淀二氧化硅的需求不断增长以及建设活动的快速扩张可能会推动二氧化硅市场的成长。
- 另一方面,来自替代产品的竞争预计将阻碍市场成长。
- 绿色轮胎的兴起以及电动和自动驾驶汽车的日益普及预计将为二氧化硅市场带来新的机会。
- 由于中国、日本和印度的需求量大,预计亚太地区将主导二氧化硅市场。
二氧化硅市场趋势
建筑和建设产业的需求增加
- 二氧化硅是许多建筑产品的关键成分。为了提高耐用性和结构完整性,全谷二氧化硅用于地板材料、砂浆、特殊水泥、屋顶瓦片、沥青混合物、防滑表面和其他工业材料。
- 亚太地区主导全球建设活动。该地区正经历快速经济成长,中国、印度、日本和印尼等国家的建设也在增加。根据牛津经济研究院预测,2020年至2030年间,全球建筑业规模预计将成长4.5兆美元(42%),达到15.2兆美元。
- 根据仲量联行印度分公司(JLL India)统计,2023年上半年印度住宅销售达1,51,138套,较2022年同期成长24.4%,为近年来最高增幅。根据印度品牌股权基金会 (IBEF) 的数据,2023 年上半年印度住宅销售量预计将比 2022 年同期激增 130%。
- 由于人口成长、中等收入群体的增加和都市化,亚太地区的建筑业正在健康成长。在亚太地区,中国是购物中心建设领先的国家之一。中国目前约有 4,000 家购物中心,预计到 2025 年还将有 7,000 家购物中心开幕。
- 根据美国人口普查局的数据,2023年公共和私人建筑总支出将达到1.9787兆美元,比2022年的1.8487兆美元高出7%。 2023年私人建筑支出将达到1.541兆美元,比2022年的1.4724兆美元高出4.7%。这样的建筑趋势很可能在预测期内提振市场。
- 城市事务部长贾达·菲略表示,巴西已出台「我的家,我的生活」计画新规,降低利率并增加购屋补贴。该计划将有助于实现2026年建造200万套住宅的目标。 2023年7月,巴西总统路易斯·伊纳西奥·卢拉·达席尔瓦宣布了未来四年投资2,000亿美元的基础设施、能源和交通发展计画。
- 所有这些因素都可能推动预测期内对硅砂的需求。
亚太地区占市场主导地位
- 由于中国和印度在建筑、电子和玻璃製造等终端用户行业的需求中占据主导地位,预计亚太地区将成为二氧化硅消费的主要市场。
- 根据中国国家统计局的数据,中国建筑业正在快速扩张。预计到2023年,中国建筑业产出将达到约31.59兆元(4.44兆美元),高于2022年的31.2兆元(4.39兆美元)。
- 2020年,中国宣布计划在2025年前的五年内投资1.43兆美元用于重大建设计划。据国家发展和改革委员会(NDRC)称,上海计划在未来三年内共投资387亿美元。同时,广州签约新基建计划16个,总投资80.9亿美元。这些倡议将为中国及全部区域的市场带来巨大的推动力。
- 印度建筑业是该国第二大产业,占其GDP的很大一部分。例如,根据印度统计和计画实施部的数据,建设业对印度 GDP 的贡献约为 8.2%(2022-2023 年)。
- 根据印度品牌股权基金会估计,到2030年,印度房地产产业的规模将达到1兆美元,到2025年将为该国的GDP贡献13%。
- 印度政府的「全民住宅」计画预计到 2025 年住宅产业投资将达到 1.3 兆美元。到 2024 年,经济适用住宅供应量预计将增加约 70%。
- 预计2025年大阪世博会前夕日本建设产业将会蓬勃发展。八重洲重建计划包括一座 61 层楼、390 公尺高的办公大楼,预计分别于 2023 年和 2027 年完工。
- 由于这些因素,预计亚太地区将在预测期内占据市场主导地位。
二氧化硅产业概况
二氧化硅市场较为分散,既有国际参与者,也有国内参与者。研究涉及的市场主要企业(不分先后顺序)包括 Covia Holdings LLC、 美国 Silica、Sibelco、Cabot Corporation 和 Evonik Industries AG。
其他福利
- Excel 格式的市场预测 (ME) 表
- 3个月的分析师支持
目录
第一章 引言
- 调查前提条件
- 研究范围
第二章调查方法
第三章执行摘要
第四章 市场动态
- 驱动程式
- 各种最终用途对沉淀二氧化硅的需求不断增加
- 建设活动快速扩张
- 限制因素
- 来自替代产品的竞争
- 价值链分析
- 波特五力分析
- 供应商的议价能力
- 买家的议价能力
- 新进入者的威胁
- 替代品的威胁
- 竞争程度
- 技术简介
第五章市场区隔
- 类型
- 非晶质
- 热原/熏蒸
- 水合物
- 结晶质
- 石英
- 鳞石英
- 方硅石
- 非晶质
- 最终用户产业
- 建筑与施工
- 页岩油和天然气
- 玻璃製造
- 水处理
- 其他最终用户产业
- 地区
- 亚太地区
- 中国
- 印度
- 日本
- 韩国
- 马来西亚
- 泰国
- 印尼
- 越南
- 其他亚太地区
- 北美洲
- 美国
- 加拿大
- 墨西哥
- 欧洲
- 德国
- 英国
- 义大利
- 法国
- 俄罗斯
- 西班牙
- 北欧的
- 土耳其
- 其他欧洲国家
- 南美洲
- 巴西
- 阿根廷
- 南美洲其他地区
- 中东和非洲
- 沙乌地阿拉伯
- 南非
- 奈及利亚
- 卡达
- 阿拉伯聯合大公国
- 埃及
- 其他中东和非洲地区
- 亚太地区
第六章 竞争格局
- 併购、合资、合作与协议
- 市场占有率(%)**/排名分析
- 主要企业策略
- 公司简介
- AGSCO Corp.
- AMS Applied Material Solutions
- Cabot Corporation
- China-Henan Huamei Chemical Co. Ltd
- Covia Holdings LLC
- Denka Company Limited
- Evonik Industries AG
- Heraeus Holding
- Kemitura Group AS
- Merck KGaA
- Madhu Silica Pvt. Ltd
- Mitsubishi Chemical Corporation
- Nouryon
- OCI COMPANY Ltd
- PPG Industries Inc.
- Sibelco
- Tokuyama Corporation
- US Silica
- Wacker Chemie AG
- WR Grace & Co.-Conn.
第七章 市场机会与未来趋势
- 绿色轮胎的兴起
- 电动车和自动驾驶汽车的普及率不断提高
The Silica Market size is estimated at 550.08 million tons in 2025, and is expected to reach 749.42 million tons by 2030, at a CAGR of 6.38% during the forecast period (2025-2030).
The primary consumer for silica is the construction industry, which was negatively impacted by supply chain disruptions, lockdowns, and other challenges during the COVID-19 pandemic. However, with the restart of a few construction activities after the pandemic, the demand for silica started to gain momentum, leading to a balanced market for silica in the construction industry. Increasing high-quality concrete usage is also expected to drive the market in the upcoming years. The use of silica in electronics is another major factor that is likely to drive the market.
Key Highlights
- The rising demand for precipitated silica for different end users and rapidly expanding construction activities are likely to drive the growth of the silica market.
- On the flip side, competition from substitute products is expected to hinder the market's growth.
- The growing emergence of green tires and the increasing adoption of electric and self-driving cars are expected to unveil new opportunities for the market studied.
- Asia-Pacific is expected to dominate the silica market due to the high demand from China, Japan, and India.
Silica Market Trends
Increasing Demand from the Building and Construction Industry
- Silica is one of the primary components in various building and construction products. For improved durability and structural integrity, whole-grain silica is used in flooring, mortars, specialty cement, roofing shingles, asphalt mixtures, skid-resistant surfaces, and other industrial materials.
- Asia-Pacific is dominating construction activities worldwide. The area is registering fast economic growth and increasing construction in China, India, Japan, and Indonesia, among others. According to Oxford Economics, the global construction industry is expected to grow by USD 4.5 trillion, or 42%, between 2020 and 2030 to reach USD 15.2 trillion.
- The housing sales in India reached 151,138 units in the first half of 2023, which increased by 24.4% compared to the same period in 2022, as per the Jones Lang LaSalle IP (JLL India). The growth has been the highest over the last couple of years. The sales of luxury homes in the country sharply increased by 130% in the first half of 2023 compared to the same period in 2022, as per the India Brand Equity Foundation (IBEF).
- The construction sector in Asia-Pacific is growing at a healthy rate, owing to the rising population, increasing income of the middle-income groups, and urbanization. In Asia-Pacific, China is one of the leading countries in terms of shopping center construction. China has almost 4,000 shopping centers, while 7,000 more are estimated to open by 2025.
- According to the United States Census Bureau, the value or spending on the total public and private constructions in 2023 was USD 1,978.7 billion, 7% higher than the USD 1,848.7 billion spent in 2022. The spending on private construction in 2023 was USD 1,541.0 billion, 4.7% more than USD 1,472.4 billion in 2022. Such trends in construction may boost the market during the forecast period.
- In Brazil, according to Urban Affairs Minister Jader Filho, the new rules of the Minha Casa, Minha Vida (My Home, My Life) program have been introduced to reduce interest rates and increase subsidies for property purchases. Thus, the program will contribute to the goal of building 2 million housing units by 2026. In July 2023, Brazilian President Luiz Inacio Lula da Silva introduced a development plan worth USD 200 billion for infrastructure, energy, and transportation over the next four years.
- All such factors will likely propel the demand for silica sand during the forecast years.
Asia-Pacific to Dominate the Market
- Asia-Pacific is expected to be the dominant market for silica consumption, as China and India dominate the demand from end-user industries such as building and construction, electronics, and glass manufacturing.
- According to the National Bureau of Statistics of China, the country's building industry is expanding at a rapid pace. China's construction output was valued at around CNY 31.59 trillion (USD 4.44 trillion) in 2023, increasing from CNY 31.2 trillion (USD 4.39 trillion) in 2022.
- In 2020, China unveiled its plans to invest USD 1.43 trillion in key construction projects for five years till 2025. According to the National Development and Reform Commission (NDRC), the Shanghai plan calls for a total investment of USD 38.7 billion over the next three years. Guangzhou, on the other hand, signed 16 new infrastructure projects for USD 8.09 billion. Such initiatives can significantly propel the market in China and the overall region.
- India's construction industry is the second-largest industry in the country, accounting for a significant share of its GDP. For instance, according to the Ministry of Statistics & Programme Implementation, the construction industry accounted for a share of about 8.2% of India's GDP (2022-2023).
- According to the India Brand Equity Foundation, the real estate sector in India is expected to reach USD 1 trillion by 2030, and by 2025, it is estimated to contribute 13% to the country's GDP.
- The Government of India's Housing for All initiative is expected to bring USD 1.3 trillion in investment in the housing industry by 2025. In 2024, the rate of affordable housing availability is projected to increase by roughly 70%.
- The Japanese construction industry is projected to boom as the country prepares to host the World Expo in Osaka, Japan, in 2025. The Yaesu redevelopment project, which includes a 61-story, 390-meter-tall office tower, was scheduled to be completed in 2023 and 2027, respectively.
- Due to such factors, Asia-Pacific is expected to dominate the market during the forecast period.
Silica Industry Overview
The silica market is fragmented, with both international and domestic players. The major companies (not in any particular) in the market studied include Covia Holdings LLC, US Silica, Sibelco, Cabot Corporation, and Evonik Industries AG.
Additional Benefits:
- The market estimate (ME) sheet in Excel format
- 3 months of analyst support
TABLE OF CONTENTS
1 INTRODUCTION
- 1.1 Study Assumptions
- 1.2 Scope of the Study
2 RESEARCH METHODOLOGY
3 EXECUTIVE SUMMARY
4 MARKET DYNAMICS
- 4.1 Drivers
- 4.1.1 Increasing Demand of Precipitated Silica for Different End Uses
- 4.1.2 Rapidly Expanding Construction Activities
- 4.2 Restraints
- 4.2.1 Competition from Substitute Products
- 4.3 Industry Value Chain Analysis
- 4.4 Porter's Five Forces Analysis
- 4.4.1 Bargaining Power of Suppliers
- 4.4.2 Bargaining Power of Buyers
- 4.4.3 Threat of New Entrants
- 4.4.4 Threat of Substitute Products and Services
- 4.4.5 Degree of Competition
- 4.5 Technological Snapshot
5 MARKET SEGMENTATION (Market Size in Volume)
- 5.1 Type
- 5.1.1 Amorphous
- 5.1.1.1 Pyrogenic/Fumed
- 5.1.1.2 Hydrated
- 5.1.2 Crystalline
- 5.1.2.1 Quartz
- 5.1.2.2 Tridymite
- 5.1.2.3 Cristobalite
- 5.1.1 Amorphous
- 5.2 End-user Industry
- 5.2.1 Building and Construction
- 5.2.2 Shale Oil and Gas
- 5.2.3 Glass Manufacturing
- 5.2.4 Water Treatment
- 5.2.5 Other End-user Industries
- 5.3 Geography
- 5.3.1 Asia-Pacific
- 5.3.1.1 China
- 5.3.1.2 India
- 5.3.1.3 Japan
- 5.3.1.4 South Korea
- 5.3.1.5 Malaysia
- 5.3.1.6 Thailand
- 5.3.1.7 Indonesia
- 5.3.1.8 Vietnam
- 5.3.1.9 Rest of Asia-Pacific
- 5.3.2 North America
- 5.3.2.1 United States
- 5.3.2.2 Canada
- 5.3.2.3 Mexico
- 5.3.3 Europe
- 5.3.3.1 Germany
- 5.3.3.2 United Kingdom
- 5.3.3.3 Italy
- 5.3.3.4 France
- 5.3.3.5 Russia
- 5.3.3.6 Spain
- 5.3.3.7 NORDIC
- 5.3.3.8 Turkey
- 5.3.3.9 Rest of Europe
- 5.3.4 South America
- 5.3.4.1 Brazil
- 5.3.4.2 Argentina
- 5.3.4.3 Rest of South America
- 5.3.5 Middle East and Africa
- 5.3.5.1 Saudi Arabia
- 5.3.5.2 South Africa
- 5.3.5.3 Nigeria
- 5.3.5.4 Qatar
- 5.3.5.5 United Arab Emirates
- 5.3.5.6 Egypt
- 5.3.5.7 Rest of Middle East and Africa
- 5.3.1 Asia-Pacific
6 COMPETITIVE LANDSCAPE
- 6.1 Mergers and Acquisitions, Joint Ventures, Collaborations, and Agreements
- 6.2 Market Share (%)**/Ranking Analysis
- 6.3 Strategies Adopted by Leading Players
- 6.4 Company Profiles
- 6.4.1 AGSCO Corp.
- 6.4.2 AMS Applied Material Solutions
- 6.4.3 Cabot Corporation
- 6.4.4 China-Henan Huamei Chemical Co. Ltd
- 6.4.5 Covia Holdings LLC
- 6.4.6 Denka Company Limited
- 6.4.7 Evonik Industries AG
- 6.4.8 Heraeus Holding
- 6.4.9 Kemitura Group AS
- 6.4.10 Merck KGaA
- 6.4.11 Madhu Silica Pvt. Ltd
- 6.4.12 Mitsubishi Chemical Corporation
- 6.4.13 Nouryon
- 6.4.14 OCI COMPANY Ltd
- 6.4.15 PPG Industries Inc.
- 6.4.16 Sibelco
- 6.4.17 Tokuyama Corporation
- 6.4.18 US Silica
- 6.4.19 Wacker Chemie AG
- 6.4.20 WR Grace & Co.-Conn.
7 MARKET OPPORTUNITIES AND FUTURE TRENDS
- 7.1 Growing Emergence of Green Tires
- 7.2 Growth in the Adoption of Electric Cars and Self-driving Cars
 2025年全球二氧化硅矿物补充剂市场报告
 二氧化硅微球-全球市占率及排名、总收入及需求预测(2025-2031年)高纯度有机二氧化硅溶胶:全球市占率及排名、总收入及需求预测(2025-2031年)有机硅溶液:全球市占率排名、总销售额和需求预测(2025-2031年)
 二氧化硅粉末市场按来源类型、等级、功能、粒径、纯度、分销管道和应用划分-2025-2032年全球预测
 全球有机硅溶胶市场(2025年)二氧化硅市场按产品类型、形状、粒度、等级、应用和最终用户产业划分-2025-2030 年全球预测
 介孔二氧化硅的全球市场
 全球中孔二氧化硅市场研究报告-产业分析、规模、份额、成长、趋势及2025年至2033年预测全球绿色二氧化硅市场