


 |
市场调查报告书
商品编码
1690080
美国资料中心 -市场占有率分析、产业趋势与统计、成长预测(2025-2030 年)United States Data Center - Market Share Analysis, Industry Trends & Statistics, Growth Forecasts (2025 - 2030) |
||||||
※ 本网页内容可能与最新版本有所差异。详细情况请与我们联繫。
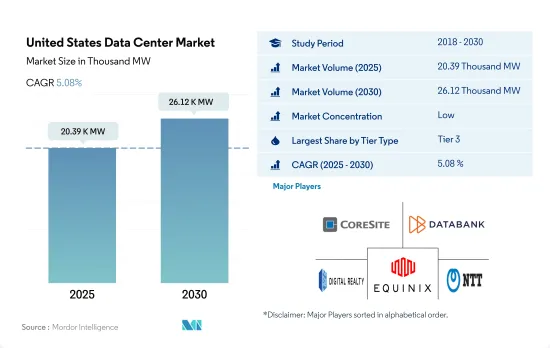
预计 2025 年美国资料中心市场规模为 20,390 千瓦,到 2030 年将达到 26,120 千瓦,复合年增长率为 5.08%。
预计 2025 年主机託管收益将达到 240.364 亿美元,2030 年将达到 386.753 亿美元,预测期内(2025-2030 年)的复合年增长率为 9.98%。
2023 年, 层级 3资料中心将占据大部分市场份额
- 3层级资料中心是国内最受欢迎的。 2022年的IT负载容量为5,319.6MW。 3层级资料中心拥有冗余和双电源伺服器、储存、网路链路和其他 IT 元件。截至 2022 年,全国共有 399 个层级 3资料中心。约有 73 个资料中心正在依照层级 3 标准建置中。
- 小型企业通常喜欢层级设施。小型企业占活跃企业的99.9%,是美国经济的重要组成部分。 BFSI 和电讯等最终用户正在转向超大规模主机託管服务。
- 4层级资料中心主要受到大型企业的青睐,因为它们可提供 99.995% 的执行时间。然而,成本高是这些设施采用率低的主要原因。随着资料流量的增加,未来的资料中心可望遵循层级 4标准。在美国,IP 流量将从 2016 年的 376.2 Exabyte成长到 2021 年的 955.7 Exabyte ,这意味着对更多冗余和高效设施的需求不断增加。因此,预计 2029 年 4层级资料中心将占据最大的市场占有率,达到 48.9%,其次是 3层级设施,占 45.4%。
- 层级 1 和层级 2资料中心是最不受欢迎的,因为层级 1 的预期运作为 99.671%(每年停机时间为 28.8 小时),而层级 2 的预期运作为 99.741%(每年停机时间为 22 小时)。这些资料中心受到寻求经济高效的资料储存方案的中小型企业的欢迎。然而,由于其功能性较低,即使是中小企业也倾向于采用层级 3 认证的批发主机託管服务。因此,预计层级和层级资料中心的成长率最慢。
美国资料中心市场的趋势
视讯通话使用量的增加、店内购物体验的增强、远端医疗服务以及行动游戏的改进将推动市场成长
- 随着 5G 等更快的替代网路以及 FWA 等支援技术的广泛光纤连接的推出,智慧型手机的资料消费量将从 2018 年的 1.8GB 增长到 2022 年的约 8.5GB,复合年增长率为 24.7%。预计这一消费量将进一步成长,到 2029 年将超过 64GB,复合年增长率为 33.6%。随着 5G 加速智慧型手机的普及和升级,市场将看到资料生成点的增加,从而由于无线网路速度更快而导致资料消耗增加。
- 互联网速度的提高以及随之而来的可访问设备的普及对于确定和估计一个地区的资料消耗起着至关重要的作用。资料显示,美国5G行动连线数量将从2021年的15%成长到2025年的约68%,显示美国5G行动普及率很高。用户发现增强的视讯通话、扩展的店内购物体验、远端医疗服务和改进的手机游戏非常有吸引力,因为 5G 网路上的一些活动会增加资料使用量。
- 其次是 YouTube,约占 74%,Gmail,占 61%,Facebook,占 59%,以及 Google搜寻应用程式,占 58%。儘管 Android 和 iOS 用户之间存在分歧,但这些智慧型手机应用程式的广泛普及表明应用程式在美国具有深刻的渗透力和使用率。这凸显了资料储存需要提供此类媒体运行和储存使用者资料所需的记忆体平台,从而对资料处理设备提出了更高的要求。
智慧型手机的普及和 5G 连接的增加将推动市场成长
- 美国是我们北美和全球智慧型手机产品组合的关键市场。预计智慧型手机普及率将从 2021 年的 83% 成长到 2025 年的 85%,这将对用户普及率的成长做出重大贡献,从 2021 年的 85% 成长到 2025 年的 86%。这一增长将导致智慧型手机销量增加以及该国智慧型手机总数的增加。在美国智慧型手机产业,较长的更换速度和缺乏引人注目的功能导致 2018 年销量下滑,然而,在竞争激烈的智慧型手机市场中,5G 的推出和通讯业者的采用显着提振了市场。
- 此外,2022 年 1 月发布的资料显示,智慧型手机销售额将增加 17 亿美元,到 2022 年达到约 747 亿美元,而 2021 年约为 730 亿美元。儘管新冠疫情期间市场放缓,但 5G 一直是美国智慧型手机普及和渗透的关键驱动力。疫情使得 2025 年 5G 连线数预测从 2.05 亿增加到 2.18 亿左右,显示 5G 将如何推动该地区的智慧型手机销售。
- 智慧型手机数量的成长体现在该国行动无线用户连线数量的增加,从 2019 年的约 4.425 亿增加到 2021 年的约 4.9891 亿。这一趋势表明高普及率将有助于销售。在预测期内,5G 将透过增加资料点对资料产生做出重大贡献,从而需要更多的资料中心来储存和处理资料。
美国资料中心产业概况
美国资料中心市场较为分散,前五大企业占比为16.24%。该市场的主要企业有:CoreSite(美国塔公司)、Databank Holdings Ltd、Digital Realty Trust, Inc.、Equinix, Inc. 和 NTT Ltd.(按字母顺序排列)。
其他福利
- Excel 格式的市场预测 (ME) 表
- 3个月的分析师支持
目录
第一章执行摘要和主要发现
第二章 报告要约
第三章 引言
- 研究假设和市场定义
- 研究范围
- 调查方法
第四章 市场展望
- 负载能力
- 占地面积
- 主机代管收入
- 安装的机架数量
- 机架空间利用率
- 海底电缆
第五章 产业主要趋势
- 智慧型手机用户数量
- 每部智慧型手机的资料流量
- 行动资料速度
- 宽频资料速度
- 光纤连接网路
- 法律规范
- 美国
- 价值炼和通路分析
第六章市场区隔
- 热点
- 亚特兰大
- 奥斯汀
- 波士顿
- 芝加哥
- 达拉斯
- 休士顿
- 洛杉矶
- 纽泽西州
- 纽约
- 北加州
- 北维吉尼亚
- 西北
- 凤凰
- 盐湖城
- 美国其他地区
- 资料中心规模
- 大规模
- 超大规模
- 中等规模
- 百万
- 小规模
- 层级类型
- 1层级和2级
- 层级
- 层级
- 吸收量
- 未使用
- 使用
- 按主机託管类型
- 超大规模
- 零售
- 批发的
- 按最终用户
- BFSI
- 云
- 电子商务
- 政府
- 製造业
- 媒体与娱乐
- 电信
- 其他最终用户
第七章竞争格局
- 市场占有率分析
- 商业状况
- 公司简介.
- CoreSite(America Tower Corporation)
- CyrusOne Inc.
- Cyxtera Technologies
- Databank Holdings Ltd
- Digital Realty Trust, Inc.
- Equinix, Inc.
- Flexential Corp.
- H5 Data Centers LLC
- NTT Ltd.
- Quality Technology Services
- Switch
- Vantage Data Centers, LLC
- LIST OF COMPANIES STUDIED
第八章:CEO面临的关键策略问题
第九章 附录
- 世界概况
- 概述
- 五力分析框架
- 全球价值链分析
- 全球市场规模和DRO
- 资讯来源及延伸阅读
- 图表清单
- 关键见解
- 资料包
- 词彙表
The United States Data Center Market size is estimated at 20.39 thousand MW in 2025, and is expected to reach 26.12 thousand MW by 2030, growing at a CAGR of 5.08%. Further, the market is expected to generate colocation revenue of USD 24,036.4 Million in 2025 and is projected to reach USD 38,675.3 Million by 2030, growing at a CAGR of 9.98% during the forecast period (2025-2030).
Tier 3 data center accounted for majority share in terms of volume in 2023
- Tier 3 data centers are the most preferred in the country. They operated at an IT load capacity of 5,319.6 MW in 2022. Tier 3 data centers have redundant and dual-powered servers, storage, network links, and other IT components. As of 2022, the country had 399 tier 3 data centers. Around 73 data centers are under construction with Tier 3 standards.
- SMEs generally prefer a Tier 3-rated facility. SMEs are a vital component of the US economy, as they comprise 99.9% of active enterprises. End users such as BFSI and telecom are focusing on hyperscale colocation services.
- Tier 4 data centers are the next most preferred, mainly by large enterprises, as they provide 99.995% uptime. However, high cost is the major factor for the low adoption of these facilities. With the data traffic generation, upcoming data centers are expected to follow Tier 4 standards. In the United States, IP traffic reached an annual run rate of 955.7 exabytes in 2021, up from an annual run rate of 376.2 exabytes in 2016, suggesting the growing demand for more redundant and efficient facilities. As a result, tier 4 data centers are expected to hold the highest market share of 48.9% in 2029, followed by tier 3 facilities with a share of 45.4%.
- Tier 1 & 2 data centers are the least preferred as tier 1 has an expected uptime of 99.671% (28.8 hours of downtime annually), while tier 2 has an expected uptime of 99.741% (22 hours of downtime annually). These data centers are commonly utilized by small businesses looking for a cost-effective option for their data storage needs. However, due to lower functionality, even SMEs are focusing on adopting wholesale colocation services with a Tier 3 certification. Therefore, tier 1 & 2 DCs are expected to showcase the lowest growth.
United States Data Center Market Trends
Increase use of video calling, augmented in-store shopping experiences, remote health services, and improved mobile gaming to drive market growth
- With the introduction of faster network alternatives, such as 5G and extensive fiber connectivity supporting technologies like FWA, data consumption through smartphones increased from 1.8 GB in 2018 to about 8.5 GB in 2022 at a CAGR of 24.7%. This consumption is expected to further increase to more than 64 GB by 2029, at a CAGR of 33.6%. As 5G drives smartphone adoption and upgrades, the market will witness more data generating points, leading to increased data consumption that leverages higher wireless network speeds.
- Faster internet and the subsequent penetration of devices capable of accessing it play a crucial role in determining and estimating data consumption in a region. Data suggests that the number of 5G mobile connections in the United States will increase from 15% in 2021 to about 68% by 2025, signifying high 5G mobile penetration in the country. Users find enhanced video calling, augmented in-store shopping experiences, remote health services, and improved mobile gaming as some of the activities through 5G networks to be very or extremely appealing, which contributes to data usage.
- Several apps account for considerable smartphone reach across audiences, with YouTube accounting for about 74% audience reach, followed by 61% for Gmail, 59% for Facebook, and 58% for the Google Search app. The extensive reach of such smartphone apps, despite the Android and iOS division among the audience, signifies deep app penetration and usage in the United States. This highlights the need for data storage to provide the required memory platforms for such media to perform and store user data, thereby creating a greater demand for data processing facilities.
Smartphone adoption and increasing 5G connections to drive market growth
- The United States is a significant market in both North America and the global smartphone portfolio. With smartphone adoption expected to grow from 83% in 2021 to 85% by 2025, it will substantially contribute to the growth of subscriber penetration rates, increasing from 85% in 2021 to 86% by 2025. This growth will result in a rise in smartphone sales and the overall number of smartphones in the country. Although longer replacement rates and a lack of compelling features in the US smartphone industry led to a decrease in sales in 2018, the market received a major boost with the 5G rollout and adoption by operators in the highly competitive smartphone market.
- Additionally, data released in January 2022 indicated a USD 1.7 billion increase in smartphone sales value, totaling approximately USD 74.7 billion in 2022, compared to about USD 73 billion in 2021. Despite the market slowdown during COVID-19, 5G has been a key driver of smartphone adoption and penetration in the United States. The pandemic increased the anticipated number of 5G connections in 2025 from 205 million to about 218 million, signifying how 5G would drive better smartphone sales in the region.
- The increase in the number of smartphones was observed through the growth of mobile wireless subscriber connections in the country, rising from about 442.5 million in 2019 to approximately 498.91 million by 2021. This trend indicates the high penetration rates contributing to sales. Over the forecast period, 5G will heavily contribute to data generation through increased data points, generating demand for more data centers to store and process the data.
United States Data Center Industry Overview
The United States Data Center Market is fragmented, with the top five companies occupying 16.24%. The major players in this market are CoreSite (America Tower Corporation), Databank Holdings Ltd, Digital Realty Trust, Inc., Equinix, Inc. and NTT Ltd. (sorted alphabetically).
Additional Benefits:
- The market estimate (ME) sheet in Excel format
- 3 months of analyst support
TABLE OF CONTENTS
1 EXECUTIVE SUMMARY & KEY FINDINGS
2 REPORT OFFERS
3 INTRODUCTION
- 3.1 Study Assumptions & Market Definition
- 3.2 Scope of the Study
- 3.3 Research Methodology
4 MARKET OUTLOOK
- 4.1 It Load Capacity
- 4.2 Raised Floor Space
- 4.3 Colocation Revenue
- 4.4 Installed Racks
- 4.5 Rack Space Utilization
- 4.6 Submarine Cable
5 Key Industry Trends
- 5.1 Smartphone Users
- 5.2 Data Traffic Per Smartphone
- 5.3 Mobile Data Speed
- 5.4 Broadband Data Speed
- 5.5 Fiber Connectivity Network
- 5.6 Regulatory Framework
- 5.6.1 United States
- 5.7 Value Chain & Distribution Channel Analysis
6 MARKET SEGMENTATION (INCLUDES MARKET SIZE IN VOLUME, FORECASTS UP TO 2030 AND ANALYSIS OF GROWTH PROSPECTS)
- 6.1 Hotspot
- 6.1.1 Atlanta
- 6.1.2 Austin
- 6.1.3 Boston
- 6.1.4 Chicago
- 6.1.5 Dallas
- 6.1.6 Houston
- 6.1.7 Los Angeles
- 6.1.8 New Jersey
- 6.1.9 New York
- 6.1.10 Northern California
- 6.1.11 Northern Virginia
- 6.1.12 Northwest
- 6.1.13 Phoenix
- 6.1.14 Salt Lake City
- 6.1.15 Rest of United States
- 6.2 Data Center Size
- 6.2.1 Large
- 6.2.2 Massive
- 6.2.3 Medium
- 6.2.4 Mega
- 6.2.5 Small
- 6.3 Tier Type
- 6.3.1 Tier 1 and 2
- 6.3.2 Tier 3
- 6.3.3 Tier 4
- 6.4 Absorption
- 6.4.1 Non-Utilized
- 6.4.2 Utilized
- 6.4.2.1 By Colocation Type
- 6.4.2.1.1 Hyperscale
- 6.4.2.1.2 Retail
- 6.4.2.1.3 Wholesale
- 6.4.2.2 By End User
- 6.4.2.2.1 BFSI
- 6.4.2.2.2 Cloud
- 6.4.2.2.3 E-Commerce
- 6.4.2.2.4 Government
- 6.4.2.2.5 Manufacturing
- 6.4.2.2.6 Media & Entertainment
- 6.4.2.2.7 Telecom
- 6.4.2.2.8 Other End User
7 COMPETITIVE LANDSCAPE
- 7.1 Market Share Analysis
- 7.2 Company Landscape
- 7.3 Company Profiles (includes Global Level Overview, Market Level Overview, Core Business Segments, Financials, Headcount, Key Information, Market Rank, Market Share, Products and Services, and Analysis of Recent Developments).
- 7.3.1 CoreSite (America Tower Corporation)
- 7.3.2 CyrusOne Inc.
- 7.3.3 Cyxtera Technologies
- 7.3.4 Databank Holdings Ltd
- 7.3.5 Digital Realty Trust, Inc.
- 7.3.6 Equinix, Inc.
- 7.3.7 Flexential Corp.
- 7.3.8 H5 Data Centers LLC
- 7.3.9 NTT Ltd.
- 7.3.10 Quality Technology Services
- 7.3.11 Switch
- 7.3.12 Vantage Data Centers, LLC
- 7.4 LIST OF COMPANIES STUDIED
8 KEY STRATEGIC QUESTIONS FOR DATA CENTER CEOS
9 APPENDIX
- 9.1 Global Overview
- 9.1.1 Overview
- 9.1.2 Porter's Five Forces Framework
- 9.1.3 Global Value Chain Analysis
- 9.1.4 Global Market Size and DROs
- 9.2 Sources & References
- 9.3 List of Tables & Figures
- 9.4 Primary Insights
- 9.5 Data Pack
- 9.6 Glossary of Terms
 全球资料中心能源储存市场
 亚太地区资料中心备份 HVO 市场(按资料中心类型、材料类型和国家)分析与预测(2025-2034 年)
 欧洲 HVO 资料中心备份市场:按资料中心类型、材料类型和国家进行分析和预测(2025-2034 年)
 2025-2029年全球人工智慧资料中心市场
 2025年全球资料中心市场
 美国资料中心专案规划:2025 年第二季度
 卫星网路地面站和资料中心市场-全球产业规模、份额、趋势、机会和预测(按组件、按技术、按行业垂直、按地区和竞争),2020-2030 年预测全球资料中心基础设施管理软体市场资料中心储能市场规模、份额、趋势分析报告:按类型、技术、容量范围、资料中心类型、应用、产业垂直、地区、细分市场预测,2025-2030 年
 资料中心备用电源 HVO 的全球和区域市场:HVO 製造商、供应商、发电机製造商和资料中心营运商的分析和预测(2025-2034 年)