


 |
市场调查报告书
商品编码
1690711
分散式能源来源管理系统:市场占有率分析、产业趋势与统计、成长预测(2025-2030 年)Distributed Energy Resource Management System - Market Share Analysis, Industry Trends & Statistics, Growth Forecasts (2025 - 2030) |
||||||
价格
※ 本网页内容可能与最新版本有所差异。详细情况请与我们联繫。
简介目录
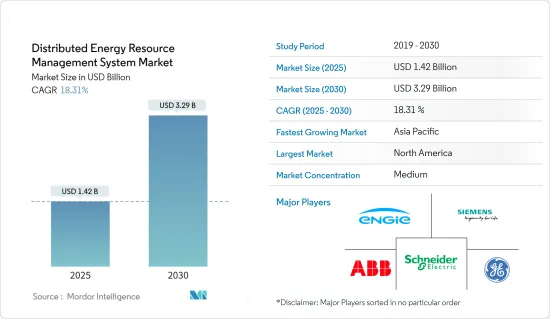
分散式能源来源管理系统市场规模预计在 2025 年为 14.2 亿美元,预计到 2030 年将达到 32.9 亿美元,预测期内(2025-2030 年)的复合年增长率为 18.31%。
主要亮点
- 从中期来看,预计预测期内分散式能源来源管理系统 (DERGMS) 市场最重要的驱动力包括向基于可再生能源的分散式发电的转变以及智慧电网投资的增加等因素。
- 另一方面,安装 DERMS 需要较高的初始成本。这可能会对预测期内分散式能源来源管理系统 (DERMS) 市场构成威胁。
- 然而,亚太和非洲电气化程度较低地区采用分散式发电以及微电网即服务的发展预计将为市场带来机会。
- 由于政府对分散式发电技术的支持政策以及可再生能源在能源结构中的份额不断增加,预计北美将在预测期内成为最大的市场。
分散式能源来源管理系统市场趋势
太阳能光伏 (PV) 领域占据市场主导地位
- 太阳能光电发电可以安装在屋顶或地面,是世界上最大的分散式能源之一。由于装置容量不断增加且平均安装成本(美元/千瓦)下降,该领域预计将引领分散式能源来源管理系统市场。分散式能源来源管理系统即时限制光伏(PV)输出,以防止逆向电流和局部高电压。
- 分散式发电具有经济可行性,所需资本比同类传统设施少得多。对太阳能发电场和分散式太阳能发电的税收激励措施正在推动全球分散式太阳能发电。
- 根据国际可再生能源机构预测,2022年全球太阳能发电装置容量将达到1,046.61吉瓦,与前一年同期比较成长率达22.4%,加上政府扶持太阳能发电的目标,太阳能发电容量预计将持续增加,有可能带动分散式能源来源管理系统市场。
- 预计未来几年太阳能光电(PV)技术将成为再生能源中年新增装置容量最大的技术,大幅超过风能和水力发电。国际能源总署预计,2022年太阳能发电量将成长26%,达到1,300TWh,是所有可再生技术中发电量绝对增幅最大的。随着太阳能装置大量涌入市场,过去六年来太阳能成本也大幅下降。太阳能板的价格也大幅下降,导致全球太阳能发电系统的安装量上升。
- 在住宅和商业及工业 (C&I) 领域,太阳能发电通常透过最终用户安装的屋顶光伏 (PV) 来实现。发电的光电系统安装在使用能源的住宅、商业建筑和工业厂房的屋顶上。个人生产的多余能源也可以出售给电力公司。
- 世界各国政府已推出多项措施和政策,以增加太阳能在国家能源结构中的份额。预计这些政策将对研究市场产生正面影响。例如在印度,印度新可再生能源部于2019年宣布了併网屋顶太阳能发电计画(第二阶段),该计画旨在透过在住宅屋顶安装太阳能发电面板来发电。印度政府先前已设定了2022年安装40,000兆瓦屋顶太阳能(RTS)的目标。
- 不过,2023年1月,印度屋顶太阳能(RTS)计画获得四年延期,旨在实现2026年3月增加40吉瓦RTS容量的目标。该计划预计将大大帮助印度实现其太阳能总容量目标。
- 因此,预计对太阳能的投资增加、政府法规的变化以及即将实施的计划将推动太阳能领域在预测期内成为最大的市场。
北美占据市场主导地位
- 预计在预测期内,北美 DERMS 市场将成为最大的市场,这主要得益于美国和加拿大,这两个国家都拥有超过一百万个分散式发电装置。
- 儘管发电量充足且输配电网路可用,但该地区的一些地区仍因洪水和风暴等自然灾害而停电。使用 DERMS 等远端电力系统来协调分散式能源系统可能会缓解这个问题。
- 美国已经制定了实现可再生能源目标的蓝图。联邦政府和许多州政府都实施了鼓励采用太阳能的政策和计画。这些激励措施包括税额扣抵、补贴、回扣和可再生能源组合标准,要求公用事业公司从太阳能等再生能源来源中购买一定比例的能源。
- 此外,随着太阳能发电工程的兴起,国家对分散式能源来源管理系统的需求也日益增加。
- 根据美国能源资讯署 (EIA) 的数据,到 2022 年,美国的小型太阳能发电容量将从 2014 年该机构开始发布估计值的 7.3 吉瓦成长到 39.5 吉瓦。小型太阳能发电约占美国所有太阳能发电容量的三分之一。
- 根据国际能源总署 (IEA) 的数据,2021 年至 2022 年,该国电动车销量近年来大幅成长。插电式混合动力车和纯电动车的累积销量增加了 27,000 多辆,显示该国电动车的普及率不断提高,而过去十年的销量增长了约 60 倍。
- 同样,根据 Electric Autonomy 彙编的资料,加拿大可公开使用的电动车 (EV) 充电基础设施正在稳步增加。截至 2023 年 3 月 1 日,加拿大自然资源部 (NRCan) 的统计数据显示,加拿大电动车用户可在全国 8,732 个充电站使用至少 20,478 个充电连接器。这意味着自 2022 年初以来,这一数字大幅增加了 30%。
- 因此,由于这些因素,北美很可能在预测期内成为分散式能源来源管理系统最大的市场。
分散式能源来源管理系统 (DERMS) 产业概况
分散式能源来源管理系统市场较为分散。市场的主要企业(不分先后顺序)包括通用电气公司、西门子股份公司、ABB 有限公司、施耐德电气 SE 和 Engie SA。
其他福利:
- Excel 格式的市场预测 (ME) 表
- 3 个月的分析师支持
目录
第 1 章 简介
- 研究范围
- 市场定义
- 调查前提
第 2 章执行摘要
第三章调查方法
第四章 市场概况
- 介绍
- 2029 年市场规模与需求预测
- 最新趋势和发展
- 政府法规和政策
- 市场动态
- 驱动程式
- 越来越多地转向基于可再生能源的分散式发电
- 增加对智慧电网的投资
- 限制因素
- 集中式电网扩建与升级
- 驱动程式
- 供应链分析
- 波特五力分析
- 供应商的议价能力
- 消费者议价能力
- 新进入者的威胁
- 替代品的威胁
- 竞争对手之间的竞争强度
第五章 市场区隔
- 依技术分类
- 光伏 (PV)
- 电动车
- 微型电网
- 其他技术
- 按最终用户
- 产业
- 住宅
- 商业的
- 按地区
- 北美洲
- 美国
- 加拿大
- 北美其他地区
- 欧洲
- 德国
- 义大利
- 法国
- 英国
- 其他欧洲国家
- 亚太地区
- 印度
- 中国
- 日本
- 韩国
- 其他亚太地区
- 南美洲
- 巴西
- 阿根廷
- 南美洲其他地区
- 中东和非洲
- 阿拉伯聯合大公国
- 沙乌地阿拉伯
- 沙乌地阿拉伯
- 其他中东和非洲地区
- 北美洲
第六章 竞争格局
- 併购、合资、合作、协议
- 主要企业策略
- 公司简介
- General Electric Company
- Siemens AG
- ABB Ltd
- Schneider Electric SE
- Oracle Corporation
- Uplight Inc.
- Doosan Corporation
- Open Access Technology International Inc.
- Mitsubishi Electric Corporation
- Emerson Electric Co.
- Engie SA
第七章 市场机会与未来趋势
- Micro Grid As A Service
简介目录
Product Code: 71080
The Distributed Energy Resource Management System Market size is estimated at USD 1.42 billion in 2025, and is expected to reach USD 3.29 billion by 2030, at a CAGR of 18.31% during the forecast period (2025-2030).
Key Highlights
- Over the medium term, factors such as an increasing shift toward renewables-based distributed power generation and rising investments in smart grid are expected to be some of the most significant drivers for the distributed energy resource management system (DERMS) market during the forecast period.
- On the other hand, there is a high initial cost of setting up DERMS. This may pose a threat to the distributed energy resource management system (DERMS) market during the forecast period.
- Nevertheless, the adoption of distributed power generation in the low-electrified areas of Asia-Pacific and Africa and the development of microgrids as a service are expected to act as opportunities in the market.
- North America is expected to be the largest market during the forecast period, owing to supportive government policies for distributed power generation technology and the increasing share of renewables in the energy mix.
Distributed Energy Resource Management System Market Trends
Solar Photovoltaic (PV) Segment to Dominate the Market
- Solar PV can be located on rooftops or ground-mounted and is one of the largest distributed power sources globally. This segment is expected to drive the distributed energy resources management system with increased installed capacity supported by decreasing average installed cost (USD/kilowatt). Distributed energy resource management systems limit real-time photovoltaic (PV) output to prevent reverse flows and high local voltages.
- Distributed generation is economically viable, requiring significantly less capital than an equivalent traditional facility. Tax incentives for both solar stations and distributed solar generation are driving distributed solar PV globally.
- According to the International Renewable Energy Agency, the global solar PV installed capacity accounted for 1,046.61 GW in 2022. With an annual growth rate of 22.4% compared to the previous year and supportive solar PV targets of the government, solar PV capacity is expected to increase in the future, which, in turn, may drive the distributed energy resource management system market.
- Solar photovoltaic (PV) technology is expected to account for renewables' most considerable annual capacity additions in the coming years, well above wind and hydro as well. According to IEA, solar PV generation increased by 26% in 2022, reaching 1300 TWh, representing the largest absolute generation growth of all renewable technologies. The cost of solar photovoltaics has also reduced dramatically in the past six years as the market was flooded with equipment. The cost of solar panels also dropped exponentially, leading to increased solar PV system installations globally.
- In the residential and commercial & industrial (C&I) sector, solar power is often generated by rooftop solar photovoltaics (PV) deployed by end users. Solar PV systems for power generation are installed on rooftops of houses and commercial buildings or industrial plants that use the energy. Excess energy produced by individual owners is sometimes sold to power companies.
- Several governments around the world have introduced several initiatives and policies to increase the contribution of solar energy to the country's energy mix. Such policies are expected to have a positive impact on the market studied. For instance, in India, the Ministry of New and Renewable Energy announced the Grid-connected Rooftop Solar Scheme (Phase II) in 2019. The scheme aims to produce solar power by installing solar PV panels on the roofs of houses. The Government of India previously set the goal of installing 40,000 MW of Rooftop Solar (RTS) Power by 2022.
- However, in January 2023, India's Rooftop Solar (RTS) program received a four-year extension and aimed to accomplish its target of 40 GW rooftop solar (RTS) capacity addition by March 2026. This program is expected to achieve India's total solar energy capacity target significantly.
- Therefore, with increased investment in solar PV and changing government regulations, coupled with upcoming projects, the solar PV segment is expected to be the largest market during the forecast period.
North America to Dominate the Market
- The North American DERMS market is further expected to be the largest market during the forecast period, supported by the United States and Canada, which have more than a million distributed generation units.
- Despite enough power generation and accessibility of transmission and distribution networks, power outages are caused in some areas of the region due to natural disasters, such as flooding and storms. The use of remote power systems, such as DERMS, to regulate distributed energy systems is likely to mitigate the issue.
- The United States has set a road map to achieve renewable energy targets. The federal government and many state governments have implemented policies and programs to promote the adoption of solar energy. These incentives include tax credits, grants, rebates, and renewable portfolio standards that need utilities to receive a certain percentage of their energy from renewable sources like solar.
- Moreover, as the number of solar projects increases, the companies increase demand for distributed energy resources management systems in the country.
- According to the US Energy Information Administration (EIA), the country's small-scale solar capacity grew from 7.3 GW in 2014, when they began publishing these estimates, to 39.5 GW in 2022. Small-scale solar accounts for approximately one-third of all solar capacity in the United States.
- According to the International Energy Agency (IEA), electric vehicle sales in the country have increased significantly in recent years between 2021 and 2022; the cumulative sales of PHEV and BEV increased by more than 27,000 units, whereas in the past decade, sales increased by almost 60 folds signifying the increasing adoption of electric vehicles in the country.
- Similarly, Canada's publicly available electric vehicle (EV) charging infrastructure is on a steady rise, as indicated by data compiled by Electric Autonomy. As of March 1, 2023, Natural Resources Canada (NRCan) statistics revealed that Canadian EV users can avail themselves of at least 20,478 charging connectors distributed across 8,732 charging station sites nationwide. This represents a substantial percentage growth rate of 30% since the beginning of 2022.
- Therefore, based on these factors, North America is likely to be the largest market for distributed energy resource management systems during the forecast period.
Distributed Energy Resource Management System (DERMS) Industry Overview
The distributed energy resource management system market is semi-fragmented. Some of the major players in the market (in no particular order) include General Electric Company, Siemens AG, ABB Ltd, Schneider Electric SE, and Engie SA.
Additional Benefits:
- The market estimate (ME) sheet in Excel format
- 3 months of analyst support
TABLE OF CONTENTS
1 INTRODUCTION
- 1.1 Scope of the Study
- 1.2 Market Definition
- 1.3 Study Assumptions
2 EXECUTIVE SUMMARY
3 RESEARCH METHODOLOGY
4 MARKET OVERVIEW
- 4.1 Introduction
- 4.2 Market Size and Demand Forecast, till 2029
- 4.3 Recent Trends and Developments
- 4.4 Government Policies and Regulations
- 4.5 Market Dynamics
- 4.5.1 Drivers
- 4.5.1.1 Increasing Shift Toward Renewables-based Distributed Power Generation
- 4.5.1.2 Rising Investments in Smart Grid
- 4.5.2 Restraints
- 4.5.2.1 Expansion and Upgradation of Centralized Grid
- 4.5.1 Drivers
- 4.6 Supply Chain Analysis
- 4.7 Porter's Five Forces Analysis
- 4.7.1 Bargaining Power of Suppliers
- 4.7.2 Bargaining Power of Consumers
- 4.7.3 Threat of New Entrants
- 4.7.4 Threat of Substitute Products and Services
- 4.7.5 Intensity of Competitive Rivalry
5 MARKET SEGMENTATION
- 5.1 By Technology
- 5.1.1 Solar Photovoltaic (PV)
- 5.1.2 Electric Vehicles
- 5.1.3 Microgrids
- 5.1.4 Other Technologies
- 5.2 By End User
- 5.2.1 Industrial
- 5.2.2 Residential
- 5.2.3 Commercial
- 5.3 By Geography
- 5.3.1 North America
- 5.3.1.1 United States
- 5.3.1.2 Canada
- 5.3.1.3 Rest of North America
- 5.3.2 Europe
- 5.3.2.1 Germany
- 5.3.2.2 Italy
- 5.3.2.3 France
- 5.3.2.4 United Kingdom
- 5.3.2.5 Rest of Europe
- 5.3.3 Asia-Pacific
- 5.3.3.1 India
- 5.3.3.2 China
- 5.3.3.3 Japan
- 5.3.3.4 South Korea
- 5.3.3.5 Rest of Asia-Pacific
- 5.3.4 South America
- 5.3.4.1 Brazil
- 5.3.4.2 Argentina
- 5.3.4.3 Rest of South America
- 5.3.5 Middle East and Africa
- 5.3.5.1 United Arab Emirates
- 5.3.5.2 Saudi Arabia
- 5.3.5.3 Saudi Arabia
- 5.3.5.4 Rest of Middle East and Africa
- 5.3.1 North America
6 COMPETITIVE LANDSCAPE
- 6.1 Mergers and Acquisitions, Joint Ventures, Collaborations, and Agreements
- 6.2 Strategies Adopted by Leading Players
- 6.3 Company Profiles
- 6.3.1 General Electric Company
- 6.3.2 Siemens AG
- 6.3.3 ABB Ltd
- 6.3.4 Schneider Electric SE
- 6.3.5 Oracle Corporation
- 6.3.6 Uplight Inc.
- 6.3.7 Doosan Corporation
- 6.3.8 Open Access Technology International Inc.
- 6.3.9 Mitsubishi Electric Corporation
- 6.3.10 Emerson Electric Co.
- 6.3.11 Engie SA
7 MARKET OPPORTUNITIES AND FUTURE TRENDS
- 7.1 Micro Grid As A Service
02-2729-4219
+886-2-2729-4219
 2026年全球分散式能源资源管理系统市场报告2026年全球分散式能源资源管理系统(DERMS)市场报告
 分散式能源资源管理系统 (DERMS) 市场规模、占有率及预测:依技术(人工智慧优化型、规则型)、分散式能源类型(太阳能发电、电池储能、电动车)和应用(虚拟电厂、微电网)划分 - 全球预测 (2026-2036)
 分散式能源资源管理系统市场-2026-2031年预测
 分散式能源资源管理系统 (DERMS) 市场规模、份额和成长分析(按类型、软体、应用、最终用户和地区划分)—产业预测,2026-2033 年
 分散式能源资源管理系统市场按组件、技术、连接、应用和部署模式划分 - 2025-2030 年全球预测
 分散式能源管理系统 (DERMS) 的全球市场:按产品、按应用、按最终用户、按地区 - 预测至 2029 年
 分散式能源管理系统的全球市场(按组件、按应用、按最终用户、按地区):趋势分析、竞争格局、未来预测(2019-2030)
 分散式能源管理系统 (DERMS) 市场,按组件、按应用、最终用户、按国家和地区划分 - 2024-2032 年行业分析、市场规模、市场份额和预测
 併网户用微型逆变器市场机会、成长动力、产业趋势分析及2024年至2032年预测
▼