


 |
市场调查报告书
商品编码
1690741
日本资料中心:市场占有率分析、产业趋势、成长预测(2025-2030 年)Japan Data Center - Market Share Analysis, Industry Trends & Statistics, Growth Forecasts (2025 - 2030) |
||||||
※ 本网页内容可能与最新版本有所差异。详细情况请与我们联繫。
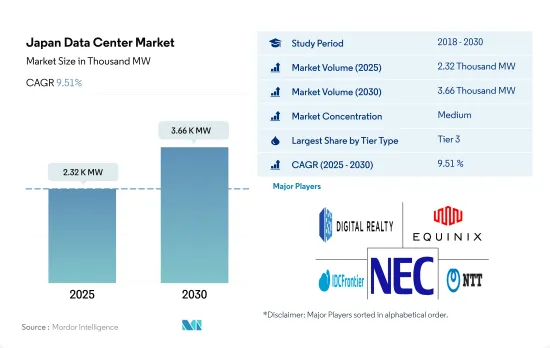
日本资料中心市场规模预估2025年达到2,320兆瓦,2030年达到3,660兆瓦,预估复合年增长率为9.51%。
预计主机託管收益将在 2025 年达到 25.115 亿美元,到 2030 年将达到 49.815 亿美元,预测期内(2025-2030 年)的复合年增长率为 14.68%。
到 2023 年, 层级 3资料中心将占据大部分份额,而层级 4 资料中心在整个预测期内将实现最快的成长。
- 3层级资料中心最受 SMB(中小型企业)的青睐,因为它们提供更好的冗余保护。执行时间比第 2层级显着增加,层级3 层每年提供 99.982% 的执行时间。预计该部分将从 2022 年的 1,309.25 兆瓦成长到 2029 年的 1,905.47 兆瓦,复合年增长率为 5.51%。这些资料中心主要由大型企业选择。
- 由于其效能、低停机时间和 99.99% 的执行时间, 层级 4 设施是大型企业下一个最受欢迎的资料中心。然而,由于其长期财务和营运永续性,大多数设施仍然青睐层级 3资料中心。 层级 3 是各行业采用最广泛的标准。然而,预计最大的成长率将来自层级 4 设施。
- 由于停机时间较长且冗余度较低,层级和层级资料中心最不受欢迎,但新兴企业通常更喜欢这些资料中心。不过,在日本,新兴企业也更青睐层级资料中心。目前,日本还没有层级 1 或层级 2 认证设施,预计这一趋势在预测期内仍将持续下去。
日本资料中心的趋势
智慧型手机普及率的提高和新电子商务平台的出现正在推动市场
- 预计到 2022 年,日本智慧型手机用户数量将达到 1.071 亿。预计到 2029 年,人口将达到 1.1777 亿,预测期内复合年增长率为 1.3%。
- 到2021年,日本家庭的智慧型手机普及率将接近89%。近年来,人们使用行动互联网的平均长度不断增加,为电子商务等相关行业带来了机会。
- 随着网路购物平台的出现,中小型企业也开始转向线上付款并在电子商务领域实现数位化存在。规模更大、老字型大小企业也将电子商务平台与传统商业模式结合使用。例如,2022年4月,总部位于东京的PVC产业领先特种稳定剂供应商Westlake Akishima推出了一个新的电子商务平台,为买家提供安全且方便的线上购买体验。这些发展正在塑造电子商务和线上付款生态系统,影响日本的行动付款。
主要行动电话营运商扩大 5G 部署以及政府对该领域的支援将推动资料中心市场的发展。
- 2019 年 4 月,日本政府向三家行动电话业者(NTT Docomo、KDDI au 和 SoftBank)以及新进业者乐天行动分配了 5G 频率。未来几年,日本四大通讯业者预计将投入超过140亿美元的资本支出来建设5G网络,包括对基地台、伺服器和光纤的投资。
- 自2021年初以来,日本行动通讯业者一直在加速推出5G。软银的目标是到2022年3月底部署超过5万个5G基地台,达到90%的人口覆盖率。 KDDI au 的目标是将基地台从 2021 年 3 月的 10,000 个增加到一年后的 50,000 个。 NTT Docomo 将在 2021 年期间扩展其 5G 网络,目标到 6 月达到 10,000 个基地台,到 2022 年 3 月底达到基地台,使用新的高速 5G 频段实现 55% 的人口覆盖率。
- 内务部的目标是继续推动日本的5G体验。目标是到2024年3月底实现98%人口的5G覆盖。总体而言,日本正在寻求为5G服务提供更多频谱。
日本资料中心产业概况
日本资料中心市场适度整合,前五大公司占41.74%。市场的主要企业包括 Digital Realty Trust Inc.、Equinix Inc.、IDC Frontier Inc.(软银集团)、NEC Corporation 和 NTT Ltd。
其他福利
- Excel 格式的市场预测 (ME) 表
- 3个月的分析师支持
目录
第一章执行摘要和主要发现
第二章 报告要约
第三章 引言
- 研究假设和市场定义
- 研究范围
- 调查方法
第四章 市场展望
- 负载能力
- 占地面积
- 主机代管收入
- 安装的机架数量
- 机架空间利用率
- 海底电缆
第五章 产业主要趋势
- 智慧型手机用户数量
- 每部智慧型手机的资料流量
- 行动资料速度
- 宽频资料速度
- 光纤连接网路
- 法律规范
- 日本
- 价值炼和通路分析
第六章市场区隔
- 热点
- 大阪
- 东京
- 其他中东和非洲地区
- 资料中心规模
- 大规模
- 超大规模
- 中等规模
- 超大规模
- 小规模
- 层级类型
- 1层级和2级
- 层级
- 层级
- 吸收量
- 未使用
- 使用
- 按主机託管类型
- 超大规模
- 零售
- 批发的
- 按最终用户
- BFSI
- 云
- 电子商务
- 政府
- 製造业
- 媒体与娱乐
- 电信
- 其他的
第七章竞争格局
- 市场占有率分析
- 商业状况
- 公司简介.
- AirTrunk Operating Pty Ltd
- Arteria Networks Corporation
- Colt Technology Services
- Digital Edge (Singapore) Holdings Pte Ltd
- Digital Realty Trust Inc.
- Equinix Inc.
- IDC Frontier Inc.(SoftBank Group)
- NEC Corporation
- netXDC(SCSK Corporation)
- NTT Ltd
- Telehouse(KDDI Corporation)
- Zenlayer Inc.
第八章:CEO面临的关键策略问题
第九章 附录
- 世界概况
- 概述
- 五力分析框架
- 全球价值链分析
- 全球市场规模和DRO
- 资讯来源及延伸阅读
- 图表清单
- 关键见解
- 资料包
- 词彙表
The Japan Data Center Market size is estimated at 2.32 thousand MW in 2025, and is expected to reach 3.66 thousand MW by 2030, growing at a CAGR of 9.51%. Further, the market is expected to generate colocation revenue of USD 2,511.5 Million in 2025 and is projected to reach USD 4,981.5 Million by 2030, growing at a CAGR of 14.68% during the forecast period (2025-2030).
Tier 3 data center accounted for majority share in terms of volume in 2023, Tier 4 is fastest growing through out the forecasted period
- Tier 3 data centers are mostly preferred by SMBs (small and medium businesses) for their far superior redundancy protection offerings. There is a significant jump in uptime from tier 2, with tier 3 offering annual uptime of 99.982%. The segment is expected to grow from 1,309.25 MW in 2022 to 1,905.47 MW by 2029, registering a CAGR of 5.51%. These data centers are mainly opted for by large companies.
- Tier 4 facilities are the next most preferred data centers by large businesses due to their performance, lower downtime, and 99.99% uptime. However, the majority of facilities still prefer tier 3 data centers due to their long-term financial and operational sustainability. Tier 3 is the most widely adopted standard across the industry. However, the growth rate for tier 4 facilities is expected to be the largest.
- Tier 1 & 2 data centers are the least preferred due to their higher downtime durations and low redundancies, but start-up companies usually prefer these data centers. However, in Japan, start-up companies also prefer tier 3 data center facilities. Currently, in Japan, there are no facilities certified with Tier 1 and Tier 2, and this trend is expected to continue during the forecast period.
Japan Data Center Market Trends
Rising smartphone penetration rate and emergence of new e-commerce platform in the country would drive the market
- The total number of smartphone users in Japan was 107.1 million in 2022. It is expected to witness a CAGR of 1.3% during the forecast period, reaching 117.77 million by 2029.
- In 2021, the smartphone penetration rate among households in Japan was close to 89%. The average time people spend on mobile internet use has increased in recent years, offering business opportunities to related industries, such as e-commerce.
- With the emergence of online shopping platforms, small businesses are also switching to online modes of payment and digital presence in the e-commerce world. The big and well-established companies also incorporate e-commerce platforms and the traditional form of business. For instance, in April 2022, Westlake Akishima, a Tokyo-based major supplier of specialty stabilizers for the PVC industry, announced a new e-commerce platform, extending the online buying experience to its buyer with security and convenience. Such developments are shaping the e-commerce and online payment ecosystem, impacting mobile payments in Japan.
Expansion of 5G roll out by major mobile operators coupled with government support in same segment would drive the data center market
- The Japanese government assigned the three mobile operators in Japan - NTT Docomo, KDDI au, and Softbank, as well as the new arrival Rakuten Mobile, with 5G spectrum in April 2019. In the coming years, the four Japanese carriers are expected to spend more than USD 14 billion in capital expenditures, including investments in base stations, servers, and fiber optics, to build their 5G networks.
- Since the start of 2021, Japan's mobile operators have been accelerating their 5G rollout. SoftBank aimed to deploy over 50,000 5G base stations and reach 90% population coverage by the end of March 2022. KDDI au aims to boost from just 10,000 base stations in March 2021 to 50,000 a year later. NTT DoCoMo was expanding its 5G network during 2021, aiming to reach 10,000 base stations by June and 20,000 by the end of March 2022, with 55% population coverage using the new high-speed 5G spectrum.
- The Ministry of International Affairs and Communications aims to continue moving the Japanese 5G experience forward. It set a target of 98% 5G population coverage by the end of March 2024. Overall, Japan aims to boost the amount of spectrum available for 5G services.
Japan Data Center Industry Overview
The Japan Data Center Market is moderately consolidated, with the top five companies occupying 41.74%. The major players in this market are Digital Realty Trust Inc., Equinix Inc., IDC Frontier Inc. (SoftBank Group), NEC Corporation and NTT Ltd (sorted alphabetically).
Additional Benefits:
- The market estimate (ME) sheet in Excel format
- 3 months of analyst support
TABLE OF CONTENTS
1 EXECUTIVE SUMMARY & KEY FINDINGS
2 REPORT OFFERS
3 INTRODUCTION
- 3.1 Study Assumptions & Market Definition
- 3.2 Scope of the Study
- 3.3 Research Methodology
4 MARKET OUTLOOK
- 4.1 It Load Capacity
- 4.2 Raised Floor Space
- 4.3 Colocation Revenue
- 4.4 Installed Racks
- 4.5 Rack Space Utilization
- 4.6 Submarine Cable
5 Key Industry Trends
- 5.1 Smartphone Users
- 5.2 Data Traffic Per Smartphone
- 5.3 Mobile Data Speed
- 5.4 Broadband Data Speed
- 5.5 Fiber Connectivity Network
- 5.6 Regulatory Framework
- 5.6.1 Japan
- 5.7 Value Chain & Distribution Channel Analysis
6 MARKET SEGMENTATION (INCLUDES MARKET SIZE IN VOLUME, FORECASTS UP TO 2030 AND ANALYSIS OF GROWTH PROSPECTS)
- 6.1 Hotspot
- 6.1.1 Osaka
- 6.1.2 Tokyo
- 6.1.3 Rest of Japan
- 6.2 Data Center Size
- 6.2.1 Large
- 6.2.2 Massive
- 6.2.3 Medium
- 6.2.4 Mega
- 6.2.5 Small
- 6.3 Tier Type
- 6.3.1 Tier 1 and 2
- 6.3.2 Tier 3
- 6.3.3 Tier 4
- 6.4 Absorption
- 6.4.1 Non-Utilized
- 6.4.2 Utilized
- 6.4.2.1 By Colocation Type
- 6.4.2.1.1 Hyperscale
- 6.4.2.1.2 Retail
- 6.4.2.1.3 Wholesale
- 6.4.2.2 By End User
- 6.4.2.2.1 BFSI
- 6.4.2.2.2 Cloud
- 6.4.2.2.3 E-Commerce
- 6.4.2.2.4 Government
- 6.4.2.2.5 Manufacturing
- 6.4.2.2.6 Media & Entertainment
- 6.4.2.2.7 Telecom
- 6.4.2.2.8 Other End User
7 COMPETITIVE LANDSCAPE
- 7.1 Market Share Analysis
- 7.2 Company Landscape
- 7.3 Company Profiles (includes Global Level Overview, Market Level Overview, Core Business Segments, Financials, Headcount, Key Information, Market Rank, Market Share, Products and Services, and Analysis of Recent Developments).
- 7.3.1 AirTrunk Operating Pty Ltd
- 7.3.2 Arteria Networks Corporation
- 7.3.3 Colt Technology Services
- 7.3.4 Digital Edge (Singapore) Holdings Pte Ltd
- 7.3.5 Digital Realty Trust Inc.
- 7.3.6 Equinix Inc.
- 7.3.7 IDC Frontier Inc. (SoftBank Group)
- 7.3.8 NEC Corporation
- 7.3.9 netXDC (SCSK Corporation)
- 7.3.10 NTT Ltd
- 7.3.11 Telehouse (KDDI Corporation)
- 7.3.12 Zenlayer Inc.
- 7.4 LIST OF COMPANIES STUDIED
8 KEY STRATEGIC QUESTIONS FOR DATA CENTER CEOS
9 APPENDIX
- 9.1 Global Overview
- 9.1.1 Overview
- 9.1.2 Porter's Five Forces Framework
- 9.1.3 Global Value Chain Analysis
- 9.1.4 Global Market Size and DROs
- 9.2 Sources & References
- 9.3 List of Tables & Figures
- 9.4 Primary Insights
- 9.5 Data Pack
- 9.6 Glossary of Terms
 2025年全球资料中心资讯技术(IT)设备市场报告2025年全球资料中心迁移市场报告2025年全球配置自动化市场报告
 全球配电中心市场:依类型、应用和地区划分 - 市场规模、行业趋势、机会分析和预测(2025-2033 年)
 资料中心 IT 资产处置市场规模、占有率、成长及全球产业分析:依类型、应用和地区划分的洞察,以及 2024 年至 2032 年的预测
 资料中心设备及基础设施市场:2025-2030
 高阶主管简报:2025 年第四季资料中心迁移市场-2025-2030 年预测
 AI资料中心的设备投资的明细和未来预测
 全球资料中心服务市场按服务类型、设施服务、IT 服务、专业咨询与认证、层级类型、资料中心规模与容量、资料中心类型、企业资料中心和地区划分 - 预测至 2030 年