


 |
市场调查报告书
商品编码
1940766
美国零担货运 (LTL) 市场份额分析、行业趋势和统计数据以及成长预测 (2026-2031)United States Less Than-Truck-Load (LTL) - Market Share Analysis, Industry Trends & Statistics, Growth Forecasts (2026 - 2031) |
||||||
※ 本网页内容可能与最新版本有所差异。详细情况请与我们联繫。
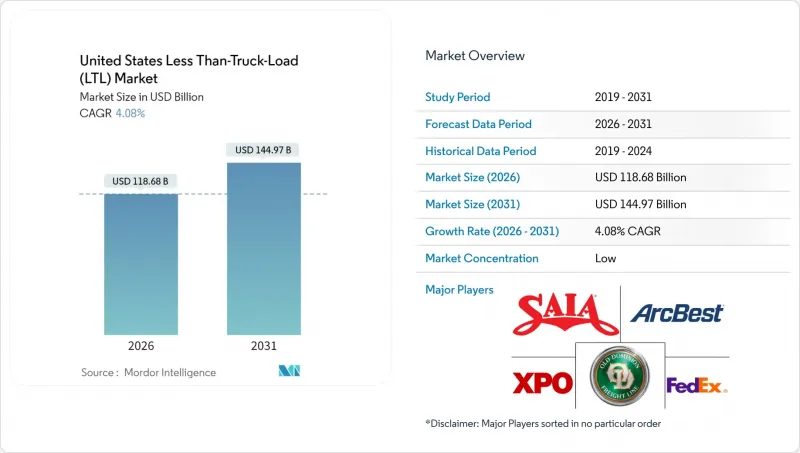
美国零担货运 (LTL) 市场预计到 2026 年将达到 1,186.8 亿美元,高于 2025 年的 1,140.3 亿美元。
预计到 2031 年将达到 1,449.7 亿美元,2026 年至 2031 年的复合年增长率为 4.08%。
电子商务履约、国内製造业的回归以及全通路零售策略正在重塑运输业格局,而主要都市货运站的运力限制已将洛杉矶和新泽西等市场的平均仓库租金推高至每平方英尺8美元以上。由于司机短缺导致人事费用上升、能源价格波动以及Yellow Corp.于2023年退出市场后产业整合加速,加剧了竞争环境,促使区域性承运商收购破产重组后的货运站。儘管根据《基础设施投资与就业法案》(IIJA)核准的投资将用于建造卡车专用车道和港口改造,从而提高网路通行效率,但东海岸和墨西哥湾沿岸沿岸的劳工动盪导致货运路线週期性变更,使得短期服务可靠性存在不确定性。这些因素共同增强了美国零担货运(LTL)市场的韧性,因为托运人优先考虑运输方式的柔软性、详细的运输资讯以及技术驱动的定价模式。
美国零担货运 (LTL) 市场趋势与洞察
电子商务履约的成长
预计到2024年,美国零售电商销售额将超过1兆美元,零售商正越来越多地将库存设在人口中心附近,以便实现一到两天的配送。这种地理多元化推动了中等重量货物的运输频率增加,这些货物无法纳入小型包裹网络,从而扩大了美国零担货运市场的潜在基本客群。像PITT OHIO这样的托运人正在利用人工智慧优化路线,降低25%的人事费用,并缩短服务时间。家具、家电和办公设备的住宅配送受益于专业的零担货运最后一公里服务,这推动了对升降尾板设施和高端服务能力的持续投资。随着墨西哥产品进入北美大都会圈地区的配送范围,与近岸外包相关的跨境电商将进一步提升货运量。从2025年到2030年,随着零售商寻求以具有竞争力的价格实现稳定的两天送达服务,美国零担货运市场仍将是全通路策略的重要组成部分。
製造业回流主导的国内製造业復苏
超过9,100亿美元的联邦工业激励措施正在推动汽车、航太、医疗设备和电子产品生产回流美国,并将生产活动集中在35号州际公路及类似走廊沿线。墨西哥预计在2024年成为美国最大的贸易伙伴,这将推动跨境卡车运输量的成长,而精通海关文件和边境运输的零担货运公司将从中受益。 Averitt公司扩建位于圣安东尼奥的设施(占地85,000平方英尺,拥有80个交叉装卸货位)正是利用资产布局来抓住这一增长机会的绝佳例证。附近工厂稳定的零件供应提高了物流密度,为拥有战略性枢纽的承运商提供了更优的网路经济效益和定价优势。因此,美国小包裹运输市场在区域化供应链中扮演越来越重要的角色,这些供应链能够抵御跨太平洋运输中断的影响。
司机短缺和劳动力老化
药物和酒精检测资讯交换中心的实施可能会导致多达17.7万名司机失业,而目前约有三分之一的驾驶人即将退休,这可能会进一步减少可用劳动力。为了应对这一局面,货运公司正在提高工资(例如,Averitt公司计划在2025年将其危险品运输司机的薪水从每英里0.60美元提高到0.64美元),并将20%的利润分配给员工退休帐户以提高员工留任率。然而,薪资上涨推高了营运比率,迫使货运公司重新思考公路规划、提高装载率,并透过实施车道维持系统等驾驶辅助技术来延长驾驶人的职业生涯。儘管货运供需环境良好,但持续的招募挑战仍限制着美国小型包裹运输市场的成长。
细分市场分析
到2025年,批发和零售业将占美国零担货运市场的34.56%,预计2026年至2031年将以5.13%的复合年增长率增长,增长速度超过其他所有行业,因为零售商正加速将商品囤积在更靠近消费地的地方。製造业仍是第二大贡献者,这得益于零件透过内陆枢纽向北近岸外包。建筑业、农业和能源产业虽然存在季节性波动,但它们共同提高了次市场的线路密度,否则这些市场将面临运力失衡的问题。
由于零售业履约需要透过微型仓配和暗店模式快速补货,中等重量的货物越来越多地采用零担运输(LTL),而非整车运输或小包裹运输。人工智慧增强的需求预测降低了大型连锁店的库存持有成本,但也导致运输频率增加,最终扩大了美国零担运输市场。製造业货物,特别是汽车零件和机械,平衡了南北运输路线,减少了空驶里程,并支持了网路经济效益。因此,美国零担运输业保持了稳定的收入结构,并透过垂直多元化降低了该行业的周期性波动。
其他福利:
- Excel格式的市场预测(ME)表
- 分析师支持(3个月)
目录
第一章 引言
- 研究假设和市场定义
- 调查范围
第二章调查方法
第三章执行摘要
第四章 市场情势
- 市场概览
- 按经济活动分類的GDP分配
- 按经济活动分類的GDP成长
- 经济表现及概览
- 电子商务产业的趋势
- 製造业趋势
- 运输和仓储业的GDP
- 物流绩效
- 道路长度
- 出口趋势
- 进口趋势
- 燃油价格趋势
- 卡车运输营运成本
- 卡车运输车队规模(按类型)
- 主要卡车供应商
- 公路货运量趋势
- 公路货运价格趋势
- 透过交通方式分享
- 通货膨胀
- 法律规范
- 价值炼和通路分析
- 市场驱动因素
- 电子商务履约的成长
- 製造业回流主导的国内製造业復苏
- 全通路零售网路优化
- 将都市区零售地产改造为交叉转运微型枢纽
- 透过 API 支援将运输方式从小包裹转换为零担运输(适用于中小托运人)
- 《基础建设投资与就业法案》(IIJA) 卡车专用道投资提升零担货运可靠性
- 市场限制
- 司机短缺和劳动力老化
- 柴油价格波动
- 主要都会区面临严重的码头运能限制
- 仓库工会化的连锁反应
- 市场创新
- 波特五力分析
- 新进入者的威胁
- 买方的议价能力
- 供应商的议价能力
- 替代品的威胁
- 竞争对手之间的竞争
第五章 市场规模与成长预测
- 终端用户产业
- 农业、渔业、林业
- 建设业
- 製造业
- 石油天然气、采矿和采石
- 批发和零售
- 其他的
- 目的地
- 国内的
- 国际的
第六章 竞争情势
- 市场集中度
- 关键策略倡议
- 市占率分析
- 公司简介
- A. Duie Pyle, Inc.
- ArcBest
- Averitt Express, Inc.
- CH Robinson
- Day & Ross
- Daylight Transport, LLC
- Dayton Freight Lines, Inc.
- DHL Group
- Estes Express Lines
- Fastfrate Inc.
- FedEx
- Knight-Swift Transportation Holdings Inc.
- Landstar System Inc.
- Oak Harbor Freight Lines, Inc.
- Old Dominion Freight Line
- Pitt Ohio Transportation Group
- R+L Carriers, Inc.
- Roadrunner Freight
- Saia Inc.
- Schneider National, Inc.
- Southeastern Freight Lines
- TFI International Inc.
- United Parcel Service of America, Inc.(UPS)
- Ward Transport and Logistics Corporation
- Werner Enterprises Inc.
- XPO, Inc.
第七章 市场机会与未来展望
The United States Less than-Truck-Load market size in 2026 is estimated at USD 118.68 billion, growing from 2025 value of USD 114.03 billion with 2031 projections showing USD 144.97 billion, growing at 4.08% CAGR over 2026-2031.
E-commerce fulfillment, reshoring of domestic manufacturing, and omnichannel retail strategies are re-shaping shipment profiles, while capacity constraints in tier-1 metropolitan terminals have elevated average warehouse lease rates above USD 8 per square foot in markets such as Los Angeles and New Jersey. Rising labor costs linked to driver shortages, energy price volatility, and heightened consolidation following Yellow Corporation's 2023 exit are intensifying competitive dynamics and encouraging regional carriers to acquire terminals released by the bankruptcy estate. Investments authorized under the Infrastructure Investment and Jobs Act (IIJA) are earmarked for truck-only lanes and port upgrades that will enhance network fluidity, yet near-term service reliability remains sensitive to East and Gulf Coast labor disruptions that periodically reroute freight flows. Collectively, these factors reinforce the resilience of the United States Less than-Truck-Load market as shippers favor mode flexibility, granular visibility, and technology-enabled pricing models.
United States Less Than-Truck-Load (LTL) Market Trends and Insights
E-commerce Fulfillment Growth
United States retail e-commerce sales surpassed USD 1 trillion in 2024, prompting retailers to position inventory within one- to two-day ground zones around dense population centers. This geographic dispersion increases the frequency of medium-weight shipments unsuitable for parcel networks, thereby enlarging the addressable base of the United States Less than-Truck-Load market. Carriers such as PITT OHIO apply artificial-intelligence-driven route optimization to reduce labor costs by 25% and sharpen service windows. Residential deliveries of furniture, appliances, and office equipment yield higher margins when carried through specialized LTL final-mile services, encouraging ongoing investment in lift-gate equipment and white-glove capabilities. Cross-border e-commerce related to nearshoring further lifts volumes as Mexican-origin goods flow north into metropolitan delivery zones. As retailers seek consistent two-day performance at competitive rates, the United States Less than-Truck-Load market will remain integral to omnichannel fulfillment strategies across 2025-2030.
Reshoring-Led Domestic Manufacturing Rebound
Federal industrial incentives exceeding USD 910 billion stimulate the onshoring of automotive, aerospace, medical device, and electronics production, concentrating activity along the Interstate 35 corridor and similar arteries. Mexico ascended to the United States' top trading partner position in 2024, raising cross-border truck traffic that benefits LTL carriers adept at customs documentation and border drayage. Averitt's 85,000 ft2 San Antonio expansion featuring 80 cross-dock doors typifies asset deployment aimed at capturing this surge. Predictable component flows from nearshore plants allow density gains, translating into superior network economics and pricing leverage for carriers with strategically located terminals. The United States Less than-Truck-Load market consequently deepens its role in regionalized supply chains designed for resilience against trans-Pacific disruptions.
Driver Shortage and Aging Workforce
Drug and Alcohol Clearinghouse enforcement could remove up to 177,000 drivers, reducing the effective labor pool even as nearly one-third of current operators are near retirement age. Carriers counter by hiking pay-Averitt lifted hazmat driver rates from USD 0.60 to USD 0.64 per mile in 2025-and by channeling 20% of profits into employee retirement accounts to boost retention. Yet wage escalation inflates operating ratios, compelling carriers to refine linehaul planning, increase load factors, and introduce driver-assisting technology such as lane-keeping systems to lengthen career longevity. Persistent recruitment hurdles continue to weigh on the United States Less than-Truck-Load market growth trajectory despite healthy freight fundamentals.
Other drivers and restraints analyzed in the detailed report include:
- Omnichannel Retail Network Optimization
- Urban Retail Real-Estate Repurposed into Cross-Dock Micro-Hubs
- Acute Terminal-Capacity Constraints in Tier-1 Metros
For complete list of drivers and restraints, kindly check the Table Of Contents.
Segment Analysis
Wholesale and Retail Trade accounted for 34.56% of the United States less than-truck-load market size in 2025 and is advancing at a 5.13% CAGR between 2026-2031, outpacing every other vertical as retailers recalibrate inventory closer to consumption points. Manufacturing remains the second-largest contributor, buoyed by nearshoring that channels components northbound through inland hubs. Construction, Agriculture, and Energy add variability across seasons, yet together strengthen lane density in secondary markets where capacity would otherwise be imbalanced.
Retail fulfillment's requirement for rapid restocking of micro-fulfillment and dark-store formats means medium-weight loads ride LTL more often than truckload or parcel. AI-enhanced demand sensing has trimmed inventory carrying costs for large chains, yet it raises shipment frequency, a factor that ultimately expands the United States Less than-Truck-Load market. Manufacturing traffic, especially auto parts and machinery, keeps south-to-north routes balanced, reducing empty miles and undergirding network economics. The United States Less than-Truck-Load industry thus maintains a stable revenue mix, mitigating sector cyclicality through vertical diversification.
The United States Less Than-Truck-Load (LTL) Market Report is Segmented by End User Industry (Agriculture, Fishing, and Forestry, Construction, Manufacturing, Oil and Gas, Mining and Quarrying, Wholesale and Retail Trade, and Others), and Destination (Domestic and International). The Market Forecasts are Provided in Terms of Value (USD).
List of Companies Covered in this Report:
- A. Duie Pyle, Inc.
- ArcBest
- Averitt Express, Inc.
- C.H. Robinson
- Day & Ross
- Daylight Transport, LLC
- Dayton Freight Lines, Inc.
- DHL Group
- Estes Express Lines
- Fastfrate Inc.
- FedEx
- Knight-Swift Transportation Holdings Inc.
- Landstar System Inc.
- Oak Harbor Freight Lines, Inc.
- Old Dominion Freight Line
- Pitt Ohio Transportation Group
- R+L Carriers, Inc.
- Roadrunner Freight
- Saia Inc.
- Schneider National, Inc.
- Southeastern Freight Lines
- TFI International Inc.
- United Parcel Service of America, Inc. (UPS)
- Ward Transport and Logistics Corporation
- Werner Enterprises Inc.
- XPO, Inc.
Additional Benefits:
- The market estimate (ME) sheet in Excel format
- 3 months of analyst support
TABLE OF CONTENTS
1 Introduction
- 1.1 Study Assumptions and Market Definition
- 1.2 Scope of the Study
2 Research Methodology
3 Executive Summary
4 Market Landscape
- 4.1 Market Overview
- 4.2 GDP Distribution by Economic Activity
- 4.3 GDP Growth by Economic Activity
- 4.4 Economic Performance and Profile
- 4.4.1 Trends in E-Commerce Industry
- 4.4.2 Trends in Manufacturing Industry
- 4.5 Transport and Storage Sector GDP
- 4.6 Logistics Performance
- 4.7 Length of Roads
- 4.8 Export Trends
- 4.9 Import Trends
- 4.10 Fuel Pricing Trends
- 4.11 Trucking Operational Costs
- 4.12 Trucking Fleet Size by Type
- 4.13 Major Truck Suppliers
- 4.14 Road Freight Tonnage Trends
- 4.15 Road Freight Pricing Trends
- 4.16 Modal Share
- 4.17 Inflation
- 4.18 Regulatory Framework
- 4.19 Value Chain and Distribution Channel Analysis
- 4.20 Market Drivers
- 4.20.1 E-Commerce Fulfilment Growth
- 4.20.2 Reshoring-Led Domestic Manufacturing Rebound
- 4.20.3 Omnichannel Retail Network Optimisation
- 4.20.4 Urban Retail Real-Estate Repurposed into Cross-Dock Micro-Hubs
- 4.20.5 API-Enabled Parcel-To-LTL Mode Shift For SMB Shippers
- 4.20.6 Truck-Only Lane Investments Under the IIJA Boosting LTL Transit Reliability
- 4.21 Market Restraints
- 4.21.1 Driver Shortage and Ageing Workforce
- 4.21.2 Diesel-Price Volatility
- 4.21.3 Acute Terminal-Capacity Constraints in Tier-1 Metros
- 4.21.4 Warehouse Labour Unionisation Ripple-Effects
- 4.22 Technology Innovations in the Market
- 4.23 Porter's Five Forces Analysis
- 4.23.1 Threat of New Entrants
- 4.23.2 Bargaining Power of Buyers
- 4.23.3 Bargaining Power of Suppliers
- 4.23.4 Threat of Substitutes
- 4.23.5 Competitive Rivalry
5 Market Size and Growth Forecasts (Value, USD)
- 5.1 End User Industry
- 5.1.1 Agriculture, Fishing, and Forestry
- 5.1.2 Construction
- 5.1.3 Manufacturing
- 5.1.4 Oil and Gas, Mining and Quarrying
- 5.1.5 Wholesale and Retail Trade
- 5.1.6 Others
- 5.2 Destination
- 5.2.1 Domestic
- 5.2.2 International
6 Competitive Landscape
- 6.1 Market Concentration
- 6.2 Key Strategic Moves
- 6.3 Market Share Analysis
- 6.4 Company Profiles (Includes Global Level Overview, Market Level Overview, Core Segments, Financials as Available, Strategic Information, Market Rank/Share for Key Companies, Products and Services, and Recent Developments)
- 6.4.1 A. Duie Pyle, Inc.
- 6.4.2 ArcBest
- 6.4.3 Averitt Express, Inc.
- 6.4.4 C.H. Robinson
- 6.4.5 Day & Ross
- 6.4.6 Daylight Transport, LLC
- 6.4.7 Dayton Freight Lines, Inc.
- 6.4.8 DHL Group
- 6.4.9 Estes Express Lines
- 6.4.10 Fastfrate Inc.
- 6.4.11 FedEx
- 6.4.12 Knight-Swift Transportation Holdings Inc.
- 6.4.13 Landstar System Inc.
- 6.4.14 Oak Harbor Freight Lines, Inc.
- 6.4.15 Old Dominion Freight Line
- 6.4.16 Pitt Ohio Transportation Group
- 6.4.17 R+L Carriers, Inc.
- 6.4.18 Roadrunner Freight
- 6.4.19 Saia Inc.
- 6.4.20 Schneider National, Inc.
- 6.4.21 Southeastern Freight Lines
- 6.4.22 TFI International Inc.
- 6.4.23 United Parcel Service of America, Inc. (UPS)
- 6.4.24 Ward Transport and Logistics Corporation
- 6.4.25 Werner Enterprises Inc.
- 6.4.26 XPO, Inc.
7 Market Opportunities and Future Outlook
- 7.1 White-Space and Unmet-Need Assessment

