


 |
市场调查报告书
商品编码
1692439
中东和非洲LED照明:市场占有率分析、行业趋势和成长预测(2025-2030年)Middle East and Africa LED Lighting - Market Share Analysis, Industry Trends & Statistics, Growth Forecasts (2025 - 2030) |
||||||
价格
※ 本网页内容可能与最新版本有所差异。详细情况请与我们联繫。
简介目录
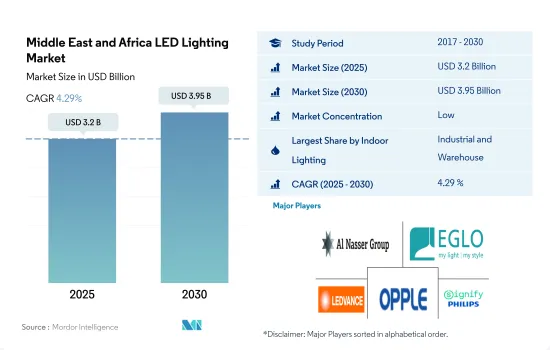
中东和非洲的 LED 照明市场规模预计在 2025 年为 32 亿美元,预计到 2030 年将达到 39.5 亿美元,预测期内(2025-2030 年)的复合年增长率为 4.29%。
工业和住宅领域的不断发展正在推动市场成长
- 从价值份额来看,2023年工业和仓储业将占据大部分市场份额,其次是商业和住宅业。中东经济高度依赖专用加工、生产和物流设施。此外,强劲的消费品需求和优惠的税收政策使得当地市场对外国工业和製造公司越来越有吸引力。随着我们从依赖石油和天然气出口转向更多元化的经济,健康的工业、製造业和物流业对于我们地区经济的未来至关重要。
- 就2023年的成交量份额而言,住宅领域将占大多数,其次是商业、工业和仓储。非洲各国政府正加强推动製造业和工业化发展,以刺激疫情后的经济成长。因此,外国投资竞争加剧,新的产业政策不断出台,经济特区在非洲大陆不断扩张。
- 由于油价上涨和经济成长,预计 2023 年中东房地产市场将保持活跃。目前规划或正在建设的房地产计划总价值估计为1.36兆美元。其中,沙乌地阿拉伯占64.5%,约8,770亿美元;阿联酋占21.6%,约2,930亿美元。同样,乌干达政府宣布计划将坎帕拉工业和商业园区(KIBP)扩大 400 万平方公尺,以促进工业化发展。由于上述案例,预计未来几年室内LED的需求将会成长。
中东和非洲LED照明市场趋势
家庭数量的增加将推动该地区 LED 的使用增加
- 截至2018年,中东和非洲人口为4.84亿,预计到2030年将达到约5亿。 2020年,阿布达比酋长国将建造超过92,800套住宅,其次是沙迦(41,000套)和杜拜(35,000套)。预计未来几年阿联酋将建造约 231,200 套住宅。新房间的建设可能会促进 LED 销售的成长。
- 在中东和非洲,典型的家庭规模超过五人。在沙乌地阿拉伯,大约一半的人口拥有自己的住房,总计 546 万户。截至 2020 年,以色列有 681,500 个五人或五人以上的家庭。一间房子若要住五个人,至少要有两个房间。以色列大多数人居住在单间公寓。随着家庭人口的增加,LED的销售量也在上升。
- 预计2022年中东和非洲地区的汽车产量将达233总合,2023年将达到245万辆。儘管仍处于早期阶段,但中东和非洲的电动车(EV)市场已显示出令人鼓舞的成长迹象。随着地方政府越来越意识到减少碳排放的必要性,正在通过法律来鼓励使用电动车。例如,阿拉伯联合大公国、沙乌地阿拉伯、巴林和阿曼已宣布净零目标。此外,该地区的几个国家正在提供税收优惠和补贴以鼓励购买电动车。由于电动车在该地区具有巨大的潜力,预计 LED 照明的需求将会上升。
人口成长和能源永续性宣传活动推动LED照明的使用增加
- 在中东和非洲,阿拉伯联合大公国 (UAE)、沙乌地阿拉伯和南非是收益和人口最多的国家。 2015年阿联酋的平均家庭规模约为4.2人,到2022年将上升至4.9人。 2021年南非人口约6,050万,人口成长率为1.2%至1.3%。同年,估计有 1800 万个家庭,平均每个家庭有 3.34 人。人口成长和家庭规模缩小导致对住宅的需求增加,从而推动该地区对 LED 照明的需求。
- 在 MEA,典型的家庭规模超过五人。沙乌地阿拉伯近一半的人口拥有自己的住房,2020 年统计的家庭数量为 546 万户。截至 2020 年,以色列有 681,500 户家庭,其中有 5 人或 5 人以上。一间房子若要住五个人,至少要有两个房间。以色列大多数人居住在单间公寓。随着家庭人口的增加,LED的销售量也在上升。
- 阿联酋最新的永续性宣传活动为指定品牌的 LED 灯泡提供高达 25% 的折扣,以鼓励当地人改用节能环保的照明。南非政府的 S&L 计划旨在透过实施最低能源性能标准 (MEPS)、标籤计划和奖励计划等措施和干预措施,将低效电子产品从市场上淘汰,并鼓励采用包括 LED 在内的高效技术。预计此类案例将进一步刺激该国对 LED 照明的需求。
中东和非洲LED照明产业概况
中东和非洲LED照明市场较为分散,前五大企业占比为18.51%。市场的主要企业有:Al Nasser Group、EGLO Leuchten GmbH、LEDVANCE GmbH(MLS)、OPPLE Lighting 和 Signify(飞利浦)(按字母顺序排列)。
其他福利
- Excel 格式的市场预测 (ME) 表
- 3个月的分析师支持
目录
第一章执行摘要和主要发现
第二章 报告要约
第三章 引言
- 研究假设和市场定义
- 研究范围
- 调查方法
第四章 产业主要趋势
- 汽车产量
- 人口
- 人均收入
- 汽车贷款利率
- 充电站数量
- 行驶车辆数
- LED进口总量
- 照明功耗
- #家庭数量
- 道路网络
- LED渗透率
- #体育场数量
- 园艺区
- 法律规范
- 室内照明
- 波湾合作理事会
- 南非
- 户外照明
- 波湾合作理事会
- 南非
- 汽车照明
- 波湾合作理事会
- 南非
- 室内照明
- 价值炼和通路分析
第五章市场区隔
- 室内照明
- 农业照明
- 商业照明
- 办公室
- 零售
- 其他的
- 工业/仓库
- 住宅照明
- 户外照明
- 公共设施
- 路
- 其他的
- 汽车实用照明
- 日间行车灯 (DRL)
- 方向指示器
- 头灯
- 倒车灯
- 红绿灯
- 尾灯
- 其他的
- 汽车照明
- 二轮车
- 商用车
- 搭乘用车
第六章 竞争格局
- 关键策略趋势
- 市场占有率分析
- 商业状况
- 公司简介
- ACUITY BRANDS, INC.
- Al Nasser Group
- EGLO Leuchten GmbH
- GRUPO ANTOLIN IRAUSA, SA
- HELLA GmbH & Co. KGaA(FORVIA)
- LEDVANCE GmbH(MLS Co Ltd)
- Marelli Holdings Co., Ltd.
- OPPLE Lighting Co., Ltd
- Signify(Philips)
- Valeo
第七章:CEO面临的关键策略问题
第 8 章 附录
- 世界概况
- 概述
- 五力分析框架
- 全球价值链分析
- 市场动态(DRO)
- 资讯来源及延伸阅读
- 图片列表
- 关键见解
- 数据包
- 词彙表
简介目录
Product Code: 91066
The Middle East and Africa LED Lighting Market size is estimated at 3.2 billion USD in 2025, and is expected to reach 3.95 billion USD by 2030, growing at a CAGR of 4.29% during the forecast period (2025-2030).
Increasing development in the industrial sector and residential sector drives market growth
- In terms of value share, in 2023, the industrial and warehouse segment accounted for the majority of the share, followed by commercial and residential. The Middle East economy relies heavily on purpose-built processing, production, and logistics facilities. In addition, the local market is becoming a magnet for foreign industrial and manufacturing companies due to strong demand for consumer goods and tax incentives. Healthy industrial, manufacturing, and logistics industries are critical for the future of the region's economy as it continues to transition from dependence on oil and gas exports to a more diversified economy.
- In terms of volume share, in 2023, the residential segment accounted for the majority of the share, followed by commercial and industrial and warehouse. Governments across Africa have stepped up efforts to boost manufacturing and industrialization to spur economic growth after the pandemic. This intensified competition for foreign investment, introducing new industrial policies and the subsequent expansion of Special Economic Zones (SEZs) across the continent.
- The Middle East real estate market was expected to remain strong in 2023 due to high oil prices and economic growth. The total value of real estate projects currently planned or under construction is estimated at USD 1.36 trillion. Saudi Arabia accounts for 64.5% of the total, or about USD 877 billion, followed by the United Arab Emirates, with 21.6% or USD 293 billion. Similarly, the Ugandan government has stepped up its efforts to promote industrialization by announcing plans to expand the Kampala Industrial and Business Park (KIBP) by 4 million square meters. The above instances are expected to create more demand for indoor LEDs in the coming years.
Middle East and Africa LED Lighting Market Trends
Increase in household size to bolster the growth of LED usage in the region
- The Middle East & Africa had a population of 484 million people as of 2018, with that number predicted to climb to around 500 million by 2030. In 2020, over 92.8 thousand homes were built in the emirate of Abu Dhabi, followed by 41 thousand in the emirate of Sharjah and 35 thousand in the emirate of Dubai. There are expected to be 231.2 thousand residences in the entire United Arab Emirates over the coming years. The building of new rooms will consequently boost sales of LEDs.
- In the Middle East and Africa, the typical household size exceeds five people. In Saudi Arabia, about half of the population owns a home, with 5.46 million households counted in the country. In Israel, there were 681.5 thousand homes with five or more people as of 2020. There must be more than two rooms in a house to accommodate five people. The majority of people in Israel live in studio apartments. Sales of LEDs have increased as a result of the growth in household sizes.
- In the Middle East and Africa, 2.33 million automobiles were produced in total in 2022, and 2.45 million were anticipated to be produced in 2023. Although it is still in its early stages, the electric vehicle (EV) market across the Middle East and African countries is already showing hopeful signs of growth. As local governments become more aware of the need to reduce their carbon footprint, they are passing legislation to promote the use of EVs. The United Arab Emirates, Saudi Arabia, Bahrain, and Oman, for instance, have announced their net-zero targets. Several countries in the region are also offering tax incentives and subsidies to promote the purchase of electric vehicles. Due to the enormous potential that EVs present in this region, it is projected that demand for LED lighting will rise.
Increasing population and energy sustainability campaign to promote higher use of LED lights
- In the MEA region, UAE, Saudi Arabia, and South Africa are the largest countries in terms of revenue and population. The United Arab Emirates' average size of households was around 4.2 persons in 2015, and by 2022, it had increased to 4.9 people per household. In 2021, South Africa had a population of approximately 60.5 million people, and the population has been growing at a rate between 1.2% and 1.3%. In the same year, the country had an estimated 18 million households, with an average household size of 3.34 persons. The growing population and reducing household size are generating the need for more houses, which is boosting the demand for LED illumination in the region.
- In MEA, the typical household size exceeds five people. In Saudi Arabia, about half of the population owns a home, and 5.46 million households were counted in 2020. In Israel, there were 681.5 thousand homes with five or more people as of 2020. There must be more than two rooms in a house to accommodate five people. The majority of people in Israel live in studio apartments. Sales of LEDs have increased as a result of the growth in household sizes.
- To encourage local people to switch to more energy-efficient and environmentally friendly lights, the UAE's latest sustainability campaign involves giving discounts of up to 25% on selected brand LED bulbs. The South African government's S&L program aims to remove inefficient electronic appliances from the market and encourage the adoption of efficient technologies, which include LEDs, by implementing measures/interventions such as minimum energy performance standards (MEPS), labeling programs, and incentive programs. Such instances are further expected to boost the demand for LED lighting in the country.
Middle East and Africa LED Lighting Industry Overview
The Middle East and Africa LED Lighting Market is fragmented, with the top five companies occupying 18.51%. The major players in this market are Al Nasser Group, EGLO Leuchten GmbH, LEDVANCE GmbH (MLS Co Ltd), OPPLE Lighting Co., Ltd and Signify (Philips) (sorted alphabetically).
Additional Benefits:
- The market estimate (ME) sheet in Excel format
- 3 months of analyst support
TABLE OF CONTENTS
1 EXECUTIVE SUMMARY & KEY FINDINGS
2 REPORT OFFERS
3 INTRODUCTION
- 3.1 Study Assumptions & Market Definition
- 3.2 Scope of the Study
- 3.3 Research Methodology
4 KEY INDUSTRY TRENDS
- 4.1 Automotive Production
- 4.2 Population
- 4.3 Per Capita Income
- 4.4 Interest Rate For Auto Loans
- 4.5 Number Of Charging Stations
- 4.6 Number Of Automobile On-road
- 4.7 Total Import Of Leds
- 4.8 Lighting Electricity Consumption
- 4.9 # Of Households
- 4.10 Road Networks
- 4.11 Led Penetration
- 4.12 # Of Stadiums
- 4.13 Horticulture Area
- 4.14 Regulatory Framework
- 4.14.1 Indoor Lighting
- 4.14.1.1 Gulf Cooperation Council
- 4.14.1.2 South Africa
- 4.14.2 Outdoor Lighting
- 4.14.2.1 Gulf Cooperation Council
- 4.14.2.2 South Africa
- 4.14.3 Automotive Lighting
- 4.14.3.1 Gulf Cooperation Council
- 4.14.3.2 South Africa
- 4.14.1 Indoor Lighting
- 4.15 Value Chain & Distribution Channel Analysis
5 MARKET SEGMENTATION (includes market size in Value in USD and Volume, Forecasts up to 2030 and analysis of growth prospects)
- 5.1 Indoor Lighting
- 5.1.1 Agricultural Lighting
- 5.1.2 Commercial
- 5.1.2.1 Office
- 5.1.2.2 Retail
- 5.1.2.3 Others
- 5.1.3 Industrial and Warehouse
- 5.1.4 Residential
- 5.2 Outdoor Lighting
- 5.2.1 Public Places
- 5.2.2 Streets and Roadways
- 5.2.3 Others
- 5.3 Automotive Utility Lighting
- 5.3.1 Daytime Running Lights (DRL)
- 5.3.2 Directional Signal Lights
- 5.3.3 Headlights
- 5.3.4 Reverse Light
- 5.3.5 Stop Light
- 5.3.6 Tail Light
- 5.3.7 Others
- 5.4 Automotive Vehicle Lighting
- 5.4.1 2 Wheelers
- 5.4.2 Commercial Vehicles
- 5.4.3 Passenger Cars
6 COMPETITIVE LANDSCAPE
- 6.1 Key Strategic Moves
- 6.2 Market Share Analysis
- 6.3 Company Landscape
- 6.4 Company Profiles (includes Global level Overview, Market level overview, Core Business Segments, Financials, Headcount, Key Information, Market Rank, Market Share, Products and Services, and analysis of Recent Developments)
- 6.4.1 ACUITY BRANDS, INC.
- 6.4.2 Al Nasser Group
- 6.4.3 EGLO Leuchten GmbH
- 6.4.4 GRUPO ANTOLIN IRAUSA, S.A.
- 6.4.5 HELLA GmbH & Co. KGaA (FORVIA)
- 6.4.6 LEDVANCE GmbH (MLS Co Ltd)
- 6.4.7 Marelli Holdings Co., Ltd.
- 6.4.8 OPPLE Lighting Co., Ltd
- 6.4.9 Signify (Philips)
- 6.4.10 Valeo
7 KEY STRATEGIC QUESTIONS FOR LED CEOS
8 APPENDIX
- 8.1 Global Overview
- 8.1.1 Overview
- 8.1.2 Porter's Five Forces Framework
- 8.1.3 Global Value Chain Analysis
- 8.1.4 Market Dynamics (DROs)
- 8.2 Sources & References
- 8.3 List of Tables & Figures
- 8.4 Primary Insights
- 8.5 Data Pack
- 8.6 Glossary of Terms
02-2729-4219
+886-2-2729-4219
 LED 照明和 OLED 照明:市场分析和製造趋势
 LED嵌灯市场报告:按应用和地区划分(2026-2034年)
 LED照明市场:2026-2032年全球市场预测(依产品类型、安装方式、技术、应用、最终用户及通路划分)相机LED照明市场:2026-2032年全球市场预测(依产品类型、照明类型、应用、最终用户及通路划分)
 2026-2030年全球LED照明市场LED面板灯市场:按安装方式、面板尺寸、产品类型、色温、应用和分销管道划分-全球预测,2026-2032年橱柜LED照明市场:依产品类型、安装类型、安装方式、应用、通路和最终用途划分-2026-2032年全球预测LED灯带控制器市场按应用、颜色类型、控制技术、分销管道、控制方式、安装方式和电压类型划分,全球预测(2026-2032年)
 柔性照明箔市场规模、份额和成长分析:按产品类型、材料类型、应用、最终用户、分销管道、地区和行业预测,2026-2033年
 LED照明市场分析及预测(至2035年):按类型、产品类型、服务、技术、组件、应用、形状、材质、最终用户和功能划分
▼