


 |
市场调查报告书
商品编码
1692450
亚太资料中心:市场占有率分析、产业趋势与成长预测(2025-2030 年)Asia-Pacific Data Center - Market Share Analysis, Industry Trends & Statistics, Growth Forecasts (2025 - 2030) |
||||||
※ 本网页内容可能与最新版本有所差异。详细情况请与我们联繫。
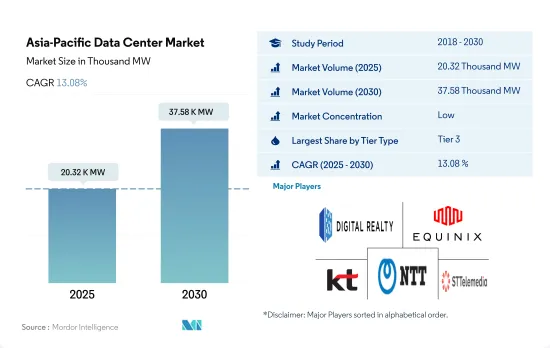
预计 2025 年亚太地区资料中心市场规模为 20,320 千瓦,到 2030 年将达到 37,580 千瓦,复合年增长率为 13.08%。
预计主机託管收益将在 2025 年达到 182.56 亿美元,到 2030 年将达到 404.622 亿美元,预测期内(2025-2030 年)的复合年增长率为 17.25%。
到 2023 年,Tier 3 资料中心将占据主要份额,而 Tier 4 资料中心将成为成长最快的部分
- 在亚太地区,Tier 3类型凭藉其显着的优势占据了大部分份额。这些层级具有高度冗余,具有多个电源和冷却路径。边缘和云端连接预计将推动三级成长。
- 在澳大利亚,纽卡斯尔市议会的智慧城市策略重点关注巨量资料、物联网和云端连接如何帮助城市变得更宜居和创新。在新冠肺炎疫情期间,人们普遍认识到云端处理是马来西亚数位化之旅的基础。阿里云等一级供应商使中小企业能够像大公司一样有效率地进行交易,帮助他们最大限度地利用其服务。
- 2022 年,亚太地区的 Tier 3 类型资料中心投入运营,IT 负载容量为 6,705.97 MW。预计该容量将从 2023 年的 8,522.04 MW 成长到 2029 年的 13,981.5 MW,复合年增长率为 8.60%。
- 预计 Tier 4 类型的复合年增长率为 20.40%。新兴国家正在采用 Tier-4 认证来实现容错和冗余。基于这个原因,开发中地区也正在采用 Tier 4 区域。例如,Supernap 泰国是该国唯一的 Tier 4 设施。
- 第 1 层和第 2 层段的成长速度最低,因为超过 70% 的总流量在伺服器之间移动。现代应用程式需要更多的资料在资料中心内以更快的速度传输,并且对延迟的容忍度更低。
预计到 2023 年,中国、澳洲和印度将占据大部分市场占有率。
- 中国和澳洲是亚太地区领先的资料中心市场。中国拥有全球最大的光纤网路以及独立的4G、5G网路。目前,全球已建成5G基地台91.6万个,连线数超过3.65亿,占全球5G连线数的70%至80%。对 OTT 服务和高显示格式的线上串流内容的需求不断增长,大大增加了资料消耗。中国没有 Netflix,但有当地 OTT 供应商,例如酷炫、腾讯影片、芒果 TV 和哔哩哔哩。 2021年线上串流媒体产业的市场规模预计约为340亿美元,并有望随着用户数量的增加而扩大。
- 澳洲也呈现类似的全球趋势,目前约有 10-12% 的数据是在集中式资料中心或云端之外创建和处理的,但预计到 2025 年这一比例将超过 65-70%。新冠疫情危机凸显了澳洲迫切需要数位基础设施来改善连通性。受高速网路服务需求不断增长以及政府致力于在国家宽频计划(NBN) 计画下积极扩展全国范围内的 FTTx (光纤到 x) 网路的推动,预计到 2025 年,光纤线路仍将占据固定宽频技术的主导地位。
- 投资方面,2022年8月,澳洲通讯业者Telstra选定了新的传输网路基础设施部署合作伙伴,以及一台可以同时铺设两条光缆的类似Mad Max的机器。
亚太数据中心市场趋势
5G 的扩展以及科技公司和大学之间在 5G ICT 技能方面日益加强的伙伴关係将推动资料中心市场的发展
- 透过智慧型手机存取的云端基础的应用程式是智慧型手机用户的主要成长市场趋势之一。行动宽频网路覆盖亚太地区96%的地区,12亿人使用行动网路服务。 2021年,智慧型手机普及率达74%。预计到 2025 年这一比例将上升至 84%。预计到 2025 年行动用户普及率将达到 62%。
- 行动应用程式数量达890万个,中国占40%。截至2021年12月,我国行动网路用户普及率达94.6%,行动上网应用程式总合达442个。 5G 网路在民众中的普及率不断提高,促进了 5G 设备的销售。 5G 的可用性参差不齐,主要在东南亚。新加坡和印尼等国家已经部署 5G 一段时间了,并继续为公民和组织创新使用案例。
- 到2022年,5G预计将覆盖泰国85%以上的人口。新的伙伴关係和发展正在推动 5G 在智慧型手机中的普及。例如,2022 年 7 月,爱立信与泰国国王科技大学吞武里分校(KMUTT)宣布建立合作关係,帮助泰国学生培养面向未来的 5G ICT 技能。家庭和企业有线宽频连线的无线替代方案是 5G 早期的关键使用案例之一,尤其是在宽频市场服务不足或欠发达的地区。
亚太国家光纤到府/建筑 (FTTH/B) 服务的成长将推动该地区对资料中心的需求
- 平均宽频网路连线的下载速度至少为 25Mbps,上传速度至少为 3Mbps。 FTTH/B服务正在巩固其作为亚太地区领先固定宽频技术的地位。到2026年,新加坡的FTTH/B线路占固定宽频线路总量的份额预计将达到98%以上,位居亚太地区最高。紧随新加坡之后的是越南、香港和马来西亚。
- 马来西亚通讯及多媒体部长表示,2023年将逐步淘汰铜线网路。政府的目标是将人口密集地区的宽频普及率提高至少五倍,目标是人口密集地区的宽频普及率达到98%左右,网路速度达到30Mbps或以上。
- 澳洲通讯业者Telstra选定了新的基础设施合作伙伴和一台类似「疯狂的麦斯」的机器,计划于2022年8月同时铺设两条光纤电缆。该营运商计划加快步伐,在以环境挑战着称的澳洲境内建设一张高容量数据传输网络,以满足日益增长的数据连接需求。亚太地区铜缆网路的退役推动了光纤连接的发展。铜线维护成本高,操作困难。据估计,与光纤网路相比,传统铜线网路的维护成本高出2-7倍,能源成本高出3-6倍,网路故障率高出5-10倍。
亚太资料中心产业概览
亚太资料中心市场较为分散,前五大企业占18.04%的市占率。该市场的主要企业有:Digital Realty Trust, Inc.、Equinix, Inc.、KT Corporation、NTT Ltd. 和 STT GDC Pte Ltd(按字母顺序排列)。
其他福利
- Excel 格式的市场预测 (ME) 表
- 3个月的分析师支持
目录
第一章执行摘要和主要发现
第二章 报告要约
第三章 引言
- 研究假设和市场定义
- 研究范围
- 调查方法
第四章 市场展望
- 负载能力
- 占地面积
- 主机代管收入
- 安装的机架数量
- 机架空间利用率
- 海底电缆
第五章 产业主要趋势
- 智慧型手机用户数量
- 每部智慧型手机的数据流量
- 行动数据速度
- 宽频数据速度
- 光纤连接网路
- 法律规范
- 澳洲
- 中国
- 香港
- 印度
- 印尼
- 日本
- 马来西亚
- 纽西兰
- 菲律宾
- 新加坡
- 韩国
- 台湾
- 泰国
- 越南
- 价值炼和通路分析
第六章市场区隔
- 资料中心规模
- 大规模
- 超大规模
- 中等规模
- 百万
- 小规模
- 等级类型
- 1级和2级
- 第 3 层
- 第 4 层
- 吸收量
- 未使用
- 使用
- 按主机託管类型
- 超大规模
- 零售
- 批发的
- 按最终用户
- BFSI
- 云
- 电子商务
- 政府
- 製造业
- 媒体与娱乐
- 电信
- 其他最终用户
- 国家
- 澳洲
- 中国
- 印度
- 印尼
- 日本
- 马来西亚
- 亚太地区其他国家
第七章竞争格局
- 市场占有率分析
- 商业状况
- 公司简介.
- AirTrunk Operating Pty Ltd
- Canberra Data Centers
- Chindata Group Holdings Ltd.
- Digital Realty Trust, Inc.
- Equinix, Inc.
- Keppel DC REIT Management Pte. Ltd.
- KT Corporation
- NEXTDC Ltd
- NTT Ltd.
- Princeton Digital Group
- Space DC Pte Ltd.
- STT GDC Pte Ltd
- LIST OF COMPANIES STUDIED
第八章:CEO面临的关键策略问题
第九章 附录
- 世界概况
- 概述
- 五力分析框架
- 全球价值链分析
- 全球市场规模和DRO
- 资讯来源及延伸阅读
- 图表清单
- 关键见解
- 数据包
- 词彙表
The Asia-Pacific Data Center Market size is estimated at 20.32 thousand MW in 2025, and is expected to reach 37.58 thousand MW by 2030, growing at a CAGR of 13.08%. Further, the market is expected to generate colocation revenue of USD 18,256 Million in 2025 and is projected to reach USD 40,462.2 Million by 2030, growing at a CAGR of 17.25% during the forecast period (2025-2030).
Tier 3 data center accounted for majority share in terms of volume in 2023; Tier 4 is the fastest-growing segment
- The Tier 3 type has a majority share in Asia-Pacific due to its major advantage. These tiers have high redundancy with multiple paths for power and cooling. Edge and cloud connectivity are expected to boost Tier 3 growth.
- In Australia, the Smart City Strategy developed by Newcastle Council focuses on how Big Data, the Internet of Things, and cloud connectivity can help create more livable and innovative cities. In the endemic phase of COVID-19, cloud computing was widely acknowledged as the foundation of Malaysia's digital journey. Primary providers such as Alibaba Cloud have enabled small businesses to trade as effectively as large enterprises, allowing such businesses to take full advantage of the services.
- The APAC tier 3 type operated at an IT load capacity of 6705.97 MW in 2022. The capacity is expected to grow from 8522.04 MW in 2023 to 13981.5 MW in 2029, registering a CAGR of 8.60%.
- The Tier 4 type is expected to register a CAGR of 20.40%. Developed countries adopt Tier-4 certification to achieve fault tolerance and redundancy. For this reason, Tier 4 zones are adopted even in developing regions. For instance, Supernap Thailand is the only Tier 4 facility in the country.
- The Tier 1 & 2 segment shows the least growth, as more than 70% of all traffic moves from server to server. Modern applications require significantly more data to travel within a data center at faster speeds and are less forgiving about latency.
China, Australia, and India held the majority market share in 2023; India is the fastest-growing country
- China and Australia are the leading countries in Asia-Pacific in terms of the data center market. China has the world's largest optical fiber network, 4G, and 5G independent networking networks. At present, 916,000 base stations have been built in 5G, accounting for more than 365 million of the world's 70% to 80% of 5G connections. The growing demand for OTT services and streaming content online on high-display formats is significantly increasing data consumption. China does not have Netflix but has local OTT providers, such as Yuoku, Tencent Video, Mango TV, and Bilibili. The online streaming industry was worth around USD 34 billion in 2021, which is expected to increase with the growing number of users.
- In Australia, currently, about 10-12% of data is created and processed outside a centralized data center or cloud, but the number is expected to cross 65-70% by 2025, a global trend that is also reflected in Australia. The COVID-19 crisis highlighted that Australia has a great need for digital infrastructure to improve connectivity. Fiber lines are expected to remain the dominant fixed broadband technology through 2025, supported by the rising demand for high-speed Internet services and the government's focus on aggressive fiber to the x (FTTx) network expansions nationwide under the National Broadband Network (NBN) project.
- In terms of investment, in August 2022, the Australian operator Telstra selected new transport network infrastructure rollout partners and Mad Max-like machinery capable of laying dual fiber cables simultaneously as the operator accelerates its efforts to build out high-capacity data transport networks across a country renowned for its distinctive environmental challenges.
Asia-Pacific Data Center Market Trends
Expansion in 5G and rising partnerships among tech companies and universities for 5G ICT skills in the region drive the data centers market
- Cloud-based applications accessed through smartphones are one of the major growing market trends with smartphone users. Mobile broadband networks cover 96% of Asia-Pacific, with 1.2 billion people accessing mobile internet services. In 2021, smartphone adoption reached 74%. It is expected to rise to 84% by 2025. Mobile subscriber penetration is expected to reach 62% in 2025.
- There are 8.9 million mobile apps, and China spends 40%. As of December 2021, China owned 442 apps that achieved a combined penetration rate of 94.6% among mobile internet users. The growing adoption of the 5G network among the population has complemented 5G-enabled device sales. 5G availability, primarily in Southeast Asia, is variable. Countries like Singapore and Indonesia have already seen 5G deployed for some time and continue to innovate use cases for the public and organizations.
- By 2022, 5G coverage was expected to reach over 85% of Thailand's population. With new partnerships and development, 5G adoption in smartphones is increasing. For instance, in July 2022, Ericsson and the King Mongkut University of Technology Thonburi (KMUTT) announced that they partnered to support Thai students in building 5G ICT skills for the future. A wireless alternative to wireline broadband connectivity for homes and businesses is one of the major early 5G use cases, particularly in regions with unserved or underserved broadband markets.
Growth in fiber-to-the-home/building (FTTH/B) service in various Asia-Pacific countries drives the demand for data centers in the region
- An average broadband internet connection has a minimum download speed of 25 Mbps and a minimum upload speed of 3 Mbps. Fiber-to-the-home/building (FTTH/B) service is set to cement its position as Asia-Pacific's leading fixed broadband technology. Singapore is anticipated to have the highest share of FTTH/B lines as a percentage of total fixed broadband lines in the region, with more than 98% by 2026. Singapore will be followed by Vietnam, Hong Kong, and Malaysia.
- According to the Malaysian Minister of Communications and Multimedia, copper networks will be phased out by 2023. The government looks to increase broadband coverage in populated areas by at least five-fold, and they look at about 98% broadband coverage in populated areas with a speed of at least 30 Mbps.
- The Australian operator Telstra selected new infrastructure rollout partners and Mad Max-like machinery to lay dual fiber cables simultaneously in August 2022. The operator intends to accelerate its efforts to build out high-capacity data transport networks across a country renowned for its distinct environmental challenges to meet increasing demands for data connectivity. Fiber connectivity is driven by the decommissioning of copper networks in Asia-Pacific. Copper is expensive to maintain and difficult to operate. Some estimates suggest that compared to fiber networks, legacy copper network maintenance OpEx is 2-7 times greater, energy costs are 3-6 times higher, and network fault rates are 5-10 times greater.
Asia-Pacific Data Center Industry Overview
The Asia-Pacific Data Center Market is fragmented, with the top five companies occupying 18.04%. The major players in this market are Digital Realty Trust, Inc., Equinix, Inc., KT Corporation, NTT Ltd. and STT GDC Pte Ltd (sorted alphabetically).
Additional Benefits:
- The market estimate (ME) sheet in Excel format
- 3 months of analyst support
TABLE OF CONTENTS
1 EXECUTIVE SUMMARY & KEY FINDINGS
2 REPORT OFFERS
3 INTRODUCTION
- 3.1 Study Assumptions & Market Definition
- 3.2 Scope of the Study
- 3.3 Research Methodology
4 MARKET OUTLOOK
- 4.1 It Load Capacity
- 4.2 Raised Floor Space
- 4.3 Colocation Revenue
- 4.4 Installed Racks
- 4.5 Rack Space Utilization
- 4.6 Submarine Cable
5 Key Industry Trends
- 5.1 Smartphone Users
- 5.2 Data Traffic Per Smartphone
- 5.3 Mobile Data Speed
- 5.4 Broadband Data Speed
- 5.5 Fiber Connectivity Network
- 5.6 Regulatory Framework
- 5.6.1 Australia
- 5.6.2 China
- 5.6.3 Hong Kong
- 5.6.4 India
- 5.6.5 Indonesia
- 5.6.6 Japan
- 5.6.7 Malaysia
- 5.6.8 New Zealand
- 5.6.9 Philippines
- 5.6.10 Singapore
- 5.6.11 South Korea
- 5.6.12 Taiwan
- 5.6.13 Thailand
- 5.6.14 Vietnam
- 5.7 Value Chain & Distribution Channel Analysis
6 MARKET SEGMENTATION (INCLUDES MARKET SIZE IN VOLUME, FORECASTS UP TO 2030 AND ANALYSIS OF GROWTH PROSPECTS)
- 6.1 Data Center Size
- 6.1.1 Large
- 6.1.2 Massive
- 6.1.3 Medium
- 6.1.4 Mega
- 6.1.5 Small
- 6.2 Tier Type
- 6.2.1 Tier 1 and 2
- 6.2.2 Tier 3
- 6.2.3 Tier 4
- 6.3 Absorption
- 6.3.1 Non-Utilized
- 6.3.2 Utilized
- 6.3.2.1 By Colocation Type
- 6.3.2.1.1 Hyperscale
- 6.3.2.1.2 Retail
- 6.3.2.1.3 Wholesale
- 6.3.2.2 By End User
- 6.3.2.2.1 BFSI
- 6.3.2.2.2 Cloud
- 6.3.2.2.3 E-Commerce
- 6.3.2.2.4 Government
- 6.3.2.2.5 Manufacturing
- 6.3.2.2.6 Media & Entertainment
- 6.3.2.2.7 Telecom
- 6.3.2.2.8 Other End User
- 6.4 Country
- 6.4.1 Australia
- 6.4.2 China
- 6.4.3 India
- 6.4.4 Indonesia
- 6.4.5 Japan
- 6.4.6 Malaysia
- 6.4.7 Rest of APAC
7 COMPETITIVE LANDSCAPE
- 7.1 Market Share Analysis
- 7.2 Company Landscape
- 7.3 Company Profiles (includes Global Level Overview, Market Level Overview, Core Business Segments, Financials, Headcount, Key Information, Market Rank, Market Share, Products and Services, and Analysis of Recent Developments).
- 7.3.1 AirTrunk Operating Pty Ltd
- 7.3.2 Canberra Data Centers
- 7.3.3 Chindata Group Holdings Ltd.
- 7.3.4 Digital Realty Trust, Inc.
- 7.3.5 Equinix, Inc.
- 7.3.6 Keppel DC REIT Management Pte. Ltd.
- 7.3.7 KT Corporation
- 7.3.8 NEXTDC Ltd
- 7.3.9 NTT Ltd.
- 7.3.10 Princeton Digital Group
- 7.3.11 Space DC Pte Ltd.
- 7.3.12 STT GDC Pte Ltd
- 7.4 LIST OF COMPANIES STUDIED
8 KEY STRATEGIC QUESTIONS FOR DATA CENTER CEOS
9 APPENDIX
- 9.1 Global Overview
- 9.1.1 Overview
- 9.1.2 Porter's Five Forces Framework
- 9.1.3 Global Value Chain Analysis
- 9.1.4 Global Market Size and DROs
- 9.2 Sources & References
- 9.3 List of Tables & Figures
- 9.4 Primary Insights
- 9.5 Data Pack
- 9.6 Glossary of Terms
 2025年全球资料中心资讯技术(IT)设备市场报告2025年全球配置自动化市场报告
 全球配电中心市场:依类型、应用和地区划分 - 市场规模、行业趋势、机会分析和预测(2025-2033 年)
 资料中心设备及基础设施市场:2025-2030
 高阶主管简报:2025 年第四季
 资料中心迁移市场-2025-2030 年预测
 AI资料中心的设备投资的明细和未来预测
 全球资料中心服务市场按服务类型、设施服务、IT 服务、专业咨询与认证、层级类型、资料中心规模与容量、资料中心类型、企业资料中心和地区划分 - 预测至 2030 年
 全球企业 IT 资产处置市场规模、份额和行业分析报告:2025 年至 2032 年按资产类型、服务、行业和地区分類的展望和预测
 资料中心市场:按组件、资料中心类型、层级、冷却类型、电源、最终用户和组织规模划分 - 全球预测,2025-2032 年