


 |
市场调查报告书
商品编码
1692575
EVA 黏合剂:市场占有率分析、产业趋势和统计数据、成长预测(2025-2030 年)EVA Adhesives - Market Share Analysis, Industry Trends & Statistics, Growth Forecasts (2025 - 2030) |
||||||
价格
※ 本网页内容可能与最新版本有所差异。详细情况请与我们联繫。
简介目录
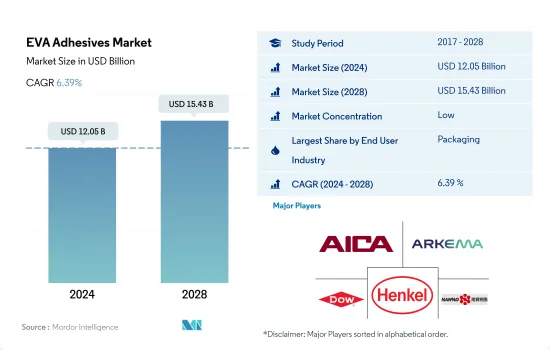
EVA 黏合剂市场规模预计在 2024 年为 120.5 亿美元,预计到 2028 年将达到 154.3 亿美元,预测期内(2024-2028 年)的复合年增长率为 6.39%。
虽然医疗保健是成长最快的终端用户,但包装仍处于领先地位
- EVA 黏合剂在全球范围内应用于各种终端用户行业,包括包装、汽车、木工和细木工、建筑和施工等。这些黏合剂可以黏合纸张、木材、塑胶、橡胶、金属和皮革等基材。这些黏合剂的主要应用包括纸/纸板盒、包装标籤、纸箱密封、组装、汽车内装和纸张加工。
- 2017 年至 2019 年,全球对 EVA 黏合剂的需求大幅成长。北美的木工和细木工行业在所有终端用户行业中需求增长最高(复合年增长率为 9.00%)。家具产品进口关税的提高带动了国内木工产业的成长。
- 2020年,由于营运和贸易限制、供应链限制和劳动力短缺等各种因素,所有终端用户产业对 EVA 黏合剂的需求均下降。汽车产业需求受创最严重,与前一年同期比较14.72%。旅行活动减少、原材料短缺以及其他各种因素导致了这一下降。随着限制措施的放宽,全球 EVA 黏合剂需求预计将在 2021 年迅速上升至疫情前的水平。
- 预计这一成长趋势将在预测期内持续下去。从数量上看,预测期内所有终端用户行业对 EVA 黏合剂的需求预计将以 4.32% 的复合年增长率成长。包装行业占据了最大的需求份额,因为该行业更喜欢具有快速固化特性的 EVA 黏合剂。预计在预测期内该产业仍将是最大的终端用户。
全球建筑和汽车行业的成长推动了对 EVA 黏合剂的需求
- 由于拥有众多建筑和包装活动、汽车、医疗设备、航太生产能力和其他成熟的终端用户产业,亚太地区在整个研究期间占据了 EVA 树脂基黏合剂需求的最大份额。中国是全球最大的建筑和汽车市场,满足了亚太地区高达58%的需求。
- 2017年至2019年,由于欧洲和亚太地区成长放缓,EVA树脂基黏合剂的需求停滞不前。由于全球主要终端用户产业、建筑业和汽车业的需求下降,2018 年和 2019 年 EVA 黏合剂的整体成长率与前一年相比仅限于约 3%(基于销售)。
- 2020年,新冠疫情导致所有终端用户产业对EVA胶合剂的需求下降。在德国、俄罗斯、南非和巴西等一些国家,建设活动被视为必不可少的活动,并允许在疫情期间进行。这些因素减轻了全球影响,限制了 2020 年 EVA 黏合剂的降幅与 2019 年相比约为 6.75%(以体积为基础)。
- 由于美国、澳洲、欧盟国家和其他地方的纾困措施和支持计划,需求将在 2021 年开始復苏,预计这一成长趋势将在整个预测期内持续下去。预计欧洲、南美和亚太国家增加的投资和预算分配将推动这一成长。
全球EVA胶黏剂市场趋势
开发中国家电子商务的快速成长将推动产业扩张
- 2020 年伊始,包装产业出现了几个长期趋势,推动需求成长。随着经济活动转向应对 COVID-19 疫情带来的挑战,包装产业成长加速。该行业的强劲表现得益于食品饮料和医疗保健等主要终端市场的收益成长和扩张,同时也显示了该行业在更广泛的经济不确定时期的整体稳定性。
- 2021 年,由于买家和卖家在疫情导致交易几乎停滞之后急切地重返市场,包装行业的併购活动激增。疫情期间包装公司的强劲表现强化了这样一种观念:包装产业在整体市场动盪期间提供了稳定性。疫情也增强了现有的顺风因素,例如电子商务的快速扩张以及品牌所有者采用包装来在超级市场货架上区分其产品,为该行业更强劲的长期增长奠定了基础。
- 截至目前,可溶解包装、节省空间包装和智慧包装是包装产业出现的一些创新。采用可食用包装是一种有趣且创新的替代方案,它有可能减少对石化燃料的依赖并显着减少碳足迹,并且由于其永续性而在整个食品行业中变得越来越普遍。这些因素为食品和饮料领域的包装产业创造了成长机会,并有望在预测期内推动包装产业的成长。
政府推行的电动车优惠政策将推动汽车产业
- 预计2021年后全球汽车产业将稳定成长,但随着消费者对个人汽车所有权的偏好下降并越来越偏好共用出行方式,成长速度正在放缓。预计预测期内全球汽车产业将以每年 2% 的速度成长,总收益增加价值将达到 1.5 兆美元。
- 2020年,受新冠疫情影响,汽车销量下滑,但2021年却迅速回升。汽车市场通常对GDP贡献巨大,因此世界各国政府纷纷推出措施支持经济。汽车销量从2019年的9000万辆下降到2020年的7800万辆。
- 由于电动车能源成本低廉、环境友善且移动性高效,其在全球范围内的普及对全球汽车市场的总收益做出了重大贡献。各种政府政策和标准也在推动电动车产量的成长。例如,欧盟二氧化碳排放标准在2021年增加了对电动车的需求。根据国际能源总署的永续情景,到2030年将需要2.3亿辆电动车取代燃油汽车。 2021年,最大的电动车製造商特斯拉的电动车产量增加了157%。预计预测期内(2022-2028 年),消费者对电动车的偏好将进一步成长。
EVA胶黏剂产业概况
EVA胶黏剂市场分散,前五大公司占9.33%的市占率。该市场的主要企业有:爱克工业、阿科玛集团、陶氏化学、汉高股份公司和南宝树脂化学集团(按字母顺序排列)
其他福利
- Excel 格式的市场预测 (ME) 表
- 3个月的分析师支持
目录
第一章执行摘要和主要发现
第二章 报告要约
第三章 引言
- 研究假设和市场定义
- 研究范围
- 调查方法
第四章 产业主要趋势
- 最终用户趋势
- 航太
- 车
- 建筑与施工
- 鞋类和皮革
- 包装
- 木製品和配件
- 法律规范
- 阿根廷
- 澳洲
- 巴西
- 加拿大
- 中国
- EU
- 印度
- 印尼
- 日本
- 马来西亚
- 墨西哥
- 俄罗斯
- 沙乌地阿拉伯
- 新加坡
- 南非
- 韩国
- 泰国
- 美国
- 价值炼和通路分析
第五章市场区隔
- 最终用户产业
- 航太
- 车
- 建筑与施工
- 鞋类和皮革
- 卫生保健
- 包装
- 木製品和配件
- 其他最终用户产业
- 科技
- 热熔胶
- 溶剂型
- 水性
- 地区
- 亚太地区
- 澳洲
- 中国
- 印度
- 印尼
- 日本
- 马来西亚
- 新加坡
- 韩国
- 泰国
- 其他亚太地区
- 欧洲
- 法国
- 德国
- 义大利
- 俄罗斯
- 西班牙
- 英国
- 其他欧洲国家
- 中东和非洲
- 沙乌地阿拉伯
- 南非
- 其他中东和非洲地区
- 北美洲
- 加拿大
- 墨西哥
- 美国
- 北美其他地区
- 南美洲
- 阿根廷
- 巴西
- 南美洲其他地区
- 亚太地区
第六章 竞争格局
- 关键策略趋势
- 市场占有率分析
- 商业状况
- 公司简介
- Aica Kogyo Co..Ltd.
- Arkema Group
- Beardow Adams
- CEMEDINE Co.,Ltd.
- Dow
- Follmann Chemie GmbH
- HB Fuller Company
- Henkel AG & Co. KGaA
- Jowat SE
- KLEBCHEMIE MG Becker GmbH & Co. KG
- NANPAO RESINS CHEMICAL GROUP
- OKONG Corp.
- Paramelt BV
- Selic Corp Public Company Limited.
- Soudal Holding NV
第七章:CEO面临的关键策略问题
第 8 章 附录
- 全球黏合剂和密封剂产业概况
- 概述
- 五力分析框架(产业吸引力分析)
- 全球价值链分析
- 驱动因素、限制因素和机会
- 资讯来源及延伸阅读
- 图片列表
- 关键见解
- 资料包
- 词彙表
简介目录
Product Code: 92412
The EVA Adhesives Market size is estimated at 12.05 billion USD in 2024, and is expected to reach 15.43 billion USD by 2028, growing at a CAGR of 6.39% during the forecast period (2024-2028).
Healthcare is the fastest-growing end-user while packaging remains as pole position
- Globally, EVA adhesives find applications in a range of end-user industries, including packaging, automotive, woodworking and joinery, and building and construction. These adhesives can bond with substrates like paper, wood, plastics, rubbers, metals, and leather. Some major applications of these adhesives are paper/card stock boxes, package labeling, carton sealing, assembly, vehicle interiors, and paper conversion.
- The global demand for EVA adhesives grew significantly from 2017 to 2019. The woodworking and joinery industry in the North American region has witnessed the highest growth (CAGR of 9.00%) in demand among all end-user industries from all regions. Increased import duties on furniture products resulted in growth in the domestic woodworking industry.
- In 2020, the demand for EVA adhesives declined from all end-user industries because of various factors such as operational and trade restrictions, supply chain constraints, labor shortages, and other factors. The demand from the automotive industry suffered the most, declining by 14.72% Y-o-Y. Reduced travel activity, shortage of raw materials, and various other factors have caused this decline. As the restrictions eased, the global EVA adhesives demand quickly rose to pre-pandemic levels in 2021.
- This growth trend is expected to continue during the forecast period. In volume terms, the demand for EVA adhesives from all end-user industries combined is expected to grow, recording a CAGR of 4.32% during the forecast period. The packaging industry favors EVA adhesives because of their fast-curing properties and thus occupies the largest share of the demand. The industry is expected to remain the largest end-user during the forecast period.
Growing construction and automotive activities across the globe to boost the demand for EVA adhesives
- Asia-Pacific occupied the largest share of the demand for EVA resin-based adhesives throughout the study period because of the large number of construction and packaging activities, automotive, medical devices, and aerospace production capacities, and other well-established end-user industries in the region. China is the largest construction and automotive market globally and generates up to 58% of the demand from the Asia-Pacific region.
- During 2017-2019, the demand for EVA resin-based adhesives was sluggish due to the slow growth in the European and Asia-Pacific regions. The global decline in the demand from construction and automotive end-user industries, which are among the major end-user industries, has restricted the overall growth of EVA adhesives to around 3% (in terms of volume) in 2018 and 2019 compared to previous years.
- In 2020, the demand for EVA adhesives from all end-user industries declined because of the COVID-19 pandemic. In some countries like Germany, Russia, South Africa, and Brazil, construction activities were deemed essential and were allowed to operate during the pandemic. Factors like these have cushioned the global impact restricting the decline of EVA adhesives by around -6.75% in 2020 compared to 2019 (in terms of volume).
- In 2021, due to the relief packages and support schemes in countries like the United States, Australia, and countries in the European Union, the demand started to recover, and this growth trend is expected to continue throughout the forecast period. Increased investments and budget allotments witnessed in European, South American, and Asia-Pacific countries are expected to drive this growth.
Global EVA Adhesives Market Trends
Fast paced growth of e-commerce industry in developing nations to augment the industry
- In 2020, the packaging industry started with multiple long-term trends driving higher demand, and growth accelerated as economic activity switched to address the challenges posed by the COVID-19 pandemic. The industry's robust performance supported rising revenues and the expansion of important end markets such as food and beverage and healthcare and also demonstrated the industry's general stability during a period of overall economic uncertainty.
- Packaging M&A activities soared in 2021, as buyers and sellers enthusiastically returned to the market after deal-making almost ceased during the pandemic in 2020. During the pandemic, the strong performance of packaging companies reinforced the idea that the industry offers stability during moments of general market turbulence. The pandemic also strengthened previously existing tailwinds, including rapid e-commerce expansion and brand owners employing packaging to differentiate their products on supermarket shelves, positioning the sector for stronger long-term growth.
- As of now, dissolvable packaging, space-saving packaging, and smart packaging are a few innovations that have come up in the packaging industry. The adoption of edible packaging, an interesting and innovative alternative that alleviates the reliance on fossil fuels and has the potential to significantly decrease the carbon footprint, is now becoming popular across the food industry owing to its sustainability. These factors have created a growth opportunity for the packaging industry in the food and beverage sector, which is expected to boost the packaging industry's growth during the forecast period.
Favorable government policies to promote electric vehicles will propel automotive industry
- Since 2021, the global automotive industry has been expected to grow steadily but at a slower pace because of the decline in consumers' preferences for individual ownership of passenger vehicles and their increased preference for shared mobility in transportation. The global automotive industry is expected to experience a growth rate of 2% annually, with an expected value addition of USD 1.5 trillion in total revenue during the forecast period.
- In 2020, due to the impact of the COVID-19 pandemic, vehicle sales declined but recovered rapidly in 2021 because the governments of various countries took measures to support their economies, as automotive markets usually contribute majorly to their GDP. Vehicle sales declined from 90 million units of passenger vehicles in 2019 to 78 million units in 2020.
- The introduction of electric vehicles worldwide has contributed significantly to the overall revenue of the global automotive market because of their cheaper energy costs, environmentally benign nature, and efficient mobility features. Various government policies and standards also work as driving factors to increase EV production. For instance, the EU standards for CO2 emissions increased the demand for electric vehicles in 2021. As per the IEA's Sustainable Scenario, 230 million electric vehicles are required to replace combustion fuel-based vehicles by 2030. In 2021, Tesla, the largest EV manufacturer, recorded a rise of 157% in the number of electric vehicles manufactured. This growing trend of consumers preferring electric vehicles is expected to rise further during the forecast period (2022-2028).
EVA Adhesives Industry Overview
The EVA Adhesives Market is fragmented, with the top five companies occupying 9.33%. The major players in this market are Aica Kogyo Co..Ltd., Arkema Group, Dow, Henkel AG & Co. KGaA and NANPAO RESINS CHEMICAL GROUP (sorted alphabetically).
Additional Benefits:
- The market estimate (ME) sheet in Excel format
- 3 months of analyst support
TABLE OF CONTENTS
1 EXECUTIVE SUMMARY & KEY FINDINGS
2 REPORT OFFERS
3 INTRODUCTION
- 3.1 Study Assumptions & Market Definition
- 3.2 Scope of the Study
- 3.3 Research Methodology
4 KEY INDUSTRY TRENDS
- 4.1 End User Trends
- 4.1.1 Aerospace
- 4.1.2 Automotive
- 4.1.3 Building and Construction
- 4.1.4 Footwear and Leather
- 4.1.5 Packaging
- 4.1.6 Woodworking and Joinery
- 4.2 Regulatory Framework
- 4.2.1 Argentina
- 4.2.2 Australia
- 4.2.3 Brazil
- 4.2.4 Canada
- 4.2.5 China
- 4.2.6 EU
- 4.2.7 India
- 4.2.8 Indonesia
- 4.2.9 Japan
- 4.2.10 Malaysia
- 4.2.11 Mexico
- 4.2.12 Russia
- 4.2.13 Saudi Arabia
- 4.2.14 Singapore
- 4.2.15 South Africa
- 4.2.16 South Korea
- 4.2.17 Thailand
- 4.2.18 United States
- 4.3 Value Chain & Distribution Channel Analysis
5 MARKET SEGMENTATION (includes market size in Value in USD and Volume, Forecasts up to 2028 and analysis of growth prospects)
- 5.1 End User Industry
- 5.1.1 Aerospace
- 5.1.2 Automotive
- 5.1.3 Building and Construction
- 5.1.4 Footwear and Leather
- 5.1.5 Healthcare
- 5.1.6 Packaging
- 5.1.7 Woodworking and Joinery
- 5.1.8 Other End-user Industries
- 5.2 Technology
- 5.2.1 Hot Melt
- 5.2.2 Solvent-borne
- 5.2.3 Water-borne
- 5.3 Region
- 5.3.1 Asia-Pacific
- 5.3.1.1 Australia
- 5.3.1.2 China
- 5.3.1.3 India
- 5.3.1.4 Indonesia
- 5.3.1.5 Japan
- 5.3.1.6 Malaysia
- 5.3.1.7 Singapore
- 5.3.1.8 South Korea
- 5.3.1.9 Thailand
- 5.3.1.10 Rest of Asia-Pacific
- 5.3.2 Europe
- 5.3.2.1 France
- 5.3.2.2 Germany
- 5.3.2.3 Italy
- 5.3.2.4 Russia
- 5.3.2.5 Spain
- 5.3.2.6 United Kingdom
- 5.3.2.7 Rest of Europe
- 5.3.3 Middle East & Africa
- 5.3.3.1 Saudi Arabia
- 5.3.3.2 South Africa
- 5.3.3.3 Rest of Middle East & Africa
- 5.3.4 North America
- 5.3.4.1 Canada
- 5.3.4.2 Mexico
- 5.3.4.3 United States
- 5.3.4.4 Rest of North America
- 5.3.5 South America
- 5.3.5.1 Argentina
- 5.3.5.2 Brazil
- 5.3.5.3 Rest of South America
- 5.3.1 Asia-Pacific
6 COMPETITIVE LANDSCAPE
- 6.1 Key Strategic Moves
- 6.2 Market Share Analysis
- 6.3 Company Landscape
- 6.4 Company Profiles (includes Global Level Overview, Market Level Overview, Core Business Segments, Financials, Headcount, Key Information, Market Rank, Market Share, Products and Services, and Analysis of Recent Developments).
- 6.4.1 Aica Kogyo Co..Ltd.
- 6.4.2 Arkema Group
- 6.4.3 Beardow Adams
- 6.4.4 CEMEDINE Co.,Ltd.
- 6.4.5 Dow
- 6.4.6 Follmann Chemie GmbH
- 6.4.7 H.B. Fuller Company
- 6.4.8 Henkel AG & Co. KGaA
- 6.4.9 Jowat SE
- 6.4.10 KLEBCHEMIE M. G. Becker GmbH & Co. KG
- 6.4.11 NANPAO RESINS CHEMICAL GROUP
- 6.4.12 OKONG Corp.
- 6.4.13 Paramelt B.V.
- 6.4.14 Selic Corp Public Company Limited.
- 6.4.15 Soudal Holding N.V.
7 KEY STRATEGIC QUESTIONS FOR ADHESIVES AND SEALANTS CEOS
8 APPENDIX
- 8.1 Global Adhesives and Sealants Industry Overview
- 8.1.1 Overview
- 8.1.2 Porter's Five Forces Framework (Industry Attractiveness Analysis)
- 8.1.3 Global Value Chain Analysis
- 8.1.4 Drivers, Restraints, and Opportunities
- 8.2 Sources & References
- 8.3 List of Tables & Figures
- 8.4 Primary Insights
- 8.5 Data Pack
- 8.6 Glossary of Terms
02-2729-4219
+886-2-2729-4219
 光胶膜:全球市占率及排名、总收入及需求预测(2025-2031年)陶瓷砖黏合剂:全球市场份额和排名、总收入和需求预测(2025-2031年)
 永续黏合剂市场分析及预测(至2034年):类型、产品、应用、技术、材料类型、最终用户、配方、製程、成分和应用类型胶合剂包装解决方案市场分析及预测(至 2034 年):按类型、产品、服务、技术、材料类型、应用、流程、最终用户、功能和解决方案
 按产品类型、黏合剂化学、黏合剂技术和最终用途产业分類的黏合剂市场-2025-2032年全球预测橡胶修补胶黏剂市场按产品类型、形态、应用、终端用户产业、分销管道和技术划分-2025-2032年全球预测混凝土黏合剂市场按产品类型、形式、应用和最终用途产业划分-2025-2032年全球预测
 导热箔黏合剂市场-全球产业规模、份额、趋势、机会和预测(按类型、应用、地区和竞争细分,2020-2030 年)
 全球永续黏合剂市场(按类型、原料、最终用途产业和地区划分)—预测至 2030 年纺织服饰黏合剂市场(按黏合剂类型、树脂类型、形态、织物类型、服饰类型和分销管道)—2025-2030 年全球预测
▼