


 |
市场调查报告书
商品编码
1693516
肥料:市场占有率分析、行业趋势和统计数据、成长预测(2025-2030 年)Fertilizers - Market Share Analysis, Industry Trends & Statistics, Growth Forecasts (2025 - 2030) |
||||||
价格
※ 本网页内容可能与最新版本有所差异。详细情况请与我们联繫。
简介目录
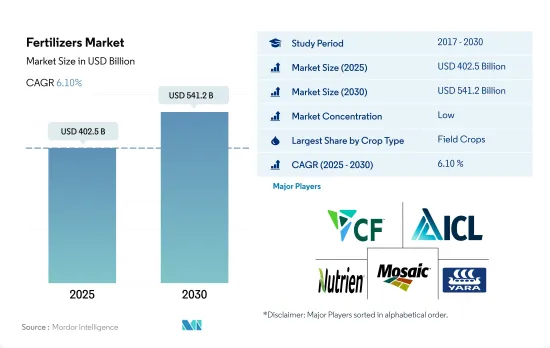
预计 2025 年肥料市场规模将达到 4,025 亿美元,到 2030 年将达到 5,412 亿美元,预测期内(2025-2030 年)的复合年增长率为 6.10%。
农业种植面积的下降预计将增加肥料需求并推动肥料市场的发展。
- 2022年,田间作物将占全球肥料市场的约82.1%,价值约3,539亿美元。田间作物生产在全球占主导地位,全球超过 95.0% 的农业用地用于田间作物种植。稻米、小麦和玉米是世界主要田间作物,这三种作物约占世界农业用地的38.0%。
- 园艺作物约占全球肥料市场总量的 15.0%。园艺作物生产以开发中国家为主,特别是亚太国家。亚太地区在全球园艺肥料市场的主导地位主要归功于其在世界园艺种植面积中的份额,约占73.0%(约1.3766亿公顷)。
- 草坪和观赏植物领域是最小的肥料市场,其次是园艺作物。 2022 年,草坪和观赏植物领域将占全球肥料市场的约 2.4%,价值约 104.2 亿美元。草坪和观赏肥料市场是一个分散的市场。不过,与亚太和南美相比,北美和欧洲等新兴市场占有更大的份额。
- 亚太地区在田间和园艺作物种植领域占据全球主导地位。亚太地区肥料市场正在快速成长。欧洲是第二大肥料市场,其次是亚太地区。许多地区都市化的加速和整体农业面积的下降正在增加对化肥的需求,预计这将在 2023 年至 2030 年期间推动化肥市场的发展。
亚太地区主导全球肥料市场
- 研究期间,全球肥料市场呈现稳定的成长率,2022年达到4,290亿美元。
- 2022年亚太地区将占最大份额,达到44.8%,其次是欧洲和南美洲。根据美国农业部统计,中国是该地区乃至全球最大的化肥生产国和出口国,占全球化肥产量的25%。预计2022年中国化肥市场规模将达703亿美元,消费量将达9,420万吨。
- 2022年,北美将占全球肥料市场的17.8%。在北美,美国和加拿大按价值和数量计占肥料市场的90.0%以上。北美拥有磷酸盐和钾肥资源,但一半以上的氮肥和85.0%以上的钾肥都仰赖进口。
- 2022年欧洲将占全球肥料市场的15.1%。法国是欧洲最大的肥料消费国之一,预计到2022年底将占全球肥料市场的20.1%。预计到2022年底市场规模将达到90亿美元,与前一年同期比较增5.8%。先进耕作方法的采用也将导致专用肥料的使用增加。
- 2022 年,南美洲占据了 11.2% 的市场占有率。田间作物在南美肥料市场占据主导地位,占 2022 年市场占有率的 95%。南美洲种植最多的三种作物是大豆、玉米和甘蔗。
- 由于田间作物种植面积的增加以及肥料需求的相应增加,预计市场将在 2023 年至 2030 年间增长。
全球肥料市场趋势
为满足日益增长的粮食需求,农业面临的压力日益增大,预计将导致田间作物种植面积增加
- 全球农业部门面临许多挑战。根据联合国预测,到 2050 年,世界人口可能超过 90 亿。人口成长可能对农业造成过度压力,而由于劳动力短缺和都市化进程加剧导致农地面积减少,农业产量已经下降。根据联合国粮食及农业组织预测,2050年,全球70%的人口预计将居住在城市。随着全球可耕地面积减少,农民需要使用更多的肥料来提高作物产量。
- 亚太地区是世界上最大的农产品生产地区。农业对该地区的经济至关重要,约占总劳动力的 20%。该地区以田间作物种植为主,约占全部区域作物总面积的95%以上。水稻、小麦和玉米是该地区的主要田间作物,2022年约占总耕地面积的24.3%。
- 北美洲是世界上第二大可耕地。该农场种植多种作物,主要为田间作物。尤其是玉米、棉花、稻米、大豆和小麦,都是美国农业部强调的主要田间作物。 2022年,美国占北美作物种植面积的46.2%。然而,2017年至2019年期间,该国作物面积大幅下降,主要原因是恶劣天气导致德克萨斯和休士顿等地区发生严重洪灾。
全球田间作物主要养分氮、钾、磷的平均施用量为164.31公斤/公顷。
- 玉米、油菜籽、棉花、高粱、水稻、小麦和大豆是世界主要的营养密集型作物。 2022 年这些作物的平均施用量为:玉米:230.57 公斤/公顷、油菜籽:255.75 公斤/公顷、棉花:172.70 公斤/公顷、高粱:158.46 公斤/公顷、水稻:154.49 公斤/公顷、小麦:135.35 公斤/公顷公顷:154.49 公斤/公顷、小麦:135。主要营养素对作物至关重要,因为它们支持植物的基本代谢过程,并有助于细胞、细胞膜和叶绿素等关键组织的形成。特别是磷对于种植优质作物至关重要,而钾在激活植物生长所必需的酵素方面起着至关重要的作用。
- 全球田间作物氮、钾、磷的平均施用量为164.31公斤/公顷。氮肥是最广泛使用的基肥,2022 年施用量为 224.6 公斤/公顷。其次是钾肥,施用量 150.3 公斤/公顷,磷肥位居第三,施用量为 117.9 公斤/公顷。
- 2022年,油菜籽施用氮量最高,为347.4公斤/公顷,玉米施用磷量最高,为156.3公斤/公顷。菜籽钾施用量最高,为每公顷 248.6 公斤。
- 世界各地田间作物种植正在兴起,尤其是在南美洲和亚太地区。这些地区正成为化肥的主要市场。欧洲和北美等已开发地区以及遭受营养缺乏的地区越来越多地采用特种肥料,因为它们具有功效。预计这些趋势将在 2023 年至 2030 年期间推动主要营养肥料市场的发展。
肥料行业概况
肥料市场分散,前五大企业市占率为14.27%。该市场的主要企业有:CF Industries Holdings, Inc.、ICL Group Ltd、Nutrien Ltd.、The Mosaic Company 和 Yara International ASA(按字母顺序排列)
其他福利
- Excel 格式的市场预测 (ME) 表
- 3个月的分析师支持
目录
第一章执行摘要和主要发现
第二章 报告要约
第三章 引言
- 研究假设和市场定义
- 研究范围
- 调查方法
第四章 产业主要趋势
- 主要作物种植面积
- 田间作物
- 园艺作物
- 平均养分施用量
- 微量营养素
- 田间作物
- 园艺作物
- 主要营养素
- 田间作物
- 园艺作物
- 次要宏量营养素
- 田间作物
- 园艺作物
- 微量营养素
- 灌溉农田
- 法律规范
- 价值炼和通路分析
第五章市场区隔
- 类型
- 复合型
- 直的
- 微量营养素
- 硼
- 铜
- 铁
- 锰
- 钼
- 锌
- 其他的
- 氮
- 硝酸铵
- 无水氨
- 尿素
- 其他的
- 磷酸
- DAP
- MAP
- SSP
- TSP
- 其他的
- 钾
- MoP
- SoP
- 其他的
- 次要营养物质
- 钙
- 镁
- 硫
- 形式
- 传统的
- 特别的
- CRF
- 液体肥料
- SRF
- 水溶性
- 施肥方式
- 受精
- 叶面喷布
- 土壤
- 作物类型
- 田间作物
- 园艺作物
- 草坪和观赏植物
- 地区
- 亚太地区
- 澳洲
- 孟加拉
- 中国
- 印度
- 印尼
- 日本
- 巴基斯坦
- 菲律宾
- 泰国
- 越南
- 其他亚太地区
- 欧洲
- 法国
- 德国
- 义大利
- 荷兰
- 俄罗斯
- 西班牙
- 乌克兰
- 英国
- 其他欧洲国家
- 中东和非洲
- 奈及利亚
- 沙乌地阿拉伯
- 南非
- 土耳其
- 其他中东和非洲地区
- 北美洲
- 加拿大
- 墨西哥
- 美国
- 北美其他地区
- 南美洲
- 阿根廷
- 巴西
- 南美洲其他地区
- 亚太地区
第六章 竞争格局
- 关键策略趋势
- 市场占有率分析
- 商业状况
- 公司简介
- CF Industries Holdings, Inc.
- Coromandel International Ltd.
- Grupa Azoty SA(Compo Expert)
- Haifa Group
- ICL Group Ltd
- Indian Farmers Fertiliser Cooperative Limited
- Nutrien Ltd.
- Sociedad Quimica y Minera de Chile SA
- The Mosaic Company
- Yara International ASA
第七章:CEO面临的关键策略问题
第 8 章 附录
- 世界概况
- 概述
- 五力分析框架
- 全球价值链分析
- 市场动态(DRO)
- 资讯来源及延伸阅读
- 图片列表
- 关键见解
- 资料包
- 词彙表
简介目录
Product Code: 92580
The Fertilizers Market size is estimated at 402.5 billion USD in 2025, and is expected to reach 541.2 billion USD by 2030, growing at a CAGR of 6.10% during the forecast period (2025-2030).
Decreasing agricultural area is increasing the demand for fertilizers and is expected to drive the fertilizer market
- In 2022, field crops dominated the global fertilizers market, accounting for about 82.1% of the market value of the global fertilizer market, at about USD 353.9 billion. Field crop production is dominant worldwide, and more than 95.0% of the agricultural land in the world is under field crop cultivation. Rice, wheat, and corn are the major field crops produced globally, and these three crops account for about 38.0% of the global agricultural land.
- Horticultural crops account for about 15.0% of the total fertilizer market value worldwide. Horticultural crop production is dominant in developing countries, particularly in Asia-Pacific. Asia-Pacific's dominance in the global horticultural fertilizer market is primarily due to the presence of about 73.0% of the global horticultural cultivation area, which is about 137.66 million hectares of land under horticulture cultivation.
- The turf and ornamentals segment is the smallest fertilizer market, followed by horticultural crops. In 2022, the turf and ornamentals segment accounted for about 2.4% of the market value of the global fertilizer market, at about USD 10.42 billion. The turf and ornamental fertilizer market is a fragmented market. However, developed regions like North America and Europe occupy a major market share compared to Asia-Pacific and South America.
- Asia-Pacific dominates in growing both field and horticultural crops worldwide. The Asia-Pacific fertilizer market is growing at a fast rate. Europe is the second-largest fertilizer market, followed by Asia-Pacific. The increasing urbanization in many regions and the decreasing overall agricultural area are increasing the demand for fertilizers and are expected to drive the fertilizer market between 2023 and 2030.
Asia Pacific is dominating the global fertilizer market
- The global fertilizer market grew at a stable rate during the study period, registering a value of USD 429.0 billion in 2022.
- Asia-Pacific occupied the largest share of 44.8% in 2022, followed by Europe and South America. China is the largest producer and exporter of fertilizers in the region and the world, contributing 25% to global fertilizer production, according to the USDA. The Chinese fertilizer market is estimated to be valued at USD 70.3 billion in 2022, with a volume consumption of 94.2 million metric tons.
- North America accounted for 17.8% of the global fertilizer market in 2022. In North America, the United States and Canada constitute more than 90.0% of the fertilizer market's value and volume. Although North America has phosphate and potash resources, the region is a net importer of more than half of its nitrogenous fertilizers and over 85.0% of its potash from international sources.
- Europe accounted for 15.1% of the global fertilizer market in 2022. France is one of the largest fertilizer-consuming countries in Europe, with an expected overall share of 20.1% by the end of 2022. The market value is expected to reach USD 9 billion by the end of 2022, with a 5.8% y-o-y growth rate. The adoption of advanced cultivation methods will also increase the usage of specialty fertilizers.
- South America accounted for 11.2% of the market share in 2022. Field crops dominated the South American fertilizer market and accounted for 95% of the market share in 2022. The top three crops grown in South America are soybean, corn, and sugarcane.
- With the increasing cultivation of field crops, along with a subsequently increased demand for fertilizers, the market is anticipated to grow between 2023 and 2030.
Global Fertilizers Market Trends
The rising pressure on the agriculture industry to meet the growing demand for food is expected to increase the area under field crop cultivation
- The global agricultural sector is facing many challenges. According to the UN, the world population may exceed 9 billion by 2050. This population growth may overburden the agricultural industry, which is already experiencing an output loss due to a lack of laborers and the shrinkage of agricultural fields caused by rising urbanization. According to the Food and Agriculture Organization, 70% of the global population is expected to live in cities by 2050. Due to the global loss of arable land, farmers now need to utilize more fertilizers to increase crop yields.
- Asia-Pacific is the world's largest producer of agricultural products. Agriculture is critical to the region's economy, as it employs about 20% of the total available workforce. Field crop cultivation dominates the region, accounting for about more than 95% of the total crop area in the region. Rice, wheat, and corn are the major field crops produced in the region, together accounting for about 24.3% of the total crop area in 2022.
- North America ranks as the second-largest arable region globally. Its farms cultivate a diverse range of crops, with a focus on field crops. Notably, corn, cotton, rice, soybean, and wheat are the prominent field crops, as highlighted by the USDA. In 2022, the United States commanded 46.2% of North America's crop cultivation area. However, the country witnessed a significant drop in crop acreage between 2017 and 2019, primarily due to adverse environmental conditions, leading to severe flooding in regions like Texas and Houston.
The global average application rate of primary nutrient nitrogen, potassium, and phosphorus in field crops is 164.31 kg/ha
- Corn, rapeseed, cotton, sorghum, rice, wheat, and soybean are among the primary nutrient-intensive crops globally. In 2022, the average application rates for these crops were as follows: corn - 230.57 kg/ha, rapeseed - 255.75 kg/ha, cotton - 172.70 kg/ha, sorghum - 158.46 kg/ha, rice - 154.49 kg/ha, wheat - 135.35 kg/ha, and soybean - 120.97 kg/ha. Primary nutrients are vital for crops as they support essential plant metabolic processes and contribute to the formation of key tissues like cells, cell membranes, and chlorophyll. Notably, phosphorus is crucial for cultivating high-quality crops, while potassium plays a pivotal role in activating enzymes necessary for plant growth.
- On a global scale, field crops have an average application rate of 164.31 kg/ha for nitrogen, potassium, and phosphorus. Nitrogen stands out as the most widely used primary nutrient fertilizer, with an application rate of 224.6 kg/ha in 2022. Potassic fertilizers follow, with an application rate of 150.3 kg/ha, and phosphorus ranks third, with an application rate of 117.9 kg/ha.
- In 2022, rapeseed had the highest nitrogen application rate at 347.4 kg/ha, while corn led in phosphorus application at 156.3 kg/ha. Canola took the lead in potassium application, with a rate of 248.6 kg/ha.
- Field crop cultivation is on the rise globally, particularly in South America and Asia-Pacific. These regions are emerging as key markets for fertilizers. Developed regions like Europe and North America, along with areas grappling with nutrient deficiencies, are increasingly adopting specialty fertilizers for their efficacy. These trends are poised to propel the primary nutrient fertilizers market during 2023-2030.
Fertilizers Industry Overview
The Fertilizers Market is fragmented, with the top five companies occupying 14.27%. The major players in this market are CF Industries Holdings, Inc., ICL Group Ltd, Nutrien Ltd., The Mosaic Company and Yara International ASA (sorted alphabetically).
Additional Benefits:
- The market estimate (ME) sheet in Excel format
- 3 months of analyst support
TABLE OF CONTENTS
1 EXECUTIVE SUMMARY & KEY FINDINGS
2 REPORT OFFERS
3 INTRODUCTION
- 3.1 Study Assumptions & Market Definition
- 3.2 Scope of the Study
- 3.3 Research Methodology
4 KEY INDUSTRY TRENDS
- 4.1 Acreage Of Major Crop Types
- 4.1.1 Field Crops
- 4.1.2 Horticultural Crops
- 4.2 Average Nutrient Application Rates
- 4.2.1 Micronutrients
- 4.2.1.1 Field Crops
- 4.2.1.2 Horticultural Crops
- 4.2.2 Primary Nutrients
- 4.2.2.1 Field Crops
- 4.2.2.2 Horticultural Crops
- 4.2.3 Secondary Macronutrients
- 4.2.3.1 Field Crops
- 4.2.3.2 Horticultural Crops
- 4.2.1 Micronutrients
- 4.3 Agricultural Land Equipped For Irrigation
- 4.4 Regulatory Framework
- 4.5 Value Chain & Distribution Channel Analysis
5 MARKET SEGMENTATION (includes market size in Value in USD and Volume, Forecasts up to 2030 and analysis of growth prospects)
- 5.1 Type
- 5.1.1 Complex
- 5.1.2 Straight
- 5.1.2.1 Micronutrients
- 5.1.2.1.1 Boron
- 5.1.2.1.2 Copper
- 5.1.2.1.3 Iron
- 5.1.2.1.4 Manganese
- 5.1.2.1.5 Molybdenum
- 5.1.2.1.6 Zinc
- 5.1.2.1.7 Others
- 5.1.2.2 Nitrogenous
- 5.1.2.2.1 Ammonium Nitrate
- 5.1.2.2.2 Anhydrous Ammonia
- 5.1.2.2.3 Urea
- 5.1.2.2.4 Others
- 5.1.2.3 Phosphatic
- 5.1.2.3.1 DAP
- 5.1.2.3.2 MAP
- 5.1.2.3.3 SSP
- 5.1.2.3.4 TSP
- 5.1.2.3.5 Others
- 5.1.2.4 Potassic
- 5.1.2.4.1 MoP
- 5.1.2.4.2 SoP
- 5.1.2.4.3 Others
- 5.1.2.5 Secondary Macronutrients
- 5.1.2.5.1 Calcium
- 5.1.2.5.2 Magnesium
- 5.1.2.5.3 Sulfur
- 5.2 Form
- 5.2.1 Conventional
- 5.2.2 Speciality
- 5.2.2.1 CRF
- 5.2.2.2 Liquid Fertilizer
- 5.2.2.3 SRF
- 5.2.2.4 Water Soluble
- 5.3 Application Mode
- 5.3.1 Fertigation
- 5.3.2 Foliar
- 5.3.3 Soil
- 5.4 Crop Type
- 5.4.1 Field Crops
- 5.4.2 Horticultural Crops
- 5.4.3 Turf & Ornamental
- 5.5 Region
- 5.5.1 Asia-Pacific
- 5.5.1.1 Australia
- 5.5.1.2 Bangladesh
- 5.5.1.3 China
- 5.5.1.4 India
- 5.5.1.5 Indonesia
- 5.5.1.6 Japan
- 5.5.1.7 Pakistan
- 5.5.1.8 Philippines
- 5.5.1.9 Thailand
- 5.5.1.10 Vietnam
- 5.5.1.11 Rest of Asia-Pacific
- 5.5.2 Europe
- 5.5.2.1 France
- 5.5.2.2 Germany
- 5.5.2.3 Italy
- 5.5.2.4 Netherlands
- 5.5.2.5 Russia
- 5.5.2.6 Spain
- 5.5.2.7 Ukraine
- 5.5.2.8 United Kingdom
- 5.5.2.9 Rest of Europe
- 5.5.3 Middle East & Africa
- 5.5.3.1 Nigeria
- 5.5.3.2 Saudi Arabia
- 5.5.3.3 South Africa
- 5.5.3.4 Turkey
- 5.5.3.5 Rest of Middle East & Africa
- 5.5.4 North America
- 5.5.4.1 Canada
- 5.5.4.2 Mexico
- 5.5.4.3 United States
- 5.5.4.4 Rest of North America
- 5.5.5 South America
- 5.5.5.1 Argentina
- 5.5.5.2 Brazil
- 5.5.5.3 Rest of South America
- 5.5.1 Asia-Pacific
6 COMPETITIVE LANDSCAPE
- 6.1 Key Strategic Moves
- 6.2 Market Share Analysis
- 6.3 Company Landscape
- 6.4 Company Profiles
- 6.4.1 CF Industries Holdings, Inc.
- 6.4.2 Coromandel International Ltd.
- 6.4.3 Grupa Azoty S.A. (Compo Expert)
- 6.4.4 Haifa Group
- 6.4.5 ICL Group Ltd
- 6.4.6 Indian Farmers Fertiliser Cooperative Limited
- 6.4.7 Nutrien Ltd.
- 6.4.8 Sociedad Quimica y Minera de Chile SA
- 6.4.9 The Mosaic Company
- 6.4.10 Yara International ASA
7 KEY STRATEGIC QUESTIONS FOR FERTILIZER CEOS
8 APPENDIX
- 8.1 Global Overview
- 8.1.1 Overview
- 8.1.2 Porter's Five Forces Framework
- 8.1.3 Global Value Chain Analysis
- 8.1.4 Market Dynamics (DROs)
- 8.2 Sources & References
- 8.3 List of Tables & Figures
- 8.4 Primary Insights
- 8.5 Data Pack
- 8.6 Glossary of Terms
02-2729-4219
+886-2-2729-4219
 美国化肥:市场占有率分析、产业趋势与统计、成长预测(2026-2031)越南化肥:市场占有率分析、产业趋势与统计、成长预测(2026-2031)非洲化肥市场:市场占有率分析、产业趋势与统计、成长预测(2026-2031年)
 2026-2034年肥料市场规模、份额、趋势及预测(依产品类型、产品形态、作物类型及地区划分)
 化肥市场规模、份额和趋势分析报告:按类型、应用、地区和细分市场预测(2026-2033 年)
 2026年全球复合肥料市场报告2026年全球硼肥市场报告2026年全球螯合肥料市场报告
 肥料棒市场 - 全球产业规模、份额、趋势、机会及预测(按类型、应用、营养成分、分销管道、地区和竞争格局划分,2021-2031年)
 全球液态硫代硫酸铵市场按等级、作物类型、应用和销售管道划分 - 预测(2026-2032 年)
▼