


 |
市场调查报告书
商品编码
1693517
磷肥:市场占有率分析、产业趋势与统计、成长预测(2025-2030)Phosphatic Fertilizer - Market Share Analysis, Industry Trends & Statistics, Growth Forecasts (2025 - 2030) |
||||||
※ 本网页内容可能与最新版本有所差异。详细情况请与我们联繫。
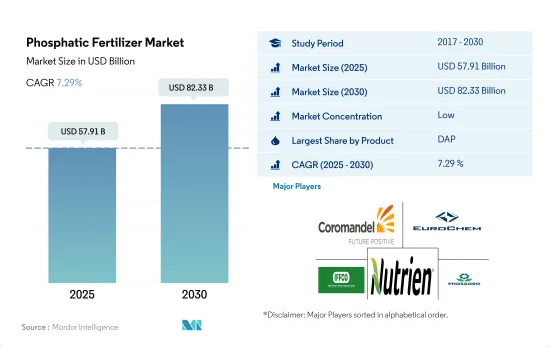
预计 2025 年磷肥市场规模为 579.1 亿美元,到 2030 年将达到 823.3 亿美元,预测期内(2025-2030 年)的复合年增长率为 7.29%。
土壤中磷含量的降低和作物生长对元素磷的需求可能会推动市场
- 2022 年,磷酸二铵(DAP)占据磷肥市场的主导地位,占全球消费份额的 41.3%,相当于 3,090 万吨。 DAP 之所以受欢迎,是因为它含有 46.0% 的磷酸盐和 18.0% 的铵,铵可作为氮源。这使得 DAP 成为全球农民的最佳选择。 2022年,DAP的市值达到233亿美元。
- 磷酸一铵(MAP)已成为 DAP 之后第二大最受欢迎的磷肥。 2022年全球MAP市场价值为113亿美元,消费量1530万吨。值得注意的是,MAP含有约90%的水溶性磷酸盐,超过了作物的生长需求。
- 重过磷酸钙(TSP)是含磷量最高的纯磷酸盐基肥料,为46.0%,占2022年全球磷肥消费量的21.1%。 TSP市场预计将成长,尤其是随着豆类作物种植面积的扩大。
- 2022 年,单过磷酸钙 (SSP) 占全球磷肥消费量的 16.7%。 SSP 因其为食用油提供重要的硫微量元素和在酸性土壤中提供钙营养的作用,在作物中具有重要应用。这些因素表明未来几年 SSP 的使用量可能会增加。
- 磷肥市场预计将经历强劲成长,预计 2023 年至 2030 年的复合年增长率为 7.0%。这一增长主要得益于全球对磷肥的需求不断增长,因为越来越多的农民希望提高作物产量。
提高生产力的需求和解决磷酸盐缺乏症的不断增长的需求预计将推动市场成长。
- 亚太地区占据全球磷肥市场的主导地位,约占整个市场的 58.6%,2022 年累计约 328 亿美元。 2022 年,DAP 在亚太磷肥市场占有 49.8% 的市场占有率。该地区对 DAP 的需求很高,因为它比 TSP 和 SSP 等其他磷肥效率更高。
- 中国是全球领先的磷肥生产国之一,2022年占全球磷肥市场价值份额约10.3%。其出口量约占世界出口量的25.3%。中国最大的进口国是印尼、澳洲和伊朗。
- 北美占第二大市场占有率,为10.6%。磷肥是作物继氮肥之后第二重要的营养源。在北美,磷酸一铵(MAP)占据66.3%的市场份额,磷酸二铵(DAP)占据30.9%的市场份额。 MAP 的高磷酸盐含量推动了需求。
- 2022年,南美磷肥市场将占全球市场的20.3%,预计2023年至2030年的复合年增长率为6.9%。
- 全球磷肥市场的价值和数量一直呈上升趋势,除了 2020 年因 COVID-19 疫情造成的干扰而下降。然而,由于全球种植面积减少,预计市场规模将在 2023 年至 2030 年间恢復。
全球磷肥市场趋势
为满足日益增长的粮食需求,农业面临的压力日益增大,预计将导致田间作物种植面积增加
- 全球农业部门正面临许多挑战。联合国预测,到 2050 年世界人口将超过 90 亿,这可能会给农业带来压力,而农业已经面临劳动力短缺和都市化导致的田地萎缩的困境。联合国粮食及农业组织预测,2050年,全球70%的人口将居住在都市区。随着全球可耕地面积减少,农民越来越依赖化肥来提高作物产量,以满足日益增长的粮食需求。
- 亚太地区是世界主要农业生产地区之一,农业约占该地区劳动力的20%。农田作物是常态,占该地区耕地面积的95%以上。水稻、小麦和玉米是该地区的主要田间作物,占2022年种植面积的24.3%。
- 北美洲是世界第二大可耕地,拥有以田间作物为主的多样化作物组合。其中,玉米、棉花、米、大豆、小麦等产量居于首位,美国农业部对此予以强调。 2022年,美国占北美作物种植面积的46.2%。然而,包括德克萨斯和休士顿等地区遭遇严重洪涝灾害在内的不利条件,导致2017年至2019年期间该国作物面积大幅减少,凸显了农业生产对气候变迁的脆弱性。
菜籽是全世界施用钾肥最多的作物,平均施用量为248.6公斤/公顷。
- 玉米、油菜籽、棉花、高粱、水稻、小麦和大豆是世界着名作物,以营养需求高而闻名。 2022 年这些作物的平均主要养分施用量为:玉米(230.57 公斤/公顷)、油菜籽(255.75 公斤/公顷)、棉花(172.70 公斤/公顷)、高粱(158.46 公斤/公顷)、水稻(154.49 公斤/公顷)(158.46 公斤/公顷?公斤/公顷)。主要营养素对作物至关重要,它们驱动代谢过程并有助于植物必需组织的形成,例如细胞、细胞膜和叶绿素。特别是磷对于种植优质作物至关重要,而钾在激活植物生长所必需的酵素方面起着至关重要的作用。
- 全球田间作物氮、钾、磷养分平均施用量为164.31公斤/公顷。氮是使用最广泛的主要养分,施用率为224.6公斤/公顷,其次是钾,施用率为150.3公斤/公顷。磷排在第三位,预计 2022 年的消费量为 117.9 公斤/公顷。
- 2022年,氮肥施用量最高的是油菜,为347.4公斤/公顷。玉米磷施用量最高,为156.3公斤/公顷,油菜钾施用量菜籽, 248.6公斤/公顷。
- 全球田间作物种植面积正在扩大,其中南美洲和亚太地区的成长尤其显着。这些地区正成为化肥的主要市场。欧洲和北美等已开发地区以及遭受营养缺乏的地区正在转向使用特殊肥料,以提高其有效性。这些动态可能会在未来几年推动主要营养肥料市场的发展。
磷肥业概况
磷肥市场分散,前五大企业占13.55%的市占率。该市场的主要企业有:Coromandel International Ltd.、EuroChem Group、Indian Farmers Fertiliser Cooperative Limited、Nutrien Ltd. 和 PhosAgro Group of Companies(按字母顺序排列)
其他福利
- Excel 格式的市场预测 (ME) 表
- 3个月的分析师支持
目录
第一章执行摘要和主要发现
第二章 报告要约
第三章 引言
- 研究假设和市场定义
- 研究范围
- 调查方法
第四章 产业主要趋势
- 主要作物种植面积
- 田间作物
- 园艺作物
- 平均养分施用量
- 主要营养素
- 田间作物
- 园艺作物
- 主要营养素
- 灌溉农田
- 法律规范
- 价值炼和通路分析
第五章市场区隔
- 类型
- 直的
- 磷
- DAP
- MAP
- SSP
- TSP
- 其他的
- 直的
- 施肥方式
- 受精
- 叶面喷布
- 土壤
- 作物类型
- 田间作物
- 园艺作物
- 草坪和观赏植物
- 地区
- 亚太地区
- 澳洲
- 孟加拉
- 中国
- 印度
- 印尼
- 日本
- 巴基斯坦
- 菲律宾
- 泰国
- 越南
- 其他亚太地区
- 欧洲
- 法国
- 德国
- 义大利
- 荷兰
- 俄罗斯
- 西班牙
- 乌克兰
- 英国
- 其他欧洲国家
- 中东和非洲
- 奈及利亚
- 沙乌地阿拉伯
- 南非
- 土耳其
- 其他中东和非洲地区
- 北美洲
- 加拿大
- 墨西哥
- 美国
- 北美其他地区
- 南美洲
- 阿根廷
- 巴西
- 南美洲其他地区
- 亚太地区
第六章竞争格局
- 关键策略趋势
- 市场占有率分析
- 商业状况
- 公司简介
- Coromandel International Ltd.
- EuroChem Group
- Indian Farmers Fertiliser Cooperative Limited
- K+S Aktiengesellschaft
- Koch Industries Inc.
- Nutrien Ltd.
- PhosAgro Group of Companies
- SABIC Agri-Nutrients Co.
第七章:CEO面临的关键策略问题
第 8 章 附录
- 世界概况
- 概述
- 五力分析框架
- 全球价值链分析
- 市场动态(DRO)
- 资讯来源及延伸阅读
- 图片列表
- 关键见解
- 资料包
- 词彙表
The Phosphatic Fertilizer Market size is estimated at 57.91 billion USD in 2025, and is expected to reach 82.33 billion USD by 2030, growing at a CAGR of 7.29% during the forecast period (2025-2030).
Reducing phosphorous content in the soils and the need for the element in crop growth may drive the market
- Diammonium phosphate (DAP) dominated the phosphatic fertilizer market in 2022, capturing a significant 41.3% global consumption share, equivalent to 30.9 million metric tons. Its popularity stems from its composition, with 46.0% phosphate and 18.0% ammonium, serving as a nitrogen source. This made DAP the top choice for farmers worldwide. The market value of DAP reached USD 23.3 billion in 2022.
- Monoammonium phosphate (MAP) emerged as the second most favored phosphatic fertilizer, trailing behind DAP. The global MAP market, valued at USD 11.3 billion in 2022, witnessed a consumption volume of 15.3 million metric tons. Notably, MAP boasts a water-soluble P content of around 90%, surpassing the crop growth requirements.
- Triple superphosphate (TSP), a pure phosphate-based fertilizer with the highest phosphate content of 46.0%, accounted for 21.1% of global phosphate fertilizer consumption in 2022. The TSP market is poised for growth, especially with the expansion of legume crop cultivation areas.
- Single superphosphate (SSP) constituted 16.7% of global phosphatic fertilizer consumption in 2022. SSP finds significant usage in oilseed crops, owing to its role in providing crucial sulfur trace elements for edible oils and calcium nutrients in acidic soils. These factors indicate a potential uptick in SSP usage in the coming years.
- The phosphatic fertilizer market is projected to witness robust growth, with an estimated CAGR of 7.0% from 2023 to 2030. This growth is primarily driven by the escalating global demand for phosphatic fertilizers as more farmers seek to enhance their crop yields.
The need to improve productivity and rising demand to address the phosphate deficiency are expected to fuel the growth of the market
- The Asia-Pacific region dominated the global phosphatic fertilizer market and accounted for about 58.6% of the total market value, accounting for about USD 32.8 billion in 2022. In 2022, DAP occupied a market share of 49.8% in the Asia-Pacific phosphatic fertilizers market. The greater demand for DAP in the region is due to its greater efficiency than other phosphatic fertilizers like TSP and SSP.
- China was the world's leading producer of phosphorus fertilizers, accounting for nearly 10.3% value share of the global phosphatic fertilizer market in 2022. Its exports represented approximately 25.3% of the world's exports. The top importers from China are Indonesia, Australia, and Iran.
- North America secured the second-largest market share at 10.6%. Phosphatic fertilizers, after nitrogen fertilizers, are the second most crucial nutrient source for crops. In North America, mono ammonium phosphate (MAP) and diammonium phosphate (DAP) dominated the market in 2022, with shares of 66.3% and 30.9%, respectively. The high phosphate content in MAP drove its demand.
- In 2022, the South American phosphatic fertilizer market held a 20.3% share of the global market, and it is projected to register a CAGR of 6.9% during 2023-2030.
- The global phosphatic fertilizer market has witnessed a consistent upward trajectory in both value and volume, barring a dip in 2020, primarily attributed to the disruptions caused by the COVID-19 pandemic. However, the market value is expected to rebound during 2023-2030, driven by a decline in global cultivation areas.
Global Phosphatic Fertilizer Market Trends
The rising pressure on the agriculture industry to meet the growing food demand is expected to increase the area under field crop cultivation
- The global agricultural sector grapples with numerous challenges. The United Nations projects a world population surpassing 9 billion by 2050, potentially straining an agricultural industry already struggling with labor shortages and shrinking fields due to urbanization. The Food and Agriculture Organization predicts that by 2050, 70% of the global population will reside in urban areas. With arable land dwindling worldwide, farmers are increasingly relying on fertilizers to bolster crop yields in an effort to meet the rising demand for food.
- The Asia-Pacific region stands as the leading global agricultural producer, with agriculture employing roughly 20% of its workforce. Field crop cultivation dominates, encompassing over 95% of the region's crop area. Rice, wheat, and corn, collectively occupying 24.3% of the crop area in 2022, are the primary field crops in the region, which is a testament to the region's agricultural diversity and productivity.
- North America ranks as the second-largest arable region globally, boasting a diverse crop portfolio with a focus on field crops. Notably, corn, cotton, rice, soybean, and wheat take center stage, as highlighted by the USDA. In 2022, the United States commanded 46.2% of North America's crop cultivation area. However, adverse environmental conditions, including severe flooding in regions like Texas and Houston, led to a significant drop in the country's crop acreage between 2017 and 2019, underscoring the vulnerability of agricultural production to climate change.
Canola has the highest application rate of potassic fertilizers globally, with an average application rate of 248.6 kg/ha
- Corn, rapeseed, cotton, sorghum, rice, wheat, and soybean are prominent crops globally, known for their high nutrient requirements. The average primary nutrient application rates for these crops in 2022 were as follows: corn (230.57 kg/ha), rapeseed (255.75 kg/ha), cotton (172.70 kg/ha), sorghum (158.46 kg/ha), rice (154.49 kg/ha), wheat (135.35 kg/ha), and soybean (120.97 kg/ha). Primary nutrients are vital for crops, facilitating metabolic processes and contributing to the formation of essential plant tissues, including cells, cell membranes, and chlorophyll. Notably, phosphorus is crucial for cultivating high-quality crops, while potassium plays a pivotal role in activating enzymes necessary for plant growth.
- On a global scale, field crops have an average nutrient application rate of 164.31 kg/ha for nitrogen, potassium, and phosphorus. Nitrogen takes the lead as the most widely used primary nutrient, with an application rate of 224.6 kg/ha, followed by potassium at 150.3 kg/ha. Phosphorus ranks third, with a consumption rate of 117.9 kg/ha in 2022.
- In 2022, rapeseed had the highest nitrogen application rate at 347.4 kg/ha. Corn led in phosphorus application at 156.3 kg/ha, and canola topped in potassium application at 248.6 kg/ha.
- Field crop cultivation is rising globally, with notable growth in South America and Asia-Pacific. These regions are emerging as key markets for fertilizers. Developed regions like Europe and North America, along with areas grappling with nutrient deficiencies, are increasingly turning to specialty fertilizers for their efficacy. These dynamics are poised to fuel the primary nutrient fertilizers market in the coming years.
Phosphatic Fertilizer Industry Overview
The Phosphatic Fertilizer Market is fragmented, with the top five companies occupying 13.55%. The major players in this market are Coromandel International Ltd., EuroChem Group, Indian Farmers Fertiliser Cooperative Limited, Nutrien Ltd. and PhosAgro Group of Companies (sorted alphabetically).
Additional Benefits:
- The market estimate (ME) sheet in Excel format
- 3 months of analyst support
TABLE OF CONTENTS
1 EXECUTIVE SUMMARY & KEY FINDINGS
2 REPORT OFFERS
3 INTRODUCTION
- 3.1 Study Assumptions & Market Definition
- 3.2 Scope of the Study
- 3.3 Research Methodology
4 KEY INDUSTRY TRENDS
- 4.1 Acreage Of Major Crop Types
- 4.1.1 Field Crops
- 4.1.2 Horticultural Crops
- 4.2 Average Nutrient Application Rates
- 4.2.1 Primary Nutrients
- 4.2.1.1 Field Crops
- 4.2.1.2 Horticultural Crops
- 4.2.1 Primary Nutrients
- 4.3 Agricultural Land Equipped For Irrigation
- 4.4 Regulatory Framework
- 4.5 Value Chain & Distribution Channel Analysis
5 MARKET SEGMENTATION (includes market size in Value in USD and Volume, Forecasts up to 2030 and analysis of growth prospects)
- 5.1 Type
- 5.1.1 Straight
- 5.1.1.1 Phosphatic
- 5.1.1.1.1 DAP
- 5.1.1.1.2 MAP
- 5.1.1.1.3 SSP
- 5.1.1.1.4 TSP
- 5.1.1.1.5 Others
- 5.1.1 Straight
- 5.2 Application Mode
- 5.2.1 Fertigation
- 5.2.2 Foliar
- 5.2.3 Soil
- 5.3 Crop Type
- 5.3.1 Field Crops
- 5.3.2 Horticultural Crops
- 5.3.3 Turf & Ornamental
- 5.4 Region
- 5.4.1 Asia-Pacific
- 5.4.1.1 Australia
- 5.4.1.2 Bangladesh
- 5.4.1.3 China
- 5.4.1.4 India
- 5.4.1.5 Indonesia
- 5.4.1.6 Japan
- 5.4.1.7 Pakistan
- 5.4.1.8 Philippines
- 5.4.1.9 Thailand
- 5.4.1.10 Vietnam
- 5.4.1.11 Rest of Asia-Pacific
- 5.4.2 Europe
- 5.4.2.1 France
- 5.4.2.2 Germany
- 5.4.2.3 Italy
- 5.4.2.4 Netherlands
- 5.4.2.5 Russia
- 5.4.2.6 Spain
- 5.4.2.7 Ukraine
- 5.4.2.8 United Kingdom
- 5.4.2.9 Rest of Europe
- 5.4.3 Middle East & Africa
- 5.4.3.1 Nigeria
- 5.4.3.2 Saudi Arabia
- 5.4.3.3 South Africa
- 5.4.3.4 Turkey
- 5.4.3.5 Rest of Middle East & Africa
- 5.4.4 North America
- 5.4.4.1 Canada
- 5.4.4.2 Mexico
- 5.4.4.3 United States
- 5.4.4.4 Rest of North America
- 5.4.5 South America
- 5.4.5.1 Argentina
- 5.4.5.2 Brazil
- 5.4.5.3 Rest of South America
- 5.4.1 Asia-Pacific
6 COMPETITIVE LANDSCAPE
- 6.1 Key Strategic Moves
- 6.2 Market Share Analysis
- 6.3 Company Landscape
- 6.4 Company Profiles
- 6.4.1 Coromandel International Ltd.
- 6.4.2 EuroChem Group
- 6.4.3 Indian Farmers Fertiliser Cooperative Limited
- 6.4.4 K+S Aktiengesellschaft
- 6.4.5 Koch Industries Inc.
- 6.4.6 Nutrien Ltd.
- 6.4.7 PhosAgro Group of Companies
- 6.4.8 SABIC Agri-Nutrients Co.
7 KEY STRATEGIC QUESTIONS FOR FERTILIZER CEOS
8 APPENDIX
- 8.1 Global Overview
- 8.1.1 Overview
- 8.1.2 Porter's Five Forces Framework
- 8.1.3 Global Value Chain Analysis
- 8.1.4 Market Dynamics (DROs)
- 8.2 Sources & References
- 8.3 List of Tables & Figures
- 8.4 Primary Insights
- 8.5 Data Pack
- 8.6 Glossary of Terms


