


 |
市场调查报告书
商品编码
1693519
钾肥:市场占有率分析、产业趋势与统计、成长预测(2025-2030 年)Potash Fertilizer - Market Share Analysis, Industry Trends & Statistics, Growth Forecasts (2025 - 2030) |
||||||
价格
※ 本网页内容可能与最新版本有所差异。详细情况请与我们联繫。
简介目录
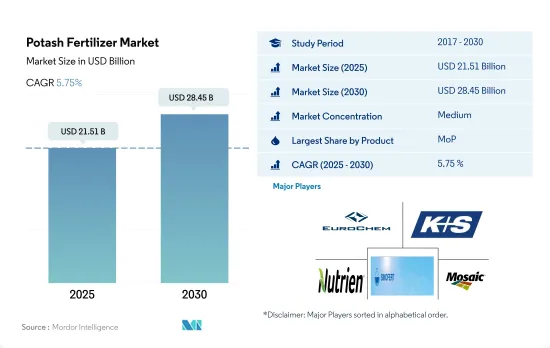
钾肥市场规模预计在 2025 年为 215.1 亿美元,预计到 2030 年将达到 284.5 亿美元,预测期内(2025-2030 年)的复合年增长率为 5.75%。
儘管 SoP 肥料品质优良,但由于价格较高,市场占有率一直难以超越 MoP 肥料。
- 氯化钾(MoP)是钾含量为60.0%的最高钾肥,2022年全球价值为224.4亿美元。同时,其消费量达到3,730万吨,占全球钾肥消费量的86.5%。
- 硫酸钾(SoP)含钾量为50.0%,是全球第二大最受欢迎的钾肥。预计 2022 年全球 SoP 肥料市场规模为 24.1 亿美元,消费量为 280 万吨。
- 2022年,南美洲将成为第二大钾肥市场,市场占有率为28.6%,领先亚太地区的30.0%。主要是因为巴西等南美国家是钾肥生产大国,农作物对钾肥的需求强劲。
- 其他值得注意的钾肥如钾镁矾和光卤石总合占全球钾肥消费量的4.1%。 2022 年,该产业价值 10.6 亿美元,消费量为 170 万吨。
- 钾肥的价格一直高于磷肥和其他钾肥。例如,自2017年以来,SoP的价格几乎是MoP的两倍,而2021年则上涨了一倍以上。儘管 SoP 品质优良,但由于其价格高于 MoP,因此其市场占有率有限。
- 受提高作物生产率的需求不断增长等因素的推动,钾肥市场预计将在 2023 年至 2030 年间增长。
亚太地区主导全球钾肥市场
- 亚太地区在全球钾肥市场占据主导地位,占2022年市场价值的40.0%。分析显示,预计2022年亚太地区钾肥市场规模将达103.7亿美元。依肥料类型划分,常规钾肥约占总量的71.1%,其次是特种钾肥,2022年特种钾肥将占28.8%。
- 受农作物需求旺盛的推动,亚太地区对钾肥的依赖程度较高,是最大的消费地区。 2017-2018年,该地区进口了700万吨钾肥。
- 2022年,南美洲的全球市场占有率达到18.5%。尤其值得注意的是钾肥产业的快速成长,这主要得益于巴西大豆种植面积的扩大。钾肥有助于提高大豆产量,因为它非常适合巴西低肥力、酸性的热带土壤。 2017年,巴西是南美洲唯一一个钾肥使用量增加的国家,达630万吨。
- 欧洲在钾肥市场中排名第三,2022 年的市场占有率为 9.4%。值得注意的是,波兰、比利时和东南欧国家是主要消费国,总合占欧洲肥料市值的 70.5%。预计该产业在 2023 年至 2030 年期间的复合年增长率将达到 5.0%。
- 在新兴市场,土壤缺钾是一个常见的问题。农民越来越多地使用钾肥,不仅是为了纠正钾缺乏症,也是为了提高整体生产力。这一趋势是市场成长的主要驱动力。
全球钾肥市场趋势
为了满足日益增长的粮食需求,农业面临的压力越来越大,预计将导致田间作物种植面积的增加。
- 当前全球农业领域面临许多挑战。根据联合国预测,到 2050 年,世界人口可能会超过 90 亿。人口成长可能会对农业造成过度压力,而由于劳动力短缺和都市化进程加剧导致农地面积减少,农业产量已经下降。根据联合国粮食及农业组织预测,2050年,全球70%的人口预计将居住在城市。随着全球可耕地面积减少,农民需要使用更多的肥料来提高作物产量。
- 亚太地区是世界上最大的农产品生产地区。农业对该地区的经济至关重要,约占总劳动力的 20%。该地区以田间作物种植为主,约占全部区域作物总面积的95%以上。水稻、小麦和玉米是该地区的主要田间作物,2022年约占总耕地面积的24.3%。
- 北美洲是世界上第二大可耕地。该农场种植多种作物,主要为田间作物。尤其是玉米、棉花、稻米、大豆和小麦,都是美国农业部强调的主要田间作物。 2022年,美国占北美作物种植面积的46.2%。然而,2017年至2019年期间,该国作物种植面积大幅下降,主要原因是恶劣天气导致德克萨斯和休士顿等地区发生严重洪灾。
钾激活植物生长发育所必需的酶
- 玉米、油菜籽、棉花、高粱、水稻、小麦和大豆是世界着名作物,以营养需求高而闻名。 2022 年这些作物的平均钾施用量为:玉米(196.8 公斤/公顷)、油菜(248.6 公斤/公顷)、棉花(164.3 公斤/公顷)、高粱(185.3 公斤/公顷)、水稻(67.9 公斤/公顷)、小麦(96.417 公斤/公顷)。作为作物营养均衡方法的一部分,钾不仅在实现最大经济产量方面发挥重要作用,而且还影响作物品质。
- 2022年田间作物钾肥平均施用量为150.3公斤/公顷。油菜籽施钾量最高,248.6公斤/公顷。在严重缺钾的情况下,油菜籽叶片会出现边缘或叶脉间失绿,随后坏死。它们也更容易受到干旱的影响,拥有更多的多年生根,减少光合作用,并限制水分和养分的流动。
- 根据伦敦大学学院的研究,全球整体约有20%的农业土壤面临严重缺钾问题,某些地区更容易出现严重缺钾现象,其中东南亚为44%,撒哈拉以南非洲为30%,东亚为20%。
- 全球田间作物种植面积正在扩大,南美洲和亚太地区的成长尤其显着。这些地区正成为化肥的主要市场。在欧洲和北美等发展中地区以及营养缺乏的地区,特种肥料因其有效性而得到越来越多的采用。预计这些趋势将在 2023 年至 2030 年期间推动钾肥市场的发展。
钾肥业概况
钾肥市场适度整合,前五大企业占46.81%。市场的主要企业有:EuroChem Group、K+S Aktiengesellschaft、Nutrien Ltd.、Sinofert Holdings Limited 和 The Mosaic Company(按字母顺序排列)
其他福利
- Excel 格式的市场预测 (ME) 表
- 3个月的分析师支持
目录
第一章执行摘要和主要发现
第二章 报告要约
第三章 引言
- 研究假设和市场定义
- 研究范围
- 调查方法
第四章 产业主要趋势
- 主要作物种植面积
- 田间作物
- 园艺作物
- 平均养分施用量
- 主要营养素
- 田间作物
- 园艺作物
- 主要营养素
- 灌溉农田
- 法律规范
- 价值炼和通路分析
第五章市场区隔
- 类型
- 直的
- 钾
- MoP
- SoP
- 其他的
- 直的
- 应用
- 受精
- 叶面喷布
- 土壤
- 作物类型
- 田间作物
- 园艺作物
- 草坪和观赏植物
- 地区
- 亚太地区
- 澳洲
- 孟加拉
- 中国
- 印度
- 印尼
- 日本
- 巴基斯坦
- 菲律宾
- 泰国
- 越南
- 其他亚太地区
- 欧洲
- 法国
- 德国
- 义大利
- 荷兰
- 俄罗斯
- 西班牙
- 乌克兰
- 英国
- 其他欧洲国家
- 中东和非洲
- 奈及利亚
- 沙乌地阿拉伯
- 南非
- 土耳其
- 其他中东和非洲地区
- 北美洲
- 加拿大
- 墨西哥
- 美国
- 北美其他地区
- 南美洲
- 阿根廷
- 巴西
- 南美洲其他地区
- 亚太地区
第六章竞争格局
- 关键策略趋势
- 市场占有率分析
- 商业状况
- 公司简介
- Coromandel International Ltd.
- EuroChem Group
- Intrepid Potash Inc.
- K+S Aktiengesellschaft
- Nutrien Ltd.
- Sinofert Holdings Limited
- Sociedad Quimica y Minera de Chile SA
- The Mosaic Company
第七章:CEO面临的关键策略问题
第 8 章 附录
- 世界概况
- 概述
- 五力分析框架
- 全球价值链分析
- 市场动态(DRO)
- 资讯来源及延伸阅读
- 图片列表
- 关键见解
- 资料包
- 词彙表
简介目录
Product Code: 92583
The Potash Fertilizer Market size is estimated at 21.51 billion USD in 2025, and is expected to reach 28.45 billion USD by 2030, growing at a CAGR of 5.75% during the forecast period (2025-2030).
Despite its superior quality, SoP fertilizer has struggled to gain market share over MoP, primarily due to its higher price
- Muriate of potash (MoP), a potassic fertilizer boasting the highest potash content at 60.0%, commanded a global market valuation of USD 22.44 billion in 2022. Concurrently, its consumption reached 37.3 million metric tons, representing a dominant 86.5% of the global potassium fertilizer consumption.
- Sulphate of potash (SoP), with a potassium content of 50.0%, emerged as the second most favored potassium fertilizer worldwide. The global SoP fertilizer market, in 2022, was valued at USD 2.41 billion, with a consumption volume of 2.8 million metric tons.
- South America, with a 28.6% market share in 2022, stands as the second-largest potassic fertilizer market, trailing the Asia-Pacific's 30.0% share. This is primarily due to South American countries, notably Brazil, boasting significant potassic fertilizer production, coupled with a robust demand from their crops.
- Other notable potassic fertilizers, such as langbeinite and carnallite, collectively account for 4.1% of the global potassic fertilizer consumption. In 2022, this segment was valued at USD 1.06 billion, with a consumption volume of 1.7 million metric tons.
- The price of SoP consistently surpasses that of MoP and other potassic fertilizers. For instance, since 2017, the price of SoP has nearly doubled that of MoP, and by 2021, it had more than doubled. Despite its superior quality, the higher price of SoP has limited its market share compared to MoP.
- The potassic fertilizer market is poised for growth during 2023-2030, driven by factors like the escalating demand for enhanced crop productivity.
Asia-Pacific dominates the global potash fertilizers market
- Asia-Pacific dominates the global potash fertilizers market, accounting for 40.0% of the market value in 2022. According to the analysis, the Asia-Pacific potash fertilizer market was valued at USD 10.37 billion in 2022. By fertilizer type, conventional potash fertilizers dominate the fertilizer market, accounting for about 71.1%, followed by specialty potash fertilizers contributing to 28.8% in 2022.
- The Asia-Pacific, driven by its robust crop demand, notably relies on potash fertilizers, making it the largest consumer. Between 2017 and 2018, the region imported a substantial 7.0 million metric tons of potash fertilizers.
- South America secured the global market share of 18.5% slice in 2022. Notably, the potassic fertilizer segment is witnessing rapid growth, primarily fueled by the expanding soybean cultivation in Brazil. Given its suitability for Brazil's low-fertility and acidic tropical soils, potassic fertilizers are aiding in boosting soybean yields. In 2017, Brazil alone accounted for the highest potash fertilizer usage in South America, reaching 6.3 million metric tons.
- Europe, with an 9.4% market share in 2022, stood as the third-largest potash fertilizer market. Notably, countries like Poland, Belgium, and those in Southeastern Europe are the major consumers, collectively representing 70.5% of Europe's fertilizer market value. This segment is projected to register a CAGR of 5.0% from 2023 to 2030.
- Across developing markets, potassium deficiency is a common issue in soils. Farmers are increasingly turning to potash fertilizers, not only to rectify potassium deficiencies but also to enhance their overall productivity. This trend is a significant driver for the market's growth.
Global Potash Fertilizer Market Trends
The rising pressure on the agriculture industry to meet the growing demand for food is expected to increase the area under field crop cultivation
- The global agricultural sector is currently facing many challenges. According to the UN, the world population will likely exceed nine billion by 2050. This population growth may overburden the agricultural industry, which is already experiencing an output loss due to a lack of laborers and the shrinkage of agricultural fields caused by rising urbanization. According to the Food and Agriculture Organization, 70% of the global population is expected to live in cities by 2050. Due to the global loss of arable land, farmers now need to utilize more fertilizers to increase crop yields.
- Asia-Pacific is the world's largest producer of agricultural products. Agriculture is critical to the region's economy, as it employs about 20% of the total available workforce. Field crop cultivation dominates the region, accounting for about more than 95% of the total crop area in the region. Rice, wheat, and corn are the major field crops produced in the region, together accounting for about 24.3% of the total crop area in 2022.
- North America ranks as the second-largest arable region globally. Its farms cultivate a diverse range of crops, with a focus on field crops. Notably, corn, cotton, rice, soybean, and wheat are the prominent field crops, as highlighted by the USDA. In 2022, the United States commanded 46.2% of North America's crop cultivation area. However, the country witnessed a significant drop in crop acreage between 2017 and 2019, primarily due to adverse environmental conditions, leading to severe flooding in regions like Texas and Houston.
Potassium activates the enzymes needed for plant growth and development
- Corn, rapeseed, cotton, sorghum, rice, wheat, and soybean are prominent crops globally, known for their high nutrient requirements. The average potassium application rates for these crops in 2022 were as follows: corn (196.8 kg/ha), rapeseed (248.6 kg/ha), cotton (164.3 kg/ha), sorghum (185.3 kg/ha), rice (67.9 kg/ha), wheat (96.4 kg/ha), and soybean (181.7 kg/ha). Potassium plays a major role in achieving the maximum economic yield, as part of a balanced approach to crop nutrition, as well as influencing crop quality.
- The average application rate for potassium in field crops stood at 150.3 kg/ha in 2022. The rapeseed had the highest potassium application rate recorded at 248.6 kg/ha. In the case of acute potassium deficiency, the leaves of rapeseed show marginal or interveinal chlorosis followed by patches of necrosis. It will also lead to greater drought susceptibility, increased lodging, reduced photosynthesis, and restricted movement of water and nutrients around the plant.
- According to University College London, The researchers reported that globally, about 20% of agricultural soils face severe potassium deficiency, with particular regions likely to experience more critical shortages, including 44% of agricultural soils in Southeast Asia, 30% in Sub-Saharan Africa, and 20% in East Asia which will further drive the potash fertilizers usage.
- The cultivation area for field crops is expanding globally, with notable growth in South America and Asia-Pacific. These regions are emerging as key markets for fertilizers. Developed regions like Europe and North America and areas grappling with nutrient deficiencies are increasingly adopting specialty fertilizers for their efficacy. These trends are expected to fuel the potash fertilizers market during 2023-2030.
Potash Fertilizer Industry Overview
The Potash Fertilizer Market is moderately consolidated, with the top five companies occupying 46.81%. The major players in this market are EuroChem Group, K+S Aktiengesellschaft, Nutrien Ltd., Sinofert Holdings Limited and The Mosaic Company (sorted alphabetically).
Additional Benefits:
- The market estimate (ME) sheet in Excel format
- 3 months of analyst support
TABLE OF CONTENTS
1 EXECUTIVE SUMMARY & KEY FINDINGS
2 REPORT OFFERS
3 INTRODUCTION
- 3.1 Study Assumptions & Market Definition
- 3.2 Scope of the Study
- 3.3 Research Methodology
4 KEY INDUSTRY TRENDS
- 4.1 Acreage Of Major Crop Types
- 4.1.1 Field Crops
- 4.1.2 Horticultural Crops
- 4.2 Average Nutrient Application Rates
- 4.2.1 Primary Nutrients
- 4.2.1.1 Field Crops
- 4.2.1.2 Horticultural Crops
- 4.2.1 Primary Nutrients
- 4.3 Agricultural Land Equipped For Irrigation
- 4.4 Regulatory Framework
- 4.5 Value Chain & Distribution Channel Analysis
5 MARKET SEGMENTATION (includes market size in Value in USD and Volume, Forecasts up to 2030 and analysis of growth prospects)
- 5.1 Type
- 5.1.1 Straight
- 5.1.1.1 Potassic
- 5.1.1.1.1 MoP
- 5.1.1.1.2 SoP
- 5.1.1.1.3 Others
- 5.1.1 Straight
- 5.2 Application Mode
- 5.2.1 Fertigation
- 5.2.2 Foliar
- 5.2.3 Soil
- 5.3 Crop Type
- 5.3.1 Field Crops
- 5.3.2 Horticultural Crops
- 5.3.3 Turf & Ornamental
- 5.4 Region
- 5.4.1 Asia-Pacific
- 5.4.1.1 Australia
- 5.4.1.2 Bangladesh
- 5.4.1.3 China
- 5.4.1.4 India
- 5.4.1.5 Indonesia
- 5.4.1.6 Japan
- 5.4.1.7 Pakistan
- 5.4.1.8 Philippines
- 5.4.1.9 Thailand
- 5.4.1.10 Vietnam
- 5.4.1.11 Rest of Asia-Pacific
- 5.4.2 Europe
- 5.4.2.1 France
- 5.4.2.2 Germany
- 5.4.2.3 Italy
- 5.4.2.4 Netherlands
- 5.4.2.5 Russia
- 5.4.2.6 Spain
- 5.4.2.7 Ukraine
- 5.4.2.8 United Kingdom
- 5.4.2.9 Rest of Europe
- 5.4.3 Middle East & Africa
- 5.4.3.1 Nigeria
- 5.4.3.2 Saudi Arabia
- 5.4.3.3 South Africa
- 5.4.3.4 Turkey
- 5.4.3.5 Rest of Middle East & Africa
- 5.4.4 North America
- 5.4.4.1 Canada
- 5.4.4.2 Mexico
- 5.4.4.3 United States
- 5.4.4.4 Rest of North America
- 5.4.5 South America
- 5.4.5.1 Argentina
- 5.4.5.2 Brazil
- 5.4.5.3 Rest of South America
- 5.4.1 Asia-Pacific
6 COMPETITIVE LANDSCAPE
- 6.1 Key Strategic Moves
- 6.2 Market Share Analysis
- 6.3 Company Landscape
- 6.4 Company Profiles
- 6.4.1 Coromandel International Ltd.
- 6.4.2 EuroChem Group
- 6.4.3 Intrepid Potash Inc.
- 6.4.4 K+S Aktiengesellschaft
- 6.4.5 Nutrien Ltd.
- 6.4.6 Sinofert Holdings Limited
- 6.4.7 Sociedad Quimica y Minera de Chile SA
- 6.4.8 The Mosaic Company
7 KEY STRATEGIC QUESTIONS FOR FERTILIZER CEOS
8 APPENDIX
- 8.1 Global Overview
- 8.1.1 Overview
- 8.1.2 Porter's Five Forces Framework
- 8.1.3 Global Value Chain Analysis
- 8.1.4 Market Dynamics (DROs)
- 8.2 Sources & References
- 8.3 List of Tables & Figures
- 8.4 Primary Insights
- 8.5 Data Pack
- 8.6 Glossary of Terms


