


 |
市场调查报告书
商品编码
1693532
叶面肥料:市场占有率分析、产业趋势与统计、成长预测(2025-2030)Foliar Fertilizer - Market Share Analysis, Industry Trends & Statistics, Growth Forecasts (2025 - 2030) |
||||||
※ 本网页内容可能与最新版本有所差异。详细情况请与我们联繫。
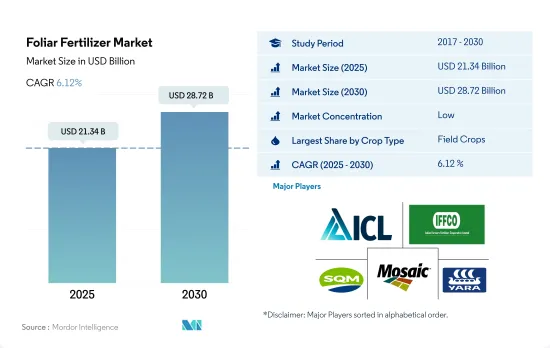
叶面肥料市场规模预计在 2025 年为 213.4 亿美元,预计到 2030 年将达到 287.2 亿美元,预测期内(2025-2030 年)的复合年增长率为 6.12%。
叶面喷布的各种好处促使人们纷纷叶面喷布。
- 至2022年,农田作物部分将占叶面肥料市场总量的78.4%。全球超过85%的农业用地集中在田间作物的种植上,作物农田作物则需要使用大量的叶面肥料。
- 2022 年,亚太地区和北美占据了叶面作物市场总量的 70.2%。这是因为该地区有大片区域种植田间作物,约占同期世界田间作物种植面积的 58.0%。 2022年,北美占田间作物叶面肥料使用量的26.8%,亚太地区占43.3%。
- 园艺作物占全球叶面肥料价值份额的 18.2%,2022 年为 43.7 亿美元。叶面施肥可以将营养物质精确、有针对性地直接输送到植物叶片。这在园艺中尤其有益,因为需要满足不同作物和生长阶段的特定营养需求。此外,叶面喷布可以快速应对营养缺乏的情况,确保在植物最需要的时候提供必需的营养。由于这些因素,全部区域叶面肥料的使用量显着增加。
- 就以金额为准,草坪和观赏作物领域对叶面肥料的需求预计在 2023 年至 2030 年期间实现 5.9% 的复合年增长率。需求的增长是由于人们对观赏作物的需求不断增长,以提高美感和生活质量,以及公共场所草坪维护的需求。
土壤养分普遍缺乏,推动叶面肥料需求成长
- 叶面施肥在世界各地的作物生产中被广泛采用,尤其是在谷物和园艺行业。这种方法可以快速应对营养缺乏,并确保植物在关键生长阶段获得重要的营养。
- 2022年,亚太地区将占据叶面肥料市场的最大份额,价值为113亿美元,消费量为1,190万吨。田间作物占据了大部分份额,占据了72.4%的市场份额,价值达82亿美元。
- 欧洲是叶面肥料市场的主要参与者,到 2022 年将占据 16.0% 的市场份额,在研究期间将实现 76.9% 的强劲成长。微量营养素缺乏,尤其是锰、锌和铁的缺乏,对欧洲部分地区的作物品质和产量造成影响。根据研究,该地区约有 60.0% 和 28.0% 的土壤分别缺乏铁和锌,这推动了市场的发展。
- 南美洲为全球叶面喷布市场贡献了5.8%。在审查期间,该地区出现了显着增长,叶面喷布市场增长了 62.1%,消费量增长了 27.1%。预计 2023 年至 2030 年期间市场价值的复合年增长率为 5.9%。
- 由于精密农业、保护性农业的采用以及对土壤微量营养素的不断增长以提高农业产量,全球对叶面肥料的需求预计将增加。叶面施肥将推动这一需求,因为它可以为叶子提供营养,预计从 2023 年到 2030 年的复合年增长率为 5.9%。
叶面肥料的全球趋势
为满足日益增长的粮食需求,农业面临的压力日益增大,预计将导致田间作物种植面积增加
- 全球农业部门面临许多挑战。根据联合国预测,到 2050 年,世界人口可能超过 90 亿。人口成长可能对农业造成过度压力,而由于劳动力短缺和都市化进程加剧导致农地面积减少,农业产量已经下降。根据联合国粮食及农业组织预测,2050年,全球70%的人口预计将居住在城市。随着全球可耕地面积减少,农民需要使用更多的肥料来提高作物产量。
- 亚太地区是世界上最大的农产品生产地区。农业对该地区的经济至关重要,约占总劳动力的 20%。该地区以田间作物种植为主,约占全部区域作物总面积的95%以上。水稻、小麦和玉米是该地区的主要田间作物,2022年约占总耕地面积的24.3%。
- 北美洲是世界上第二大可耕地。该农场种植多种作物,主要为田间作物。尤其是玉米、棉花、稻米、大豆和小麦,都是美国农业部强调的主要田间作物。 2022年,美国占北美作物种植面积的46.2%。然而,2017年至2019年期间,该国作物面积大幅下降,主要原因是恶劣天气导致德克萨斯和休士顿等地区发生严重洪灾。
全球田间作物主要养分氮、钾、磷的平均施用量为164.31公斤/公顷。
- 玉米、油菜籽、棉花、高粱、水稻、小麦和大豆是世界主要的营养密集型作物。 2022年,这些作物的平均一次养分施用量为玉米230.57公斤/公顷、油菜籽255.75公斤/公顷、棉花172.70公斤/公顷、高粱158.46公斤/公顷、水稻154.49公斤/公顷、小麦135公顷.35/709公斤。主要营养素对作物至关重要,因为它们驱动植物中的重要代谢过程,并有助于细胞、细胞膜和叶绿素等重要组织的形成。其中,磷对于种植优质作物至关重要,而钾在激活植物生长所必需的酵素方面起着关键作用。
- 全球田间作物氮、钾、磷的平均施用量为164.31公斤/公顷。氮肥是使用最广泛的基肥,2022年的施用量为224.6公斤/公顷。其次是钾肥,施用量为150.3公斤/公顷,磷肥施用量排名第三,为117.9公斤/公顷。
- 2022年,氮肥施用量最高的是油菜,为347.4公斤/公顷。玉米磷施用量最高,为156.3公斤/公顷,菜籽钾施用量最高,248.6公斤/公顷。全球田间作物种植正在兴起,其中南美洲和亚太地区的成长尤其显着。这些地区正成为化肥的潜在市场。欧洲和北美等发展中地区以及面临营养缺乏的地区由于其有效性而越来越多地采用特种肥料。预计这些趋势将在 2023 年至 2030 年期间推动主要营养肥料市场的发展。
叶面肥料业概况
叶面肥料市场分散,前五大企业占32.55%。该市场的主要企业有:ICL Group Ltd、Indian Farmers Fertiliser Cooperative Limited、Sociedad Quimica y Minera de Chile SA、The Mosaic Company 和 Yara International ASA(按字母顺序排列)
其他福利
- Excel 格式的市场预测 (ME) 表
- 3个月的分析师支持
目录
第一章执行摘要和主要发现
第二章 报告要约
第三章 引言
- 研究假设和市场定义
- 研究范围
- 调查方法
第四章 产业主要趋势
- 主要作物种植面积
- 田间作物
- 园艺作物
- 平均养分施用量
- 微量营养素
- 田间作物
- 园艺作物
- 主要营养素
- 田间作物
- 园艺作物
- 次要宏量营养素
- 田间作物
- 园艺作物
- 微量营养素
- 灌溉农田
- 法律规范
- 价值炼和通路分析
第五章市场区隔
- 类型
- 复合型
- 直的
- 按营养成分
- 微量营养素
- 氮
- 磷酸
- 钾
- 次要营养物质
- 作物类型
- 田间作物
- 园艺作物
- 草坪和观赏植物
- 地区
- 亚太地区
- 澳洲
- 孟加拉
- 中国
- 印度
- 印尼
- 日本
- 巴基斯坦
- 菲律宾
- 泰国
- 越南
- 其他亚太地区
- 欧洲
- 法国
- 德国
- 义大利
- 荷兰
- 俄罗斯
- 西班牙
- 乌克兰
- 英国
- 其他欧洲国家
- 中东和非洲
- 奈及利亚
- 沙乌地阿拉伯
- 南非
- 土耳其
- 其他中东和非洲地区
- 北美洲
- 加拿大
- 墨西哥
- 美国
- 北美其他地区
- 南美洲
- 阿根廷
- 巴西
- 南美洲其他地区
- 亚太地区
第六章 竞争格局
- 关键策略趋势
- 市场占有率分析
- 商业状况
- 公司简介
- Grupa Azoty SA(Compo Expert)
- Haifa Group
- ICL Group Ltd
- Indian Farmers Fertiliser Cooperative Limited
- Sociedad Quimica y Minera de Chile SA
- The Mosaic Company
- UPL Limited
- Yara International ASA
第七章:CEO面临的关键策略问题
第 8 章 附录
- 世界概况
- 概述
- 五力分析框架
- 全球价值链分析
- 市场动态(DRO)
- 资讯来源及延伸阅读
- 图片列表
- 关键见解
- 资料包
- 词彙表
The Foliar Fertilizer Market size is estimated at 21.34 billion USD in 2025, and is expected to reach 28.72 billion USD by 2030, growing at a CAGR of 6.12% during the forecast period (2025-2030).
The various benefits associated with a foliar application are driving the adoption of the foliar method
- The field crops segment accounted for 78.4% of the overall foliar fertilizer market value in 2022. More than 85% of the world's agricultural acreage is focused on the cultivation of field crops, which accounts for the huge use of foliar fertilizers by these crops.
- Asia-Pacific and North America together held a market value share of 70.2% in 2022 of the total foliar field crop market. This was due to the presence of a large field crop cultivation area, which accounted for about 58.0% of the total field crop cultivation area worldwide during the same period. North America accounted for 26.8%, and Asia-Pacific accounted for a share of 43.3% of the usage of foliar fertilizers in field crops in 2022.
- The horticultural crops held a value share of 18.2% of the global foliar fertilizer value and accounted for USD 4.37 billion in 2022. Foliar fertilization allows for precise and targeted nutrient delivery directly to the plant's leaves. This is particularly beneficial in horticulture, where specific nutrient requirements for different crops and stages of growth need to be met. Furthermore, the foliar application provides a quick response to nutrient deficiencies, ensuring that plants receive essential nutrients when they need them most. Due to these factors, the adoption of foliar fertilizers is growing significantly across the region.
- The demand for foliar fertilizers in the turf and ornament crop segment is projected to register a CAGR of 5.9% in terms of value from 2023 to 2030. This uptick is driven by the increasing demand for ornamentals to enhance aesthetics and quality of life, as well as the need for turf maintenance in public spaces.
The rising prevalence of soil nutrient deficiencies is driving the demand for foliar fertilizers
- Foliar application of fertilizers is a widely adopted practice in global crop production, especially in the cereal and horticulture industries. This method offers a swift response to nutrient deficiencies, ensuring plants receive vital nutrients at critical growth stages.
- In 2022, Asia-Pacific held the largest share in the foliar fertilizer market, reaching a value of USD 11.3 billion, with a consumption volume of 11.9 million metric tons. Field crops accounted for the majority share, capturing 72.4% of the market, valued at USD 8.2 billion.
- Europe, a significant player in the foliar fertilizer market, held a 16.0% market value share in 2022, witnessing a robust growth of 76.9% during the study period. Micronutrient deficiencies, particularly in manganese, zinc, and iron, have been a concern for crop quality and yield in several European regions. Studies indicate that around 60.0% and 28.0% of the region's soil had insufficient iron and zinc levels, respectively, underscoring the market's growth drivers.
- South America contributed 5.8% to the global foliar market. During the study period, the region saw a notable uptick, with the foliar market growing by 62.1% and consumption by volume rising by 27.1%. Projections indicate a 5.9% CAGR for the market value from 2023 to 2030.
- The global demand for foliar fertilizers is set to rise, driven by the adoption of precision farming, protected agriculture, and a heightened need for soil micronutrients to enhance agricultural yields. Foliar fertilization, with its targeted nutrient delivery to leaves, is expected to fuel this demand, leading to a projected 5.9% CAGR from 2023 to 2030.
Global Foliar Fertilizer Market Trends
The rising pressure on the agriculture industry to meet the growing demand for food is expected to increase the area under field crop cultivation
- The global agricultural sector is facing many challenges. According to the UN, the world population may exceed 9 billion by 2050. This population growth may overburden the agricultural industry, which is already experiencing an output loss due to a lack of laborers and the shrinkage of agricultural fields caused by rising urbanization. According to the Food and Agriculture Organization, 70% of the global population is expected to live in cities by 2050. Due to the global loss of arable land, farmers now need to utilize more fertilizers to increase crop yields.
- Asia-Pacific is the world's largest producer of agricultural products. Agriculture is critical to the region's economy, as it employs about 20% of the total available workforce. Field crop cultivation dominates the region, accounting for about more than 95% of the total crop area in the region. Rice, wheat, and corn are the major field crops produced in the region, together accounting for about 24.3% of the total crop area in 2022.
- North America ranks as the second-largest arable region globally. Its farms cultivate a diverse range of crops, with a focus on field crops. Notably, corn, cotton, rice, soybean, and wheat are the prominent field crops, as highlighted by the USDA. In 2022, the United States commanded 46.2% of North America's crop cultivation area. However, the country witnessed a significant drop in crop acreage between 2017 and 2019, primarily due to adverse environmental conditions, leading to severe flooding in regions like Texas and Houston.
The global average application rate of primary nutrient nitrogen, potassium, and phosphorus in field crops is 164.31 kg/ha
- Corn, rapeseed, cotton, sorghum, rice, wheat, and soybean are among the primary nutrient-intensive crops globally. In 2022, the average primary nutrient application rates for these crops were as follows: corn - 230.57 kg/ha, rapeseed - 255.75 kg/ha, cotton - 172.70 kg/ha, sorghum - 158.46 kg/ha, rice - 154.49 kg/ha, wheat - 135.35 kg/ha, and soybean - 120.97 kg/ha. Primary nutrients are vital for crops as they facilitate essential plant metabolic processes and contribute to the formation of crucial tissues like cells, cell membranes, and chlorophyll. Notably, phosphorus is pivotal for cultivating high-quality crops, while potassium plays a key role in activating enzymes necessary for plant growth.
- On a global scale, field crops have an average application rate of 164.31 kg/ha for nitrogen, potassium, and phosphorus. Nitrogen takes the lead as the most widely used primary nutrient fertilizer, with an application rate of 224.6 kg/ha in 2022. Potassic fertilizers follow, with an application rate of 150.3 kg/ha, and phosphorus ranks third, with an application rate of 117.9 kg/ha.
- In 2022, rapeseed had the highest nitrogen application rate at 347.4 kg/ha. Corn led in phosphorus application, with a rate of 156.3 kg/ha, while canola topped the charts for potassium application at 248.6 kg/ha. Field crop cultivation is on the rise globally, with notable growth in South America and the Asia-Pacific region. These regions are emerging as potential markets for fertilizers. Developed regions like Europe and North America, along with areas facing nutrient deficiencies, are increasingly adopting specialty fertilizers for their efficacy. These trends are expected to propel the primary nutrient fertilizers market from 2023 to 2030.
Foliar Fertilizer Industry Overview
The Foliar Fertilizer Market is fragmented, with the top five companies occupying 32.55%. The major players in this market are ICL Group Ltd, Indian Farmers Fertiliser Cooperative Limited, Sociedad Quimica y Minera de Chile SA, The Mosaic Company and Yara International ASA (sorted alphabetically).
Additional Benefits:
- The market estimate (ME) sheet in Excel format
- 3 months of analyst support
TABLE OF CONTENTS
1 EXECUTIVE SUMMARY & KEY FINDINGS
2 REPORT OFFERS
3 INTRODUCTION
- 3.1 Study Assumptions & Market Definition
- 3.2 Scope of the Study
- 3.3 Research Methodology
4 KEY INDUSTRY TRENDS
- 4.1 Acreage Of Major Crop Types
- 4.1.1 Field Crops
- 4.1.2 Horticultural Crops
- 4.2 Average Nutrient Application Rates
- 4.2.1 Micronutrients
- 4.2.1.1 Field Crops
- 4.2.1.2 Horticultural Crops
- 4.2.2 Primary Nutrients
- 4.2.2.1 Field Crops
- 4.2.2.2 Horticultural Crops
- 4.2.3 Secondary Macronutrients
- 4.2.3.1 Field Crops
- 4.2.3.2 Horticultural Crops
- 4.2.1 Micronutrients
- 4.3 Agricultural Land Equipped For Irrigation
- 4.4 Regulatory Framework
- 4.5 Value Chain & Distribution Channel Analysis
5 MARKET SEGMENTATION (includes market size in Value in USD and Volume, Forecasts up to 2030 and analysis of growth prospects)
- 5.1 Type
- 5.1.1 Complex
- 5.1.2 Straight
- 5.1.2.1 By Nutrient
- 5.1.2.1.1 Micronutrients
- 5.1.2.1.2 Nitrogenous
- 5.1.2.1.3 Phosphatic
- 5.1.2.1.4 Potassic
- 5.1.2.1.5 Secondary Macronutrients
- 5.2 Crop Type
- 5.2.1 Field Crops
- 5.2.2 Horticultural Crops
- 5.2.3 Turf & Ornamental
- 5.3 Region
- 5.3.1 Asia-Pacific
- 5.3.1.1 Australia
- 5.3.1.2 Bangladesh
- 5.3.1.3 China
- 5.3.1.4 India
- 5.3.1.5 Indonesia
- 5.3.1.6 Japan
- 5.3.1.7 Pakistan
- 5.3.1.8 Philippines
- 5.3.1.9 Thailand
- 5.3.1.10 Vietnam
- 5.3.1.11 Rest of Asia-Pacific
- 5.3.2 Europe
- 5.3.2.1 France
- 5.3.2.2 Germany
- 5.3.2.3 Italy
- 5.3.2.4 Netherlands
- 5.3.2.5 Russia
- 5.3.2.6 Spain
- 5.3.2.7 Ukraine
- 5.3.2.8 United Kingdom
- 5.3.2.9 Rest of Europe
- 5.3.3 Middle East & Africa
- 5.3.3.1 Nigeria
- 5.3.3.2 Saudi Arabia
- 5.3.3.3 South Africa
- 5.3.3.4 Turkey
- 5.3.3.5 Rest of Middle East & Africa
- 5.3.4 North America
- 5.3.4.1 Canada
- 5.3.4.2 Mexico
- 5.3.4.3 United States
- 5.3.4.4 Rest of North America
- 5.3.5 South America
- 5.3.5.1 Argentina
- 5.3.5.2 Brazil
- 5.3.5.3 Rest of South America
- 5.3.1 Asia-Pacific
6 COMPETITIVE LANDSCAPE
- 6.1 Key Strategic Moves
- 6.2 Market Share Analysis
- 6.3 Company Landscape
- 6.4 Company Profiles
- 6.4.1 Grupa Azoty S.A. (Compo Expert)
- 6.4.2 Haifa Group
- 6.4.3 ICL Group Ltd
- 6.4.4 Indian Farmers Fertiliser Cooperative Limited
- 6.4.5 Sociedad Quimica y Minera de Chile SA
- 6.4.6 The Mosaic Company
- 6.4.7 UPL Limited
- 6.4.8 Yara International ASA
7 KEY STRATEGIC QUESTIONS FOR FERTILIZER CEOS
8 APPENDIX
- 8.1 Global Overview
- 8.1.1 Overview
- 8.1.2 Porter's Five Forces Framework
- 8.1.3 Global Value Chain Analysis
- 8.1.4 Market Dynamics (DROs)
- 8.2 Sources & References
- 8.3 List of Tables & Figures
- 8.4 Primary Insights
- 8.5 Data Pack
- 8.6 Glossary of Terms

