


 |
市场调查报告书
商品编码
1693543
南美肥料:市场占有率分析、行业趋势和成长预测(2025-2030 年)South America Fertilizers - Market Share Analysis, Industry Trends & Statistics, Growth Forecasts (2025 - 2030) |
||||||
价格
※ 本网页内容可能与最新版本有所差异。详细情况请与我们联繫。
简介目录
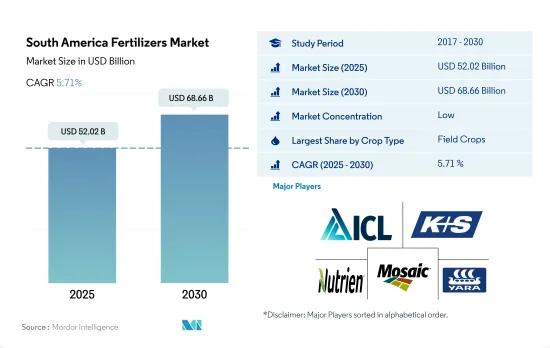
预计 2025 年南美肥料市场规模将达到 520.2 亿美元,到 2030 年将达到 686.6 亿美元,预测期内(2025-2030 年)的复合年增长率为 5.71%。
由于天气模式变化和土壤养分缺乏加剧,肥料市场可望成长
- 按作物类型划分,整个肥料市场规模估计为 481 亿美元,预计 2023-2030 年期间的复合年增长率为 5.6%。就数量而言,总消费量估计为 6,400 万吨,2023 年至 2030 年的复合年增长率为 3.3%。
- 依作物类型划分,田间作物占94.5%,其次是园艺作物,占5.5%。作物和田间作物对该国的贸易和消费都作物,国内外需求的不断增长推动了这一领域的成长。
- 预计2023年至2030年期间田间作物种植面积的复合年增长率为2.2%。该国种植大豆、玉米和小麦等重要作物,并积极进口化肥以满足国内需求。
- 因此,美国、智利和拉丁美洲国家之间的自由贸易协定(FTA)是过去几十年来南美国家水果和蔬菜产量成长的主要因素。这些自由贸易协定包括北美自由贸易组织(NAFTA)(USMCA)、中美洲自由贸易协定-多明尼加共和国以及与智利、哥伦比亚、巴拿马和秘鲁等国的双边协定,预计将进一步刺激该地区的化肥需求。
- 南美肥料市场的成长受到多种因素的推动,包括满足日益增长的需求、提高作物产量和品质以及增加产量。因此,预计 2023 年至 2030 年市场规模的复合年增长率将达到 3.3%。
巴西由于黄豆等主要作物种植面积较大,化肥消费量占比较高。
- 巴西占南美洲国内化肥消费量的73.0%,是该地区化肥使用量最高的国家。巴西市场主要由实用肥料驱动,2022 年将占 95.2% 的绝对份额。其余 4.8% 为专用肥料。
- 阿根廷是全球小麦和大豆出口国,农业对阿根廷 GDP 的贡献率约 5.9%。 2022年,阿根廷将占南美肥料市场的14.6%。与巴西一样,实践肥料占了96.1%的市场份额,专用肥料占3.9%。在特种肥料领域,液体肥料占据主导地位,占44.7%,其次是水溶性肥料,占52.6%。
- 2022 年,除巴西和阿根廷外,南美洲其他地区占据化肥市场的 14.8%。田间作物占 83.1% 的市场占有率,2022 年达到 815 万吨。预测显示,到 2030 年,这一数量将增加至 1,053 万吨,开始显着的成长轨迹。
- 2022年,大豆、玉米、甘蔗等田间作物占据了南美肥料市场的主导地位,占据了94.2%的市场占有率。这些作物在过去二十年中经历了显着的增长,预计未来将继续增长。随着巴西等国家扩大种植面积并努力提高产量,预计这一趋势将持续下去。
- 受人口成长和随之而来的粮食需求激增的推动,南美洲主粮作物种植面积稳定扩大。这一趋势表明该地区的肥料市场预计将在 2023-2030 年期间成长。
南美洲肥料市场趋势
政府为自给自足所做的努力对田间作物作物种植面积的增加做出了巨大贡献。
- 南美洲田间作物种植面积明显增加,从2017年的1.116亿公顷跃升至2022年的1.261亿公顷,总面积增加12.8%。预计种植面积的扩大将刺激该地区的化肥需求。田间作物占据市场主导地位,占96.8%的份额。 2022年,巴西将占最大份额,为56.9%,其次是阿根廷,为29.3%。巴西是全球大豆生产和出口大国,2021年大豆产量约1.35亿吨,其中出口1.055亿吨,占82%。其中,出口产品中,82%为生豆,16%为豆饼,2%为豆油。
- 大豆是南美洲种植面积最大的作物,主要产地为巴西(64.4%)和阿根廷(26.1%)。然而,该地区目前正遭受长期干旱,主要河流的水位处于危险的低点。这造成了严重后果,扰乱了重要夏季作物(尤其是大豆)的收成和运输。因此,这种情况增加了南美洲增加化学肥料施用的需求。
- 受全球强劲需求和良好盈利的推动,南方共同市场地区的大豆种植蓬勃发展。大豆及其他原料价格高企,促使生产商投资新土地和设备,进而扩大改善经营。因此,该地区田间作物种植面积将随着国内和国际市场的成长而扩大。
南美洲田间作物平均一次养分施用量约172.73公斤/公顷。
- 在过去的二十年里,南美洲已经成为田间作物生产的主要参与者。对于大豆、玉米、小麦和玉米来说尤其如此。产量的激增是由于耕地面积的扩大和提高产量的力度加大。值得注意的是,巴西等国家正积极扩大种植面积,这意味着作物产量将进一步增加,化肥消费量也将随之增加。
- 营养素对于植物健康、作物生长和作物产量至关重要。氮、磷、钾是主要营养元素,是植物生长发育的基本成分。这些营养物质的缺乏会对作物的产量和品质产生重大影响,凸显了它们对田间作物的重要性。 2022年,南美洲田间作物大量营养元素的平均施用率为172.7公斤/公顷。其中氮肥用量最高,193.8公斤/公顷,其次是钾肥,181.9公斤/公顷。磷含量略为落后,为142.4公斤/公顷。
- 在田间作物中,小麦、水稻和玉米预计平均养分施用量最高。具体来说,小麦的平均养分施用量预计为每公顷231公斤,水稻和玉米的平均养分施用量预计分别为每公顷156公斤和149公斤。受人口增长和随之而来的主粮作物需求的推动,南美洲的收穫面积正在扩大。这一趋势表明,未来几年该地区田间作物的主要养分使用量将大幅增加。
南美洲肥料产业概况
南美肥料市场细分化,前五大企业占37.12%。该市场的主要企业包括 ICL Group Ltd、K+S Aktiengesellschaft、Nutrien Ltd.、The Mosaic Company、Yara International ASA 等。
其他福利
- Excel 格式的市场预测 (ME) 表
- 3个月的分析师支持
目录
第一章执行摘要和主要发现
第二章 报告要约
第三章 引言
- 研究假设和市场定义
- 研究范围
- 调查方法
第四章 产业主要趋势
- 主要作物种植面积
- 田间作物
- 园艺作物
- 平均养分施用量
- 微量营养素
- 田间作物
- 园艺作物
- 主要营养素
- 田间作物
- 园艺作物
- 次要宏量营养素
- 田间作物
- 园艺作物
- 微量营养素
- 灌溉农田
- 法律规范
- 价值炼和通路分析
第五章市场区隔
- 类型
- 复合型
- 直的
- 微量营养素
- 硼
- 铜
- 铁
- 锰
- 钼
- 锌
- 其他的
- 氮
- 硝酸铵
- 尿素
- 其他的
- 磷酸
- DAP
- MAP
- SSP
- TSP
- 其他的
- 钾
- MoP
- SoP
- 其他的
- 次要营养物质
- 钙
- 镁
- 硫
- 形式
- 传统的
- 特别的
- CRF
- 液体肥料
- SRF
- 水溶性
- 施肥方式
- 受精
- 叶面喷布
- 土壤
- 作物类型
- 田间作物
- 园艺作物
- 草坪和观赏植物
- 原产地
- 阿根廷
- 巴西
- 南美洲其他地区
第六章 竞争格局
- 关键策略趋势
- 市场占有率分析
- 商业状况
- 公司简介
- Fertgrow
- Grupa Azoty SA(Compo Expert)
- Haifa Group
- ICL Group Ltd
- K+S Aktiengesellschaft
- Nortox
- Nutrien Ltd.
- Sociedad Quimica y Minera de Chile SA
- The Mosaic Company
- Yara International ASA
第七章:CEO面临的关键策略问题
第 8 章 附录
- 世界概况
- 概述
- 五力分析框架
- 全球价值链分析
- 市场动态(DRO)
- 资讯来源及延伸阅读
- 图片列表
- 关键见解
- 数据包
- 词彙表
简介目录
Product Code: 92608
The South America Fertilizers Market size is estimated at 52.02 billion USD in 2025, and is expected to reach 68.66 billion USD by 2030, growing at a CAGR of 5.71% during the forecast period (2025-2030).
The fertilizer market is poised for growth due to shifting climate patterns and rising soil nutrient deficiencies
- The overall fertilizer market value by crop type has accounted for USD 48.1 billion and is estimated to record a CAGR of 5.6% during 2023-2030. By volume, the overall consumption accounted for 64.0 million metric tons and is estimated to record a CAGR of 3.3% during 2023-2030.
- By crop type, field crops are dominating the market by 94.5%, followed by horticultural crops with 5.5% of fertilizer consumption value. Both horticultural and field crops are essential to the country's trade and consumption, and the increased domestic and international demand is bolstering the segment's growth.
- The area under field crop cultivation has increased by a CAGR of 2.2% during 2023-2030. With important crops being cultivated in the country, such as soybean, corn, and wheat, the country is actively importing fertilizers to meet the domestic demand, which is driving the growth of the segments.
- Accordingly, Free trade agreements (FTAs) between the United States, Chile, and several Latin American countries have been a major factor in the increase in fruit and vegetable production in South American countries over the last few decades. These FTAs, including NAFTA (USMCA), CAFTA-DR, and bilateral agreements with countries such as Chile, Colombia, Panama, and Peru, are expected to further boost fertilizer demand in the region.
- The growth of the South American fertilizers market is being driven by various factors, including the need to meet the growing demand, improve crop yield and quality, and increase production. As a result, the market volume is expected to register a CAGR of 3.3% from 2023 to 2030.
Due to higher cultivation areas under major crops like soybeans, fertilizer consumption in Brazil leads to a higher share
- Brazil, accounting for 73.0% of South America's domestic fertilizer consumption, leads the region in fertilizer usage. The Brazilian market is predominantly driven by conventional fertilizers, which held a commanding 95.2% share in 2022. Specialty fertilizers made up the remaining 4.8%.
- Argentina, a global exporter of wheat and soybeans, sees agriculture contributing around 5.9% to its GDP. In 2022, Argentina held a 14.6% share of the South American fertilizer market. Similar to Brazil, conventional fertilizers dominated, capturing 96.1% of the market, while specialty fertilizers accounted for 3.9%. Within the specialty segment, liquid fertilizers led at 44.7%, followed by water-soluble fertilizers at 52.6%.
- The Rest of South America, excluding Brazil and Argentina, held a 14.8% share of the regional fertilizer market in 2022. Field crops, commanding an 83.1% market share by volume, reached 8.15 million metric tons in 2022. Projections indicate this volume will climb to 10.53 million metric tons by 2030, representing a significant growth trajectory.
- Field crops, including soybeans, corn, and sugarcane, dominated the South American fertilizer market in 2022, capturing 94.2% of the market share. These crops have witnessed substantial growth over the past two decades, with further increases expected. Driven by countries like Brazil expanding their cultivated areas and aiming for higher yields, this trend is set to continue.
- Driven by a rising population and the subsequent surge in food grain demand, South America has witnessed a consistent expansion in the area dedicated to major food crops. This trend points to a projected growth in the region's fertilizer market during 2023-2030.
South America Fertilizers Market Trends
The government's initiatives to achieve self-sufficiency have significantly contributed to the increase in the area under field crop cultivation.
- The cultivation area for field crops in South America witnessed a notable rise, surging from 111.6 million ha in 2017 to 126.1 million ha in 2022, marking a 12.8% increase in the total area. This expansion in cultivation is projected to drive up the demand for fertilizers in the region. Field crops dominated the market, accounting for a significant 96.8% share. In 2022, Brazil held the maximum share of the market at 56.9%, with Argentina trailing at 29.3%. Brazil, renowned as the global leader in soy production and exports, saw its soy output reach nearly 135 million tonnes in 2021. Of this, a whopping 105.5 million tonnes, constituting 82%, were exported, with 82% in raw soybean form, 16% as soybean cake, and 2% as soybean oil.
- Soybean, commanding the largest cultivated area in South America, is primarily grown in Brazil (64.4%) and Argentina (26.1%). However, the region is currently grappling with an extended drought, leading to critically low water levels in major rivers. This has severe repercussions, hampering both harvests and the transportation of crucial summer crops, especially soybeans. Consequently, these conditions are amplifying the demand for increased fertilizer application in South America.
- Driven by robust global demand and favorable profitability, soybean cultivation in the Mercosur region witnessed a surge. The surge in soy prices, along with other raw materials, has incentivized producers to invest in new lands and equipment, enabling them to scale up operations and enhance efficiency. As a result, the field crop cultivation area in the region is poised to expand in tandem with the growing domestic and international markets.
The average rate of primary nutrient application for field crops in South America is about 172.73 kg/hectare
- Over the past two decades, South America has emerged as a key player in field crop production, notably for soybeans, corn, wheat, and maize. This surge in production can be attributed to both expanded cultivation and intensified efforts to boost yields. Notably, countries like Brazil are actively expanding their cultivated areas, indicating a further uptick in crop production and a subsequent surge in fertilizer consumption.
- Nutrients are pivotal for plant health, crop growth, and crop output. Primary nutrients, namely nitrogen, phosphorus, and potassium, serve as the fundamental building blocks for plant development. Any deficiency in these nutrients can significantly impact both crop yield and quality, underscoring their importance for field crops. In 2022, the average application rate of primary nutrients for field crops in South America stood at 172.7 kg/hectare. Nitrogen topped the list with an application rate of 193.8 kg/hectare, followed by potassium at 181.9 kg/hectare. Phosphorus trailed slightly behind, with an application rate of 142.4 kg/hectare.
- Among the field crops, wheat, rice, and corn/maize are expected to have the highest average nutrient application rate. Specifically, wheat is projected to have an average nutrient application rate of 231 kg/ha, while rice and corn/maize are estimated to have average rates of 156 kg/ha and 149 kg/ha, respectively. Driven by a growing population and subsequent demand for major food crops, South America has witnessed an expansion in harvested areas. This trend points to a significant uptick in primary nutrient usage for field crops in the region in the coming years.
South America Fertilizers Industry Overview
The South America Fertilizers Market is fragmented, with the top five companies occupying 37.12%. The major players in this market are ICL Group Ltd, K+S Aktiengesellschaft, Nutrien Ltd., The Mosaic Company and Yara International ASA (sorted alphabetically).
Additional Benefits:
- The market estimate (ME) sheet in Excel format
- 3 months of analyst support
TABLE OF CONTENTS
1 EXECUTIVE SUMMARY & KEY FINDINGS
2 REPORT OFFERS
3 INTRODUCTION
- 3.1 Study Assumptions & Market Definition
- 3.2 Scope of the Study
- 3.3 Research Methodology
4 KEY INDUSTRY TRENDS
- 4.1 Acreage Of Major Crop Types
- 4.1.1 Field Crops
- 4.1.2 Horticultural Crops
- 4.2 Average Nutrient Application Rates
- 4.2.1 Micronutrients
- 4.2.1.1 Field Crops
- 4.2.1.2 Horticultural Crops
- 4.2.2 Primary Nutrients
- 4.2.2.1 Field Crops
- 4.2.2.2 Horticultural Crops
- 4.2.3 Secondary Macronutrients
- 4.2.3.1 Field Crops
- 4.2.3.2 Horticultural Crops
- 4.2.1 Micronutrients
- 4.3 Agricultural Land Equipped For Irrigation
- 4.4 Regulatory Framework
- 4.5 Value Chain & Distribution Channel Analysis
5 MARKET SEGMENTATION (includes market size in Value in USD and Volume, Forecasts up to 2030 and analysis of growth prospects)
- 5.1 Type
- 5.1.1 Complex
- 5.1.2 Straight
- 5.1.2.1 Micronutrients
- 5.1.2.1.1 Boron
- 5.1.2.1.2 Copper
- 5.1.2.1.3 Iron
- 5.1.2.1.4 Manganese
- 5.1.2.1.5 Molybdenum
- 5.1.2.1.6 Zinc
- 5.1.2.1.7 Others
- 5.1.2.2 Nitrogenous
- 5.1.2.2.1 Ammonium Nitrate
- 5.1.2.2.2 Urea
- 5.1.2.2.3 Others
- 5.1.2.3 Phosphatic
- 5.1.2.3.1 DAP
- 5.1.2.3.2 MAP
- 5.1.2.3.3 SSP
- 5.1.2.3.4 TSP
- 5.1.2.3.5 Others
- 5.1.2.4 Potassic
- 5.1.2.4.1 MoP
- 5.1.2.4.2 SoP
- 5.1.2.4.3 Others
- 5.1.2.5 Secondary Macronutrients
- 5.1.2.5.1 Calcium
- 5.1.2.5.2 Magnesium
- 5.1.2.5.3 Sulfur
- 5.2 Form
- 5.2.1 Conventional
- 5.2.2 Speciality
- 5.2.2.1 CRF
- 5.2.2.2 Liquid Fertilizer
- 5.2.2.3 SRF
- 5.2.2.4 Water Soluble
- 5.3 Application Mode
- 5.3.1 Fertigation
- 5.3.2 Foliar
- 5.3.3 Soil
- 5.4 Crop Type
- 5.4.1 Field Crops
- 5.4.2 Horticultural Crops
- 5.4.3 Turf & Ornamental
- 5.5 Country
- 5.5.1 Argentina
- 5.5.2 Brazil
- 5.5.3 Rest of South America
6 COMPETITIVE LANDSCAPE
- 6.1 Key Strategic Moves
- 6.2 Market Share Analysis
- 6.3 Company Landscape
- 6.4 Company Profiles
- 6.4.1 Fertgrow
- 6.4.2 Grupa Azoty S.A. (Compo Expert)
- 6.4.3 Haifa Group
- 6.4.4 ICL Group Ltd
- 6.4.5 K+S Aktiengesellschaft
- 6.4.6 Nortox
- 6.4.7 Nutrien Ltd.
- 6.4.8 Sociedad Quimica y Minera de Chile SA
- 6.4.9 The Mosaic Company
- 6.4.10 Yara International ASA
7 KEY STRATEGIC QUESTIONS FOR FERTILIZER CEOS
8 APPENDIX
- 8.1 Global Overview
- 8.1.1 Overview
- 8.1.2 Porter's Five Forces Framework
- 8.1.3 Global Value Chain Analysis
- 8.1.4 Market Dynamics (DROs)
- 8.2 Sources & References
- 8.3 List of Tables & Figures
- 8.4 Primary Insights
- 8.5 Data Pack
- 8.6 Glossary of Terms
02-2729-4219
+886-2-2729-4219
 缓释肥料市场:2026-2032年全球市场预测(以包膜类型、作物类型、释放週期、养分类型、施用方法、最终用途和销售管道)
 2026年全球生物炭肥料市场报告几丁质肥料市场:2026-2032年全球市场预测(按应用、类型、原料、配方和分销管道划分)肥料包膜市场:2026-2032年全球市场预测(以包膜化学、释放机制、包膜养分类型、外形规格、製造流程、最终用途及通路划分)化肥市场:2026-2032年全球市场预测(依产品类型、作物类型、包装、施用方法、最终用户和分销管道划分)复合肥料市场:按产品类型、作物类型、物理形态和应用分類的全球市场预测,2026-2032年
 海藻土壤改良剂市场预测至 2034 年—按产品类型、海藻种类、形态、应用、养殖方法、通路和地区进行全球分析。藻类肥料市场:2026-2032年全球市场预测(依原料、产品类型、通路及应用划分)
 全球缓释肥料市场规模、份额、趋势和成长分析报告(2026-2034)全球肥料造粒助剂市场规模、份额、趋势和成长分析报告(2026-2034年)
▼