


 |
市场调查报告书
商品编码
1693557
中国化肥:市场占有率分析、产业趋势与统计、成长预测(2025-2030年)China Fertilizers - Market Share Analysis, Industry Trends & Statistics, Growth Forecasts (2025 - 2030) |
||||||
价格
※ 本网页内容可能与最新版本有所差异。详细情况请与我们联繫。
简介目录
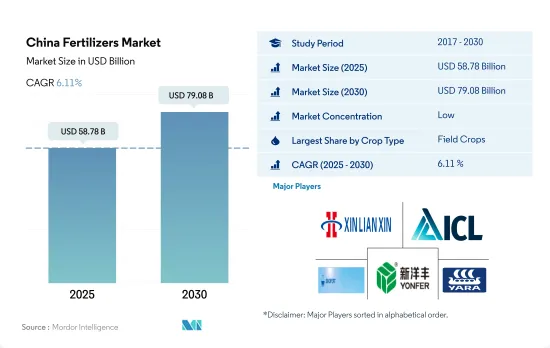
预计 2025 年中国肥料市场规模将达到 587.8 亿美元,预计到 2030 年将达到 790.8 亿美元,预测期内(2025-2030 年)的复合年增长率为 6.11%。
需要施肥的集约化和单一栽培
- 长期连续耕作而不轮作导致农田肥力下降,导致肥料严重短缺,对肥料的需求不断增加,尤其是中国南方。人们对环境污染的担忧日益加剧,推动了对田间作物。
- 田间作物往往是氮肥利用率最高的作物。粗放种植会使谷物和谷类消耗土壤养分,因此需要额外施肥来补充养分。在 2022 年田间作物肥料市场总量中,实践肥料约占 73.3%,专用肥料约占 26.7%。
- 园艺作物全年生长,受益于喷灌和滴灌等更好的浇水方式,并且比田间作物更多地使用特种肥料,鼓励使用水溶性肥料和液体肥料。 2021年,专用肥料约占园艺作物用肥料市场规模的18.7%。
- 到 2022 年,草坪和观赏产品将占国内肥料市场总量的不到 1%。近年来,政府非常重视自给自足,并建立了许多途径,例如温室生产观赏花卉,预计这些途径将支持这一领域的成长。
- 因此,预计田间作物需求的增长和对自给自足的日益重视以减少观赏花卉进口将在 2023 年至 2030 年期间推动该行业的成长。中国是化肥的主要生产国。
中国肥料市场趋势
中国耕地面积的扩大是由于粮食需求的增加和实现主粮自给的目标。
- 中国田间作物种植面积将从2017年的1.305亿公顷减少到2021年的1.278亿公顷,占耕地总面积的71.4%。田间作物中,玉米占34.2%,水稻占23.6%,小麦占18.3%。预计耕地面积的扩大将推动该国的化肥需求。
- 中国通常将田间作物生产分为两个季节:夏春季(4月至9月)和冬季。春季作物主要有早玉米、早稻、早小麦、棉花等,冬季作物主要有冬小麦、油菜等。但稻米和玉米是中国农业的重点作物,占中国粮食产量的三分之一。作为世界最大的稻米生产国,中国将在2022年分配3,000万公顷土地用于稻米种植,预计产量为2.1亿吨。水稻主产区为黑龙江、湖南、江西、湖北、江苏、四川、广西、广东、湖南。预计2022-23年度中国玉米产量将达2.772亿吨,与前一年同期比较增加460万吨,主要原因是单产提高。黑龙江、吉林、内蒙古等东北三省是我国主要的玉米产区。
- 春季仍然是主要的生长季节,但也面临挑战,尤其是在炎热的六月和七月。米是中国数百万人的主食,受到的影响尤其严重。高温加上稀少的降雨会加剧土壤矿物质缺乏,因此需要增加施肥量。干旱的天气状况也对作物产量构成威胁。
全球约28%的氧化亚氮排放排放中国的农业用地。
- 主要营养素可增强酵素活性等生化过程并促进植物细胞生长。这些营养物质的缺乏会对植物的健康、发育和作物产量产生重大影响。 2022年田间作物氮钾磷平均施用量为159.9公斤/公顷。其中,氮占65.23%,磷占28.07%,钾占6.68%。
- 氮作为叶绿素和胺基酸的组成部分,在植物代谢中起着重要作用,是最重要的主要营养元素。 2022年平均施肥率为279.65公斤/公顷。钾肥紧随其后,为 105.3 公斤/公顷,磷肥则紧随其后,为 94.9 公斤/公顷。地表水和地下水受到氮和磷的污染,是因为没有提供农民足够的肥料使用指引。值得注意的是,全球农业用地氧化亚氮排放量约有28%来自中国。
- 2022年,棉花、小麦、玉米和水稻成为平均养分施用量最高的作物,分别为255.41公斤/公顷、232.25公斤/公顷、198.44公斤/公顷和157.76公斤/公顷。中国是世界棉花产量第一大国,2022 年棉花产量达到惊人的 640 万吨,同时也是最大的棉花消费国和进口国。令人印象深刻的是,中国约占全球棉花消费量的20%,其中84%产自新疆维吾尔自治区。
- 由于迫切需要满足不断增长的人口的需求,预计2023年至2030年间田间作物所需的主要养分施用量将会增加。
中国肥料产业概况
中国化肥市场分散,前五大企业市占率合计为12.84%。该市场的主要企业包括河南新联鑫化工集团有限公司、以色列化工集团有限公司、中化化肥控股有限公司、新阳丰农业科技、雅苒国际有限公司等。
其他福利
- Excel 格式的市场预测 (ME) 表
- 3个月的分析师支持
目录
第一章执行摘要和主要发现
第二章 报告要约
第三章 引言
- 研究假设和市场定义
- 研究范围
- 调查方法
第四章 产业主要趋势
- 主要作物种植面积
- 田间作物
- 园艺作物
- 平均养分施用量
- 微量营养素
- 田间作物
- 园艺作物
- 主要营养素
- 田间作物
- 园艺作物
- 次要宏量营养素
- 田间作物
- 园艺作物
- 微量营养素
- 灌溉农田
- 法律规范
- 价值炼和通路分析
第五章市场区隔
- 类型
- 复合型
- 直的
- 微量营养素
- 硼
- 铜
- 铁
- 锰
- 钼
- 锌
- 其他的
- 氮
- 尿素
- 其他的
- 磷酸
- DAP
- MAP
- SSP
- TSP
- 其他的
- 钾
- MoP
- SoP
- 其他的
- 次要营养物质
- 钙
- 镁
- 硫
- 形式
- 传统的
- 特别的
- CRF
- 液体肥料
- SRF
- 水溶性
- 施肥方式
- 受精
- 叶面喷布
- 土壤
- 作物类型
- 田间作物
- 园艺作物
- 草坪和观赏植物
第六章 竞争格局
- 关键策略趋势
- 市场占有率分析
- 商业状况
- 公司简介
- Coromandel International Ltd.
- Grupa Azoty SA(Compo Expert)
- Hebei Monband Water Soluble Fertilizer Co. Ltd
- Hebei Sanyuanjiuqi Fertilizer Co., Ltd.
- Henan XinlianXin Chemicals Group Company Limited
- ICL Group Ltd
- Sinofert Holdings Limited
- Sociedad Quimica y Minera de Chile SA
- Xinyangfeng Agricultural Technology Co., Ltd.
- Yara International ASA
第七章:CEO面临的关键策略问题
第 8 章 附录
- 世界概况
- 概述
- 五力分析框架
- 全球价值链分析
- 市场动态(DRO)
- 资讯来源及延伸阅读
- 图片列表
- 关键见解
- 数据包
- 词彙表
简介目录
Product Code: 92651
The China Fertilizers Market size is estimated at 58.78 billion USD in 2025, and is expected to reach 79.08 billion USD by 2030, growing at a CAGR of 6.11% during the forecast period (2025-2030).
Intensive cultivation and monoculture necessitating the fertilizers use
- Due to continuous long-term cultivation without crop rotation, farmland fertility has been depleted and has become more deficient, increasing the need for fertilizers, especially in South China. Due to growing concerns about environmental pollution, there is a rising demand for sustainable fertilizers in field crops.
- Field crops often utilize the greatest nitrogen fertilizers. Due to their extensive cultivation, grains and cereals deplete soil nutrients, requiring the application of additional fertilizers to make up for it. Conventional fertilizers accounted for about 73.3%, and specialty fertilizers accounted for about 26.7% of the total field crops fertilizer market value in 2022.
- Horticultural crops utilize more specialty fertilizers than field crops since they are grown all year long and benefit from superior watering methods like sprinkler and drip irrigation, which encourage the use of water-soluble and liquid fertilizers. About 18.7% of the market value of fertilizers used in horticultural crops was made up of specialty fertilizers in 2021.
- In 2022, less than 1% of the country's total fertilizer market was made up of turf and ornamental products. Over recent years, the government put greater emphasis on self-sufficiency and established a number of methods, such as the production of ornamental flowers in greenhouses, which are expected to support sectoral growth.
- Therefore, it is projected that the segmental growth will be boosted throughout 2023-2030 due to the rising demand from field crops and increased focus on self-sufficiency to reduce the import of ornamentals. The country is the leading producer of fertilizers.
China Fertilizers Market Trends
China's expanding cultivation area is driven by increased food demand and goal to achieve self-sufficiency in staple food
- In China, the cultivation area for field crops decreased from 130.5 million hectares in 2017 to 127.8 million hectares in 2021, representing 71.4% of the total cultivated area. Corn dominated the field crop landscape with a share of 34.2%, followed by rice and wheat at 23.6% and 18.3%, respectively. This expanding cultivation area is projected to drive up fertilizer demand in the country.
- China typically divides its field crop production into two seasons: summer/spring (April-September) and winter. Spring crops encompass early corn, early rice, early wheat, and cotton, while winter crops focus on winter wheat and rapeseed. Rice and corn, however, take precedence in China's agricultural landscape, accounting for a third of the nation's grain output. As the world's leading rice producer, China allocated 30 million hectares for rice farming in 2022, yielding a harvest of 210 million tonnes. Key rice-producing regions span Heilongjiang, Hunan, Jiangxi, Hubei, Jiangsu, Sichuan, Guangxi, Guangdong, and Yunan. China's corn production for 2022-23 is projected to hit 277.2 million tonnes, up by 4.6 million tonnes from the previous year, primarily due to improved harvests. The Northeast provinces of Heilongjiang, Jilin, and Inner Mongolia stand out as major corn-growing regions.
- While spring remains the primary cropping season, it faces some challenges, particularly during the hotter months of June and July. Rice, a staple for millions in China, is particularly affected. The combination of high temperatures and low precipitation exacerbates mineral depletion in the soil, necessitating higher fertilizer application. These dry weather conditions also pose a risk to crop yields.
About 28% of nitrous oxide emissions from cropland in the world are from China's agricultural lands
- Primary nutrients enhance biochemical processes, such as enzyme activity, and foster plant cell growth. Deficiencies in these nutrients can significantly impact plant health, development, and crop yields. In 2022, the average application rate for nitrogen, potassium, and phosphorus combined in field crops stood at 159.9 kg/hectare. Specifically, nitrogen accounted for 65.23%, phosphorus for 28.07%, and potassium for 6.68% of this average.
- Nitrogen takes the lead among primary nutrients, playing a vital role in plant metabolism as a constituent of chlorophyll and amino acids. Its average application rate in 2022 was 279.65 kg/hectare. Potash followed with 105.3 kg/hectare, and phosphorus trailed slightly at 94.9 kg/hectare. The contamination of surface and groundwater with nitrogen and phosphorus has been attributed to inadequate guidance on fertilizer application rates for farmers. Notably, around 28% of global nitrous oxide emissions from croplands originate from China.
- In 2022, cotton, wheat, corn, and rice emerged as the crops with the highest average nutrient application rates, with figures of 255.41 kg/hectare, 232.25 kg/hectare, 198.44 kg/hectare, and 157.76 kg/hectare, respectively. China led the world in cotton production, with a staggering 6.4 million metric tons in 2022. It also held the title of the largest consumer and importer of cotton. Impressively, China accounted for about 20% of global cotton consumption, with a significant 84% of its production hailing from Xinjiang.
- Given the imperative to meet the needs of a growing population, there is an anticipated increase in the application of primary nutrients in field crops between 2023 and 2030.
China Fertilizers Industry Overview
The China Fertilizers Market is fragmented, with the top five companies occupying 12.84%. The major players in this market are Henan XinlianXin Chemicals Group Company Limited, ICL Group Ltd, Sinofert Holdings Limited, Xinyangfeng Agricultural Technology Co., Ltd. and Yara International ASA (sorted alphabetically).
Additional Benefits:
- The market estimate (ME) sheet in Excel format
- 3 months of analyst support
TABLE OF CONTENTS
1 EXECUTIVE SUMMARY & KEY FINDINGS
2 REPORT OFFERS
3 INTRODUCTION
- 3.1 Study Assumptions & Market Definition
- 3.2 Scope of the Study
- 3.3 Research Methodology
4 KEY INDUSTRY TRENDS
- 4.1 Acreage Of Major Crop Types
- 4.1.1 Field Crops
- 4.1.2 Horticultural Crops
- 4.2 Average Nutrient Application Rates
- 4.2.1 Micronutrients
- 4.2.1.1 Field Crops
- 4.2.1.2 Horticultural Crops
- 4.2.2 Primary Nutrients
- 4.2.2.1 Field Crops
- 4.2.2.2 Horticultural Crops
- 4.2.3 Secondary Macronutrients
- 4.2.3.1 Field Crops
- 4.2.3.2 Horticultural Crops
- 4.2.1 Micronutrients
- 4.3 Agricultural Land Equipped For Irrigation
- 4.4 Regulatory Framework
- 4.5 Value Chain & Distribution Channel Analysis
5 MARKET SEGMENTATION (includes market size in Value in USD and Volume, Forecasts up to 2030 and analysis of growth prospects)
- 5.1 Type
- 5.1.1 Complex
- 5.1.2 Straight
- 5.1.2.1 Micronutrients
- 5.1.2.1.1 Boron
- 5.1.2.1.2 Copper
- 5.1.2.1.3 Iron
- 5.1.2.1.4 Manganese
- 5.1.2.1.5 Molybdenum
- 5.1.2.1.6 Zinc
- 5.1.2.1.7 Others
- 5.1.2.2 Nitrogenous
- 5.1.2.2.1 Urea
- 5.1.2.2.2 Others
- 5.1.2.3 Phosphatic
- 5.1.2.3.1 DAP
- 5.1.2.3.2 MAP
- 5.1.2.3.3 SSP
- 5.1.2.3.4 TSP
- 5.1.2.3.5 Others
- 5.1.2.4 Potassic
- 5.1.2.4.1 MoP
- 5.1.2.4.2 SoP
- 5.1.2.4.3 Others
- 5.1.2.5 Secondary Macronutrients
- 5.1.2.5.1 Calcium
- 5.1.2.5.2 Magnesium
- 5.1.2.5.3 Sulfur
- 5.2 Form
- 5.2.1 Conventional
- 5.2.2 Speciality
- 5.2.2.1 CRF
- 5.2.2.2 Liquid Fertilizer
- 5.2.2.3 SRF
- 5.2.2.4 Water Soluble
- 5.3 Application Mode
- 5.3.1 Fertigation
- 5.3.2 Foliar
- 5.3.3 Soil
- 5.4 Crop Type
- 5.4.1 Field Crops
- 5.4.2 Horticultural Crops
- 5.4.3 Turf & Ornamental
6 COMPETITIVE LANDSCAPE
- 6.1 Key Strategic Moves
- 6.2 Market Share Analysis
- 6.3 Company Landscape
- 6.4 Company Profiles
- 6.4.1 Coromandel International Ltd.
- 6.4.2 Grupa Azoty S.A. (Compo Expert)
- 6.4.3 Hebei Monband Water Soluble Fertilizer Co. Ltd
- 6.4.4 Hebei Sanyuanjiuqi Fertilizer Co., Ltd.
- 6.4.5 Henan XinlianXin Chemicals Group Company Limited
- 6.4.6 ICL Group Ltd
- 6.4.7 Sinofert Holdings Limited
- 6.4.8 Sociedad Quimica y Minera de Chile SA
- 6.4.9 Xinyangfeng Agricultural Technology Co., Ltd.
- 6.4.10 Yara International ASA
7 KEY STRATEGIC QUESTIONS FOR FERTILIZER CEOS
8 APPENDIX
- 8.1 Global Overview
- 8.1.1 Overview
- 8.1.2 Porter's Five Forces Framework
- 8.1.3 Global Value Chain Analysis
- 8.1.4 Market Dynamics (DROs)
- 8.2 Sources & References
- 8.3 List of Tables & Figures
- 8.4 Primary Insights
- 8.5 Data Pack
- 8.6 Glossary of Terms
02-2729-4219
+886-2-2729-4219
 几丁质肥料市场:2026-2032年全球市场预测(按应用、类型、原料、配方和分销管道划分)化肥市场:2026-2032年全球市场预测(依产品类型、作物类型、包装、施用方法、最终用户和分销管道划分)复合肥料市场:按产品类型、作物类型、物理形态和应用分類的全球市场预测,2026-2032年藻类肥料市场:2026-2032年全球市场预测(依原料、产品类型、通路及应用划分)颗粒肥料市场:依产品类型、作物类型、配方类型、施用方法、包装类型、使用时间、最终用户和销售管道划分-2026-2032年全球预测
 硅肥市场报告:按类型、形态、应用和地区划分(2026-2034年)
 ATS肥料市场规模、份额和成长分析:按产品类型、形态、应用、作物类型、最终用户、分销管道和地区划分 - 2026-2033年行业预测
 美国化肥:市场占有率分析、产业趋势与统计、成长预测(2026-2031)越南化肥:市场占有率分析、产业趋势与统计、成长预测(2026-2031)非洲化肥市场:市场占有率分析、产业趋势与统计、成长预测(2026-2031年)
▼